Comparative assessment of effect of copper nano- and microparticles in chicken
1Sergey Aleksandrovich Miroshnikov1, Elena Vladimirovna Yausheva1, Elena Anatolievna Sizova1,2, and Elena Petrovna Miroshnikova1,2
1State Educational Institution “All-Russian Research Institute of Beef Cattle Breeding”, Russian Federation, 460000, Orenburg, street January 9, 29 2Orenburg State University, Russian Federation, 460018, Orenburg, Victory avenue, 13
DOI : http://dx.doi.org/10.13005/ojc/310461
Article Received on :
Article Accepted on :
Article Published : 23 Dec 2015
We studied the influence of highly dispersed copper particles on the metabolism of broiler chicks after a single intramuscular injection. Preparations containing of copper nanoparticles, agglomerates of nanoparticles of copper and copper microparticles were used in the experiment. Intramuscular injections of copper nanoparticles stimulate growth and metabolic changes quickly. Nanoparticle agglomerates and microparticles promote the similar effect but it is extended. The maximum difference in live weight was observed on the fourth day following injection of copper nanoparticles. The injection of copper nanoparticle agglomerates was accompanied by a significant increase in live weight 7 days after injection. The preparation containing copper microparticles had the smallest effect on growth. These changes were observed 16 days after microparticle injection. Copper nanoparticles a day after injection promoted increase in red cell level, hemoglobin, copper and protein in blood serum. Copper nanoparticle agglomerates and microparticles changed protein and copper content in blood serum only 7 and 21 days after injection. Copper microparticles had prolonged effect. The copper preparations promoted an increase in the arginine content of the chicken liver. The results of studies can be used to improve microelement preparations.
KEYWORDS:nanoparticles; microparticles; arginine; chicken
Download this article as:| Copy the following to cite this article: Miroshnikov S. A, Yausheva E. V, Sizova E. A, Miroshnikova E. P. Comparative assessment of effect of copper nano- and microparticles in chicken. Orient J Chem 2015;31(4). |
| Copy the following to cite this URL: Miroshnikov S. A, Yausheva E. V, Sizova E. A, Miroshnikova E. P. Comparative assessment of effect of copper nano- and microparticles in chicken. Orient J Chem 2015;31(4). Available from: http://www.orientjchem.org/?p=13337 |
Introduction
Studies that justify the use of copper-containing nanomaterials for X-ray therapy of cancer gain widespread over the last years [1]. Copper nanoparticles are used as contrast agent for high-resolution magnetic resonance imaging characterization of human thrombus, tumors, etc. [2]; positron emission tomography [3]; as bactericidal preparations [4, 5]. Copper-containing bandages are known for their anti-microbial powers [6], etc.
Copper nanoparticles and compounds may be considered a good alternative to existing treatments. The results of studies confirm this fact [7].
One way to improve preparations containing metal nanoparticles is to control the size of the nanoparticle material. It is determined by the differences in biological properties of metal preparations for particles of different sizes [8, 9]. Decreasing nanoparticle size has been reported to increase the absorption of this element. It also changes biological action of the [10].
The objective of this research was to compare the biological effects of elemental copper nano- and microparticles after intramuscular injections to broiler chicken. Researches were performed to improve preparations containing metal nanoparticles.
Materials and Methods
Acquisition and Certification of Copper Preparations
Nanoparticles were synthesized by high-temperature condensation using Migen-3 at the Institute of Chemical Physics (Russian Academy of Sciences, Moscow, Russia). The synthesis strategy used has been described previously [11]. Microparticle preparations were purchased from Alfa Aesar GmbH & Co., RG. These materials were assessed by electron scanning and transmission microscopy using the following equipment: a JSM-7401F and a JEM-2000FX, respectively (“JEOL”, Tokyo, Japan). X-ray phase analysis was performed with a DRON-7 diffractometer. These assessments showed that the copper nanoparticles were 103 ± 2 nm in size. The particle cores were composed of 96.2 ± 4.5 %, (P ≤ 0.05) crystalline metal and 3.8 ± 0.3 % (P ≤ 0.05) metal oxide; the thickness of the oxide film on the surface of the nanoparticles was 6 nm. The copper microparticles were 40±0.5 mcm in size (puriss p.a. 99.5%, and the oxide film was 7 nm thick.
Copper nanoparticle preparations were tested for dispersion. Nanoparticle suspension was exposed to ultrasound [frequency 35 kHz, sound power 300 (450) W, oscillation amplitude 10 mcm].
Morphometric indices of the particle samples were obtained using by atomic force microscopy in contact mode using an SMM-2000 microscope (Russia). MSCT-AUNM cantilevers (Park Scientific Instruments, USA) with a spring constant of 0.01 nm and diameter of 15 – 20 nm were used during scanning. Quantitative morphometric analysis of the images was performed using standard microscope software. Quantitative morphometric analysis of the images was performed using standard microscope software.
According to the results of studies, we made a decision to treat nanoparticle suspensions for different times. Nanoparticles with size of 103 ±2 nm were subject to the ultrasonic treatment within 30 minutes. Nanoparticle agglomerates with size of 937±24.6 nm were obtained after the ultrasound treatment for 20 seconds.
In vivo Studies
Studies were performed in vivo on «Smena-7» broiler chicks in the experimental biological clinic of the Orenburg State University. Experimental research with animals was performed according to Russian Regulations (1987) and “The Guide for the Care and Use of Laboratory Animals” (National Academy Press Washington, D.C., 1996).
A total of 150 one-day-old hens from the cross flock “Smena-7” were purchased from the hatchery of the poultry production farm “Orenburgskaya”. Four groups of 30 broiler chickens were formed based on the results of 10-day growth and development monitoring. All chickens were housed and fed in the same conditions. At the age of 14 days, the chickens received 1 intramuscular injection in the thigh of copper nanoparticles (103 ± 2 nm; Group I), copper nanoparticle agglomerates (937 ± 24.6 nm; Group II), copper microparticles (40 ± 0.5 nm; Group III), or sterile saline (Group IV(Control)) 200 μl per head. Each agglomerate has approximately 9.08±0.25 particles, diameter 103 ± 2 nm. Copper solutions for the injections were prepared by mixing nanoparticles (or microparticles) with physiological saline to a volume of 200 μl. The resulting preparation was sterilized with ultraviolet light and then treated with ultrasound [frequency 35 kHz, sound power – 300 (450) W, oscillation amplitude – 10 mic]. The ultrasound treatment was 30 min for groups I and III and 20 seconds for group II.
Poultry chickens were fed and housed according to recommendations [12]. Chickens were fed with complete feed throughout the study. Composition of diet for the period from 14 to 21 days: wheat –32,4 %, corn – 17,3 %, wheat brad– 10 %, soybean meal – 20 %, sunflower meal – 10 %, corn gluten – 4 %, sunflower-seed oil – 5 %, salt – 0,3 %, limestone meal – 1 %.
Composition of diet for the period from 21 to 35 days: wheat– 34,7 %, corn – 10 %, wheat brad – 15 %, soybean meal – 20 %, sunflower meal – 10 %, corn gluten – 4 %, sunflower-seed oil – 5 %, salt – 0,3 %, limestone meal – 1 %. Chickens were provided with ad libitum access to water in nipple drinkers. Chicks were weighed daily for the duration of the experiment.
The birds were slaughtered at the ages of 15, 21 and 35 days (n = 5 for each timepoint). These timepoints corresponded to 1, 7 and 21 d, respectively, after injection with Cu. The mass content of amino acids in the liver was determined by capillary electrophoresis. Samples were prepared as follows: liver tissues were homogenized, dried at 60-70 °С and ground. Then, acid and alkaline (only for tryptophan) hydrolysis of the obtained liver samples was performed. Hydrolysis occurred at 110 °С within 14-16 h. The samples were filtered after the completion of acid hydrolysis (no filtration was performed after alkaline hydrolysis). Hydrolysates were mixed with reagents and evaporated under a warm air stream, and the dry residue was dissolved in distilled water and centrifuged. The obtained supernatant was studied by capillary electrophoresis.
To determine the morphological indices, blood was collected in vacuum tubes. For biochemical indices, vacuum tubes with a clot activator were used. The concentrations of erythrocytes, platelets, and monocytes were determined using an Automated Hematology Analyzer (URIT-2900 Vet Plus, URIT Medial Electronic Co., China). The concentrations of copper, and total protein were determined using a Сobas-8000 system (Roche).
Statistical processing of the data was performed using the software package Statistica 6.0. The calculated values included the arithmetic mean value (M) and the standard error of the mean (m). Results with P ≤ 0.05 were considered significant.
Results
Differences in live weight dynamics after injection of copper were demonstrated in studies in vivo are shown in Figure 1.
After the introduction of copper, the live weight in Group I was significantly greater the control values by 8.4 (P ≤ 0.01) % after 1 day, by 9.02 (P ≤ 0.01) % after 10 days, and by 5.07 (Р ≤ 0.01) % after 21 days. The maximum difference in live weight (6.5%; P ≤ 0.01) was observed on the seventh day following injection of copper nanoparticle agglomerates. The injection of copper microparticles was accompanied by an increase in live weight 16 days after injection (+9.1 %, P ≤ 0.01). The preparation containing iron microparticles had the smallest effect on growth. These changes were observed only 3 wk after microparticle injection (+7 to 8 %, P ≤ 0.01).
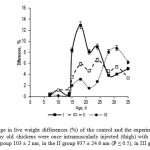 |
Figure 1: Change in live weight differences (%) of the control and the experimental groups of broiler chickens (n=30). 14-day old chickens were once intramuscularly injected (thigh) with elemental copper. Size of copper was in the I group 103 ± 2 nm, in the II group 937 ± 24.6 nm (P ≤ 0.5), in III group – 40 ± 0.5 µm Click here to View figure |
Size of particles influenced on concentration of crude protein in blood serum of chicken, it is substantiated by the previous studies [13]. Copper nanoparticles promoted the increase of protein in blood serum during the entire experiment: at 1 day (2.9 %; Р ≤ 0.05) and 7 days (20.5 %; Р ≤ 0.01), and 21 days (15.9 %; Р ≤ 0.01) following administration. Nanoparticle agglomerates and microparticles influenced on the concentration of protein in serum for a longer period within 7-21 days as shown in Table 1.
Table 1: Content of crude protein, ceruleoplasmin and copper in blood serum of broiler chicken
| Parameter |
Group |
Days after injection |
|||||
|
1 |
P |
7 |
P |
21 |
P |
||
| Crude protein, g/l | I | 24.6 ± 0.09* |
0.002 |
35.3±0.26** |
0.002 |
49.6±0.12** |
0.002 |
| II | 24.1±0.17 |
– |
31.2±0.14** |
0.011 |
44.4±0.17** |
0.001 |
|
| III | 24.3±0.07 |
– |
34.2±0.14** |
0.001 |
48.3±0.12** |
0.001 |
|
| IV | 23.9±0.12 |
– |
29.3±0.09 |
– |
42.8±0.12 |
– |
|
| Ceruleoplasmin, g/l | I | 0.064±0.002 |
– |
0.097±0.001** |
0.003 |
0.083±0.001** |
0.003 |
| II | 0.061±0.001 |
– |
0.078±0.001 |
– |
0.082±0.001* |
0.012 |
|
| III | 0.061±0.002 |
– |
0.094±0.001* |
0.014 |
0.083±0.001** |
0.005 |
|
| IV | 0.06±0.002 |
– |
0.075±0.001 |
– |
0.078±0.002 |
– |
|
| Copper, µmol /l | I | 7.98±0.03*** |
0.003 |
7.72±0.03* |
0.005 |
7.89±0.03 |
– |
| II | 7.34±0.03 |
– |
7.77±0.07*** |
0.001 |
8.13±0.05 |
– |
|
| III | 7.32±0.01 |
– |
7.55±0.19 |
– |
8.53±0.07*** |
0.002 |
|
| IV | 7.26±0.01 |
– |
7.4±0.07 |
– |
7.9±0.06 |
– |
|
*values within a row differ significantly at P ≤ 0.05; ** values within a row differ significantly at P 0.01; *** values within a row differ significantly at P ≤0.001
The used preparations were characterized by the different copper availability. It can be confirmed by the changes in copper level in blood serum of chickens. The smaller the particle size in preparation, the faster the copper content increased in the blood. It increase in Group I by 9.9 (Р ≤ 0.001) % at 1 day after injection, and by 4.3 ( Р ≤ 0.05) % at 7 day after injection. In Group II the increase was 5.0 (Р ≤ 0.001) % at 7 day following injection. Microparticles had prolonged action. The increase of copper in blood serum by 8.0 (Р ≤ 0.001) % was observed in Group III only 21 days after the injection.
No differences in ceruleoplasmin level after injections of copper preparations were observed.
The hemoglobin and erythrocyte concentrations a day after the introduction of copper nanoparticles increased by 34.1 % and 21.3 %, respectively, only in Group I. Similar influence of nanoparticles on blood parameters was observed in the studies with gold nanoparticles performed by Ghahnavieh et al. [14] and Orobchenko et al. [15].
Level of platelets was significantly different after the use of copper nanoparticle agglomerates. It became lower by 31.1 (Р ≤ 0.01) % at 1 day and by 44.8 (Р ≤ 0.01) % at 7 days following injection as shown in Table 2.
Influence of preparations on lymphocyte level did not differ. The concentration of lymphocytes increased significantly in all experimental groups during the first week of study. Group II is an exception, concentration of lymphocytes increased by 13.1 (Р ≤ 0.05) % 21 day following the injection. Cu nano- and microparticles promoted changes in the content of monocytes and granulocytes within the first day after injection. Agglomerates increased these values up to 7 day.
Table 2: Blood values of chickens after administration of nano-, microparticles and nanoparticle agglomerates of copper
|
Parameter |
Group |
Days after injection |
|||||
|
1 |
P |
7 |
P |
21 |
P |
||
| Erythrocytes, 1012/l | I | 2.79±0.10* | – | 2.88±0.26 | – | 3.13±0.01 | – |
| II | 2.1±0.17 | – | 1.90±0.35 | – | 3.05±0.01 | – | |
| III | 2.32±0.23 | – | 3.15±0.16 | – | 3.22±0.01 | – | |
| IV | 2.3±0.12 | – | 2.7±0.28 | – | 3.09±0.13 | – | |
| Hemoglobin, g/l | I | 142.4±5.9* | 0.014 | 115.4±9.2 | – | 132.9±4.8 | – |
| II | 75.4±9.4 | – | 98.4±7.6 | – | 131.3±6.9 | – | |
| III | 111.8±8.6 | – | 130.5±4.3 | – | 136±8.4 | – | |
| IV | 106.2±3.8 | – | 110.6±10.6 | – | 130.3±3.6 | – | |
| Platelets, 109/l | I | 58.6±3.9 | – | 81.2±5.9 | – | 100.3±6.7 | – |
| II | 51.4±1.9 ** | 0.016 | 61.1±2.1** | 0.005 | 88.7±2.3 | – | |
| III | 65±4.5 | – | 82±6.3 | – | 100.3±8.6 | – | |
| IV | 67.4±2.8 | – | 88.3±3.8 | – | 100.7±7.7 | – | |
| Lymphocytes, 103 mm3 | I | 13.1±0.44** | 0.012 | 15.1±0.14* | – | 13.9±0.2 | – |
| II | 13.8±0.21** | 0.001 | 21.6±0.36** | 0.004 | 15.5±0.27* | 0.013 | |
| III | 11.4±0.18 * | 0.013 | 15.6±0.21** | 0.002 | 14.4±0.26 | – | |
| IV | 9.91±0.2 | – | 13.9±0.27 | 13.7±0.27 | – | ||
| Monocytes, 103 mm3 | I | 2.3±0.02** | 0.015 | 1.84±0.01 | 1.9±0.08 | – | |
| II | 2.22±0.03** | 0.011 | 3.22±0.1** | 0.001 | 1.99±0.1 | – | |
| III | 2.32±0.21** | 0.003 | 1.92±0.11 | – | 1.88±0.13 | – | |
| IV | 1.61±0.01 | – | 1.8±0.04 | – | 1.83±0.07 | – | |
| Granulocytes, 103 мм3 | I | 12.9±0.11*** | 0.001 | 9.4±0.21 | – | 8.1±0.15 | – |
| II | 15±0.26*** | 0.002 | 20.2±0.23** | 0.002 | 7.93±0.18 | – | |
| III | 11.3±0.17*** | 0.001 | 9.75±0.26 | – | 7.93±0.15 | – | |
| IV | 8.9±0.07 | – | 9.12±0.12 | – | 7.84±0.18 | – | |
*values within a row differ significantly at P ≤ 0.05; ** values within a row differ significantly at P 0.01; *** values within a row differ significantly at P ≤0.001
The amino acid composition of the liver was estimated. There were no significant changes compared with that in the control group, except for arginine as shown in Figure 2.
An increase in Arg content was found in Group I at 1 day after injection of copper preparation 2.8 (Р ≤ 0.05) %. An increase of 4.38% and 2.08% (Р ≤ 0.05) was observed in Group I and II, respectively, at 7 days after injection. An increase of Arg was observed in Group III at 21 days after injection 4.56 (Р ≤ 0.05).
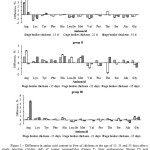 |
Figure 2: Difference in amino acid content in liver of chickens at the age of 15, 21 and 35 days after a single injection (14-day old) of copper nanoparticles (Group I), their agglomerates (Group II) and microparticles (Group III) in comparison with the control group. Click here to View figure |
Discussion
The analysis of the obtained data attests to the similar biological effects of copper particles with sizes ranging from 100 nm to 40 mcm. At the same time biological effects of preparations are closely connected with sizes of particles. Regularly, relatively smaller particles provide earlier biological effects. It can be confirmed by the increase in copper concentration in blood serum after the use of nanoparticles at 1 day after injection. Similar increase was observed 7 days after the injection of agglomerates, and copper microparticles 21 day following the injection.
Differences in action of particles of different sizes on concentration of hemoglobin and erythrocytes in blood have been demonstrated previously [16, 17].
In our studies it was established that period of increase in Arg concentration in liver depends on the particle size. It can be explained by the fact that arginine is closely connected with oxidative stress and inflammation [18, 19]. It is well-known that the increased surface area of preparations with decreasing particle size improves an ability to generate reactive oxygen species [20, 21]. This can explain that arginine concentration in the liver increased after the administration of nanoparticles at 1-7 days. After the introduction of the microparticles it increased only by 21 days.
Analysis of the growth stimulating effect of preparations demonstrates the close connection between the growth intensity of chickens and the concentration of arginine in the liver. It is noteworthy that arginine is the prime factor for maximizing growth potential in young animals [22, 23].
The growth-enhancing effects of L-Arg are associated with a change in the balance of the energy consumed and used for fat burning and a decrease in the production of white fat. L-Arg stimulates mitochondrial biogenesis and the production of brown adipose tissue [24]. Earlier [25] it was observed (Cobb 500) that dietary L-Arg supplementation reduced abdominal fat content by modulating lipid metabolism in chickens.
Increasing liver Arg concentrations may result from active macrophage synthesis in response to the introduction of iron particles. It us known that the synthesis of polyamines and Arg-containing proteins promotes the proliferation of monocytes and lymphocytes [26].
In our studies, the quantity of monocytes increased significantly by 1 day after injection of: copper nanoparticles by 42.9 %, agglomerates by 37.9% , microparticles by 44.1% compared to the control.
A similar increase of lymphocytes was 32.1; 39.3 and 12% respectively. Our data are consistent with the results of other authors [27, 28], who in their research showed the ability of metal nanoparticles of and their compounds to stimulate immune response.
The mechanism underlying increased Arg synthesis can be triggered in several ways, among which are boosting metabolism and the synthesis of nitric oxide (NO). Copper homeostasis and nitric oxide (NO) production are inversely related [29, 30].
Conclusions
The performed studies have shown the time differences in action of finely dispersed copper particles on the organism of broiler chickens. Intramuscular injections of copper nanoparticles stimulate growth and metabolic changes quickly. Nanoparticle agglomerates and microparticles promote the similar effect but it is extended.
Acknowledgment Research was done with financial support of the Russian
References
- Melancon M.P., Zhou M., Li C., 2011. Cancer theranostics with near-infrared light-activatable multimodal nanoparticles. Acc. Chem. Res. 44(10), 947-956.
- Liu D.F., Qian C., An Y.L. et al., 2014. Magnetic resonance imaging of post-ischemic blood-brain barrier damage with PEGylated iron oxide nanoparticles. Nanoscale. 6(24), 15161-15167.
- Liu D.F., Qian C., An Y.L. et al., 2014. Magnetic resonance imaging of post-ischemic blood-brain barrier damage with PEGylated iron oxide nanoparticles. Nanoscale. 6(24), 15161-15167.
- Ruparelia J.P., Chatterjee A.K., Duttagupta S.P., Mukherji S., 2008. Strain specificity in antimicrobial activity of silver and copper nanoparticles. ActaBiomater. 4, 707–716.
- Ahrari F., Eslami N., Rajabi O., Ghazvini K., Barati S., 2015. The antimicrobial sensitivity of Streptococcus mutans and Streptococcus sangius to colloidal solutions of different nanoparticles applied as mouthwashes. Dent. Res. J. 12(1), 44-49.
- Luo C., Li Y., Yang L. et al., 2014. Activation of Erk and p53 regulates copper oxide nanoparticle-induced cytotoxicity in keratinocytes and fibroblasts. Int. J. Nanomedicine. 10(9), 4763-4772.
- Bogoslovskaya O. A., Sizova E.A., Polyakova V. S., Miroshnikov S.A., Leipunsky I.O., Olkhovskaya I.P., Glushchenko N.N., 2009. Studying safety of introduction of copper nanoparticles with various physical and chemical characteristics in organism of animals. The Bulletin of the Orenburg State University. 2, 124-127.
- Prietl B., Meindl C., Roblegg E., Pieber T.R., Lanzer G., Fröhlich E., 2014. Nano-sized and micro-sized polystyrene particles affect phagocyte function. Cell BiolToxicol. 30(1), 1-16.
- Cho W.S., Kim S., Han B.S., Son W.C., Jeong J., 2009. Comparison of gene expression profiles in mice liver following intravenous injection of 4 and 100 nm-sized PEG-coated gold nanoparticles. Toxicol Lett. 191, 96–102.
- Rohner F., Ernst F.O., Arnold M., Hilbe M., Biebinger R., Ehrensperger F., Pratsinis S.E., Langhans W., Hurrell R.F., Zimmermann M.B., 2007. Synthesis, characterization, and bioavailability in rats of ferric phosphate nanoparticles. J Nutr.Mar. 137(3), 614-9.
- Zhigach, A.N., Leypunsky I.O., Kuskov M.L., Stoyenko N.I., Storozhev. V.B., 2000. Equipment for receiving and research of physical and chemical properties of nanoparticles of metals (in Russian). Devices and experimental technique. 6, 122-129.
- Fisinin V.I., Imangulov Sh.A., Egorov I.A., Okolelova T.M., 2000. Recommendations for feeding poultry. All-Russian Scientific Research and Technological Institute of Poultry. Sergiev Posad,. pp.62-67.
- Borisevich V.B., Kaplunenko V.G., Kosinov N.V. et al., 2012. Nanomaterials and nanotechnologies in veterinary practice. VD Avitsena. Kiev, pp. 508-512.
- Ghahnavieh M Z, Ajdary M, Naghsh N., 2014. Effects of intraperitoneal injection of gold nanoparticles in male mice J Nanomedicine 2014. 1(3), 121-127.
- Orobchenko A.L., Romanko M.E., Kutsan A.T., 2014. Dinamics of blood clinical indicators of laying hens under chronic entry of nanocomposite forage (Ag, Cu, Fe and Mn dioxide) and salts of metals (in Russian). Veterinary science, zootechnics and biotechnology. 4, 12-18.
- Zhang X.D., Wu D., Shen X., Liu P.X., Yang N., Zhao B., Zhang H., Sun Y.M., Zhang L.A., Fan F.Y., 2011. Size-dependent in vivo toxicity of PEG-coated gold nanoparticles Int J Nanomedicine. 6, 2071-81.
- Yang L., Kuang H., Zhang W., Aguilar Z.P., Xiong Y., Lai W., Xu H., Wei H., 2015. Size dependent biodistribution and toxicokinetics of iron oxide magnetic nanoparticles in mice. Nanoscale. 7(2), 625-36.
- Huang C.C., Tsai S.C., Lin W.T., 2008. Potential ergogenic effects of Arginineinine against oxidative and inflammatory stress induced by acute exercise in aging rats. Exp Gerontol. 2008. 43(6), 571–577.
- Mostafavi-Pour Z Zal F Monabati A Vessal M., 2007. Protective effects of a combination of Quercetin and vitamin E against cyclosporine A-induced oxidative stress and hepatotoxicity in rats. Hepatol Res. 38(4), 385–392.
- Li N., Sioutas C., Cho A., Misra C., Sempf J., Wang M., Oberley T., Froines J., Nel A. 2003. Ultrafine particulate pollutants induce oxidative stress and mitochrondrial damage. Environ Health Perspect. 111, 455–460.
- Møller P., Jacobsen N.R., Folkmann J.K., Danielsen P.H., Mikkelsen L., Hemmingsen J.G., Vesterdal L.K., Forchhammer L., Wallin H., Loft S., 2010. Role of oxidative damage in toxicity of particulates. Free Radic Res. 44(1), 1–46.
- Flynn N.E., Meininger C.J., Haynes T.E., Wu G., 2002. The metabolic basis of arginine nutrition and pharmacotherapy. BiomedPharmacother. 56, 427–438.
- Wu G., Knabe D.A., Kim S.W., 2004. Arginine nutrition in neonatal pigs. J Nutr. 134(10). 2783S-2790S.
- McKnight J.R., Satterfield M.C., Jobgen W.S., Smith S.B., Spencer T.E., Meininger C.J., McNeal C.J., Wu G., 2010. Beneficial effects of L-arginine on reducing obesity: potential mechanisms and important implications for human health. AminoAcids. 39(2), 349-57.
- Fouad A.M., El-Senousey H.K., Yang X.J., Yao J.H., 2013. Dietary L-arginine supplementation reduces abdominal fat content by modulating lipid metabolism in broiler chickens. Animal. Aug. 7(8), 1239-45.
- Suchner U., Heyland D.K., Peter K., 2002. Immune-modulatory actions of arginine in the critically ill. Br J Nutr. 87, 121–S132.
- Yu S.S., Lau C.M., Thomas S.N., Jerome W.G., Maron D.J., Dickerson J.H., Hubbell J.A., Giorgio T.D., 2012. Size- and charge-dependent non-specific uptake of PEGylated nanoparticles by macrophages. Int J Nanomedicine. 7, 799-813.
- Hamrahi-michak M., Sadeghi S.A., Haghighi H., Ghanbari-kakavandi Y., Razavi-sheshdeh S.A., Noughabi M.T., Negahdary M., 2012. The toxicity effect of cerium oxide nanoparticles on blood cells of male Rat. Annals of Biological Research. 2012. 3(6), 2859-2866.
- Fritsche G., Dlaska M., Barton H., Theurl I., Garimorth K., Weiss G., 2003. Nramp1 functionality increases inducible nitric oxide synthase transcription via stimulation of IFN regulatory factor 1 expression. J. Immunol. 171, 1994–1998.
- Nairz M., Schleicher U., Schroll A., 2013. Nitric oxide-mediated regulation of ferroportin-1 controls macrophage iron homeostasis and immune function in Salmonella infection. ExpMed. 210(5), 855-73.

This work is licensed under a Creative Commons Attribution 4.0 International License.
About The Author
![]()
A New Edition of Web of Science
Journal Impact Factor
2022: 0.5
Five Year: 0.8
Journal is Indexed in

Cabells Whitelist
![]()


