Treatment of Dye Textile by the Moleculars Sieves in the Gas Industry
Ms. Belarbi Lamia*, Hadjel Mohammed
Department of Chemistry USTO, Teacher at ESG2E Member of the Science, Technology Laboratory and Process Engineering LSTGP.
Correspondence Author E-mail: belarbilamia@yahoo.fr
DOI : http://dx.doi.org/10.13005/ojc/310314
Article Received on :
Article Accepted on :
Article Published : 23 Jul 2015
Industrial waste generate a supplementary cost to companies seeing that they must, by the force of law , take in charge their wastes whether by their own means or through outside services. Molecular sieves used in the dehydratation section of natural gas, as a matter of fact those of type 4 Å used in GP1/Z complex in Sonatrach Algerian company, become as wastes as soon as they are saturated and with no possibility of regeneration. Within the scope of this work proposition to valorize these industrial wastes are put forward in the light of a series of analyses and experiments with distilled water and water polluted with Methylene blue textile dye using a prototype of filtration device. Eventually, a track is open in this work for further research valorization of the type 4 Å saturated molecular sieves in the gas industry.
KEYWORDS:Waste; molecular sieves 4 Å; industrial wastes; analysis; valorization
Download this article as:| Copy the following to cite this article: Lamia B. K, Mohammed H. Treatment of Dye Textile by the Moleculars Sieves in the Gas Industry. Orient J Chem 2015;31(3). |
| Copy the following to cite this URL: Lamia B. K, Mohammed H. Treatment of Dye Textile by the Moleculars Sieves in the Gas Industry. Orient J Chem 2015;31(3). Available from: http://www.orientjchem.org/?p=9903 |
Introduction
Many industries generate dye-bearing effluents during their produc-tion processes. Textile industries, in particular, are major consumers of water and release appreciable amounts of dyes in their effluents (Mohantry et al., 2006). The contamination of waste water with such dyes causes many important problems such as increasing the toxicity and chemical oxygen demand of the effluent, which has a detrimental effect on photochemical phenomena (Yasemin and Haluk, 2006). All of these dyes are synthetic and are composed by complex aromatic structures. Most of them can be carcinogenic and mutagenic, while they appear inert and non-biodegradable when discharged into waste streams (Ozer et al., 2007). Among them, Methylen blue ( MB ) is a cationic dye; whose risk related to its presence in waste water mainly arises from its harmful effect upon exposure to eyes, as well as possibility of nausea, vomiting and diarrhea (El-Sharkaway et al., 2007).Research for control/removal of harmful dyes is being carried out by using different treatment technologies, e.g. chemical coagulation–flocculation (Pollock, 1973), different type of oxidation processes (Eilbeck and Mattock, 1985), biological process (Ledakowicz et al., 2001), membrane-based separation processes (Purkait et al., 2006), and adsorption (Purkait et al., 2007). Each of the above processes has their own benefits and limitations. Adsorption techniques have proven successful in removing colored organic species with activated carbon being the most widely used adsorbent due to its high capacity for the adsorption of organic materials (Chen et al., 2001; Markovska et al., 2001). However, due to its high cost and the difficulty of regeneration, cheaper, more effective adsorbents such as zeolite (Hana et al., 2009), clays like kaolin (Li et al., 2010) and bentonite (Almeida et al., 2009) are being considered as alternative low-cost adsorbents.
Adsorption of organic molecules to an adsorbent depends on various factors like temperature, pH of the solution, the structure and concentration of the adsorbing molecule, the ionic strength of the dispersion,and the structure of the adsorbent. However, adsorption over a surface with highly ionic character is mostly effective and very fast for a dye with opposite ionic character. Kaolin and zeolite are two examples of the very common low costs natural mineral adsorbent with ionic crystalline structure. Kaolin is one of the well-known low cost natural clays, available worldwide in rocks as crystalline structure. The use of kaolin as adsorbent may be very much economical. Many studies are carried out with different zeolites, due to its properties and characteristics (Melo et al., 2012; Peric et al., 2004; Wang and Zhu, 2006). The structure of zeolites consists of three-dimensional frameworks of SiO4 and AlO4 tetrahedral. The aluminum ion (Al) is small enough to occupy the position in the center of the tetrahedron of four oxygen atoms,and the isomorphous replacement of Si4+ by Al3+ produces a negative charge in the lattice. The net negative charge is balanced by the exchangeable cation (Na+ , K+ , or Ca2+ ). These cations are exchangeable with certain cations in solutions (Barer, 1987).Our work is part of the preparation of the magisterium thesis in management and environmental control.It is to study the molecular sieve present in the dryers of GP1 / Z complex.Molecular sieves are new unique and interesting adsorbers are currently available.These new materials are indeed a family of adsorbent agents, sometimes known by the misleading name and can be too restrictive molecular sieves.Molecular sieves are crystalline hydrated aluminosilicates of metals with a certain number of unusual properties.
Important commercial types of molecular sieves are made of synthetic material, but their structure is relatively similar to some natural minerals to be classified as zeolites.
The Swedish Cronstedt discovered a mineral (stilbite) which, due to its high water content, the swelling when heated in a flame to this new family The history of zeolites began in earnest with the discovery, there are 250 years by the mineralogist minerals (hydrated aluminosilicate) Cronstedt gave the name of zeolites derived from the Greek words zeo and lithos: stone boiling.For nearly 200 years, zeolites were still mainly used for the beauty of their crystals (jewelry). It is the advent of synthetic zeolites and simultaneously the discovery of large sedimentary basins that allowed their use in many applications.
Note that it is almost impossible to have homogeneous Natural zeolites batch composition and properties, greatly limiting their industrial use reserving them for special purposes directly related to man and his environment (insulating building materials, fish farming, livestock, etc.). Specialists in synthesis of zeolites were (and still are) particularly creative: thus while only forty different zeolites have been found in nature, more than 130 were synthesized.
Furthermore, the field of the synthesis remains wide open, the oretical considerations suggest the possibility of a much higher number of zeolite structures. There are several chemists who worked on zeolites namely Kenji Ikrda and Contributors which demonstrated the fixed bed adsorption isotherm for a favorable [1] and Mr. Betemps which was the study of the spread of cross-correlation gas in molecular sieves [2], Contributors see M.Bakassa and that made the study of adsorption and desorption of liquid water by drying a superabsorbent polymer gel by conventional heating [3] as Ahcène Soualah and colabarateurs who study synthesis and characterization of ZSM-5 zeolites [4] and Nassira Benharrat and Belbachir Mohamed made a synthesis of poly tetrahydr of uran catalyzed kaolin Tamazert [5] other study were made by MG Oktug Ahunbay on gas penetration through a zeolite laminae, [6] there J.Patarin and Contributors who made a research on nanoporous [7] as found Orhan Ozdemir and Contributors worked on the anionic adsorption on a meerschaum area [8]; see also Mariane Guillemot and its Contributors who study the adsorption tetrachlorethylene through a zeolite in a gas [9], Maryam Takht Ravanchi to study the application of a menbrane separation in a process Petrochemie [10], we find the study of Ahmed K . Helmy on the property surface sepiolites [11] and the study of the adsorption of a solution of Congo Red in the Ca-bentonite [12] as one can find the study and characterization of adsorption of brilliant green in the kaolin [13] and finally the study of binary and tertiary effect crystalline textural exchange of zeolites [14] ect …
The management methodology of the thesis is as follows: After several regenerations molecular sieves and a useful life of ten years, these molecular sieves are buried at the complex GP1 / Z. The problem raised is no body n has made a thorough study of these molecular sieves to determine their classification as well as industrial waste to better manage it. Several trials and requests were made in this context by the complex GP1 / Z with the CRD-Boumerdes laboratory without any response and then the inventory saturated molecular sieve is buried at the complex, concern has been exposed by the delegates environmental and discussed at the environmental committee of the industrial zone at the meeting of the fourth quarter of 2008 and the following actions have been identified : 1 Proving the non-toxicity of the waste by a study and analysis. 2-In the light of the study report said the waste will be toxic or nontoxic. If the waste is toxic it will be treated as such and sent to a landfill while ensuring the regulations. However and if the waste is not toxic it will just, after warning the management of the environment, led to a landfill in order to be buried according to accepted standards We will work our structured as follows: First we will give a generality on waste and present the complex GP1 / Z, we will then make a socio-economic study of the molecular sieve saturated, then move to the management and enforcement strategy.In our practical part we will characterize the molecular sieve before and after use by the methods of analysis: XRD, TGA and DTA, TEM, IR, XRF, which will lead us to interpret and give results that resolution our problems.
If the waste is toxic it will be treated as such and sent to a landfill while ensuring the regulations. However and if the waste is not toxic it will just, after warning the management of the environment, led to a landfill in order to be buried according to accepted standards We will work our structured as follows: First we will give a generality on waste and present the complex GP1 / Z, we will then make a socio-economic study of the molecular sieve saturated, then move to the management and enforcement strategy.
After treatment in the calcining section to eliminate CO2, the gas passes into the dewatering section, which aims to remove any trace of water likely to solidify in cryogenic equipment.
Two dryers are installed in each train while one is drying while the other is in the regeneration phase.The service processes a flow dryer 274 000 Nm³ / hr, the desiccant used to remove water by the adsorption principle are molecular sieves [15].
Materials and methods
Adsorbate and adsorbe
Adsorption on Molecular Sieve is a surface phenomenon which corresponds to the fixing molecules of a fluid to the surface of a solid. Porous solids which have a large internal porosity and the pore of developed surface is of the order of several hundred m2 / g, are called adsorbents. The zeolitic molecular sieves are adsorbents which, by their crystalline structure well-defined pore size, additionally have a maximum selectivity of adsorption.
Methylene blue (Dimethylamino)-phenazathionium chlo-ride tetramethylthionine chloride) is a cationic dye with molecular Mass of 373.9 g/mol, and the wavelength of 665 nm which corresponds to maximum adsorbance. The Methylene blue used in this work was the analytical
grade one (Oran, Algeria).The adsorbents used in this study is zeolite (ECC International).
Methylene blue (or methylthioninium chloride) is a cationic dye with molecular Mass of 373.9 g/mol whose scientific name is 3,7-bis (dimethylamino) phenazathionium and the wavelength of 660 nm which corresponds to maximum adsorbance. The MB used in this work was the analytical grade one (Oran, Algeria).
Table1: prosperities of methylene blue
| Chemical structure | C6H18N3ClS_ |
| Appointed | 3,7bis dimethylamino) phenazathionium -5-iun chloride |
| pH | Alkaline |
| Solubility | 3,55 % |
| physical state | 25°C |
| Molecular mass | 319,85 g / mol |
It is soluble in water and slightly in alcohol. It was first synthesized in 1876 by Heinrich Caro.
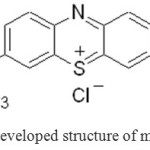 |
Figure1: developed structure of methylene blue Click here to View figure |
The X-ray diffractograms (not presented). The XRD pattern of the zeolite indicated the pure crystalline phase of zeolite 4Å [16].
The water desorption heat can reach 1800 BTU / Lb (including the heat required for the phase change of water/steam and rupture adsorption bonds).When adding to the three points above the heat lost by thermal inefficiency, the necessary heat can in fact be equal to 2.5 times the calculated value.The speed of the regeneration gas must be high enough to create a pressure drop of 0.226 kPa / m.This pressure drop ensures a good distribution of gas and prevents the formation of channels.After determining the thermal requirements of the bed, the total amount of heat to be supplied to the dewatering system can be estimated by multiplying the heat required to heat the bed and the accessories by the inverse of the process efficiency. The heating time is typically about 5/8 of the total regeneration time. In multi-bed systems, the total regeneration time is equal to the duration of the total cycle divided by the number of beds on adsorption. [17] The precise division of time between heating and cooling may be effected by comparing the heat necessary for heating the container and the molecular sieve to the total amount of heat required.The remaining time is used for the manipulation of valves, venting and cooling. The cooling time is much less than the heating time because there is less heat to transfer, corresponding only to the sensible heat of the adsorbent material and container. It has been determined that it is inefficient to heat for more than eight hours, a few of the weather adsorption. Cooling is usually determined so that the bed temperature is 10 ° C of the adsorption temperature.Sometimes it is not practical to cool the upper half of the bed and let him finish the feed gas cooling. [18] we did several analyzes to compare the molecular sieves used in the gas industry and new screens to the reused for treating wastewater.
Influence of pressure
The vapor pressure of water has considerable influence on the temperature of dehydroxylation of the zeolite. If it is high enough, it can change the nature of the reaction. The speed of dehydroxylation is therefore sensitive to the partial pressure of water vapor. If the partial pressure of steam is equivalent to the equilibrium pressure of water vapor, the rate of dehydroxylation within the particle will be considerably delayed. The mechanism of the reaction then depends on the speed of progression of the dehydroxylation in the particle. Over the partial pressure of steam increases, the speed is slowed dehydroxylation [19]. In order to clarify the influence of the pressure of water vapor when the dehydroxylation reaction, GW Brindley et al. [20]. used a model involving surface considerations. This model assumes that a fraction 0 of the surface is covered with water vapor molecules or saturated with water molecules chimiosorbées and that the reaction rate is proportional to the unsaturated area.
Results and Discussions
x-rays fluorescence ( XRF )
This is a method used for the quantitative analysis. RX fluorescence spectrometry involves sending X-rays, generated by a cathode ray tube, on the sample. These primary X-rays excite the atoms which in turn emit secondary X-radiation whose spectrum is analyzed by a spectrometer, see Figure1
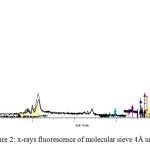 |
Figure2: x-rays fluorescence of molecular sieve 4Å unused Click here to View figure |
Table1: analysis by XRF results of unused molecular sieve
|
Elements |
Mass concentration of the oxide in % |
Mass concentration of the element en % |
|
Na2O |
5.75 |
4.26 |
|
Al2O3 |
34.8 |
18.4 |
|
SiO2 |
56.9 |
26.6 |
|
P2O5 |
0.42 |
0.18 |
|
K2O |
0.981 |
0.814 |
|
CaO |
0.527 |
0.377 |
|
TiO2 |
0.18 |
0.11 |
|
Fe2O3 |
0.20 |
0.14 |
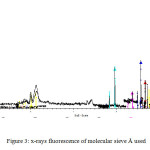 |
Figure3: x-rays fluorescence of molecular sieve Å used Click here to View figure |
Table2: Analysis by XRF results of used molecular sieve
|
Elements |
Mass concentration of the oxide in % |
Mass concentration of the element in % |
|
Na2O |
4.43 |
3.29 |
|
Al2O3 |
25.5 |
13.5 |
|
SiO2 |
54.7 |
25.6 |
|
P2O5 |
0.78 |
0.34 |
|
K2O |
1.02 |
0.844 |
|
CaO |
3.30 |
2.36 |
|
TiO2 |
0.312 |
0.187 |
|
Fe2O3 |
4.41 |
3.08 |
|
MgO |
1.78 |
1.07 |
|
SO3 |
3.76 |
1.51 |
x-rays diffraction ( XRD )
The X-ray diffraction technique aims to determine the state of crystallization of materials and their state amorphization after heat treatment. [21] The material to be analyzed is finely crushed and is screened to 100 microns. The analysis of the various products was conducted diffraction Center “diffractometer HUBER Guinier G670 implemented in 2002” (Laboratory UST UFR Chemistry lille).
Unlike known diffractometers that operate in reflection mode, it operates in transmission. In addition, the detector used (Image Plate) can acquire good quality very quickly diffractograms. It is therefore used to identify more specifically the synthesized phases.
A room Guinier G670 (Huber). It is equipped with a flat image and a monochromator allowing very rapid measures CuKα1 pure. It is further provided with a passer eight (08) samples and working in transmission.
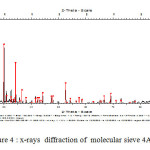 |
Figure4: x-rays diffraction of molecular sieve 4A used Click here to View figure |
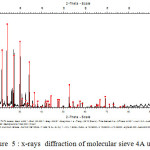 |
Figure5: x-rays diffraction of molecular sieve 4A unused Click here to View figure |
Fourier Transform infrared spectroscopy ( FT-IR ):
Infrared spectroscopy in the field of fundamental vibration between 200et 1300 cm-1 [22,23], tells us about the structural characteristics of the zeolites, in particular TO4 tetrahedra (T = Si or Al).
It identifies the crystalline phases and to monitor the progress of crystallization.
It also offers the advantage of studying amorphous phases. [24].
The infrared spectra of molecular sieve highlight two classes of vibrations see (fig.3,fig.4).
The internal vibrations of the tetrahedra aluminosilica framework are common to all molecular sieves.
They are represented by three adsorption bands of which the most intense is located between 950-1250 cm-1 [25, 26] and the other between 650-720 cm-1 and 420-500 cm-1 [27, 28,2 9] Figure 5 IR spectrum obtained by a molecular sieve 4Å used vibration for external connections between the tetrahedra and which are sensitive to the overall structure of the molecular sieve and the structural arrangement of subunits: the cut units, and polyhedral prismatic (sodality cage). They appear on the spectrum in the form of a plurality of adsorption bands of which, located between 50et 600 cm-1 [3O] is characteristic of the molecular sieve located between the 300 cm-1 and 420 cm-1 corresponds to the pore openings.
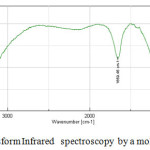 |
Figure6: Fourier Transform Infrared spectroscopy by a molecular sieve 4Å unused Click here to View figure |
Table3: Interpretation of absorption band in FTIR of molecular sieve 4Å unused
| Peaks | Interpretation |
| 673.99 cm-1 | Al-OH |
| 785.85 cm-1 | Al-O |
| 997.017 cm-1 | Si-O |
| 1659.45 cm-1 | Adsorbed water deformation |
| 3450.99cm-1 | Adsorbed water elongation |
the internal vibrations of the tetrahedra aluminosilica framework are common to all molecular sieves.
They are represented by three adsorption bands of which the most intense is located between 950-1250 cm-1 [25, 26] and the other between 650-720 cm -1 and 420-500 cm-1 [27, 28,29 ].
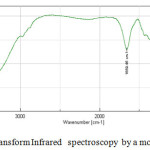 |
Figure7: Fourier Transform Infrared spectroscopy by a molecular sieve 4Å used Click here to View figure |
Table4: Interpretation of adsorption band of FTIR by a molecular sieve 4Å used
| peaks | Interpretation |
| 566.93 cm-1 | Al-OH |
| 667.25 cm-1 | Al-O |
| 1006.66 cm-1 | Si-O |
| 1659.45 cm-1 | Adsorbed water deformed |
| 3435.56 cm-1 | Adsorbed water elongation |
Scanning Electron Microscopy ( SEM )
The laboratory is equipped with a scanning electron microscope JEOL JSM 5300 with a microanalysis system X. It also works on the SEM field effect gun (FEG) of Hitachi S4700 brand located in the common center of electron microscopy of the Technological University of Lille. Microscopy essentially allows for images of a sample surface. It is equipped with a system of X-ray microanalysis for both the identification of elements and their quantitative assessments.The principle of the SEM is to use electrons emitted from the surface of a solid when it is bombarded with an electron beam whose energy is of the order of a few KeV. The electron beam emitted by a tungsten filament is first accelerated and then concentrated. An intermediate device allows the beam to scan the surface to be examined. The point of impact, more radiation is emitted, but only the secondary electrons and back scattered contribute to the formation of the image of the sample topography. This technique provides information on the morphology of the raw materials.
Dehydroxylation depends on the order or disorder of the zeolite. A disorderly dehydroxylated zeolite is fast and there remains no residual OH in métazéolithe. An orderly dehydroxylated zeolite is slowly because the structure tends to retain the hydroxyl last longer. The activation energy of the dehydroxylation of a disorderly zeolite is lower than that of an ordered zeolite. [31] Diffusion equations (D3) are determined from the particle size. S. Tsangari – AKHOUAYRI [32] observed a reduction of the activation energy characterizing the molecular sieve dehydroxylation when the particle size increases. Therefore, the activation energy is also a function of the pore size. Indeed, it decreases by about 25% during the dehydroxylation which makes water molecules diffusion processes through the very hard crystalline structure). [33] Some authors consider that the dehydroxylation reaction is the mechanism in a way depending on the size of the molecular sieve particles [34]; [HEIDE] observed that the dehydroxylation reaction is a simple chemical reaction to the sieve diameter of less than 6 mm. Against by the dehydroxylation reaction is a diffusion reaction for molecular sieve of diameter greater than 8 mm. The activation energy is lower for a molécualire sieve of diameter less than 6 mm (75 kJ mol-1) for one molecular sieve of diameter greater than 8 mm (100 kJ mol-1).
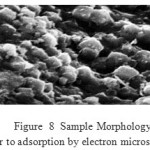 |
Figure8: Sample Morphology Prior to adsorption by electron microscopeClick here to View figure |
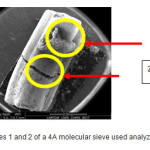 |
Figure9: Of Zones 1 and 2 of a 4A molecular sieve used analyzed by TEM Click here to View figure |
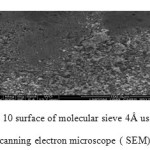 |
Figure10: surface of molecular sieve 4Å used by scanning electron microscope ( SEM) Click here to View figure |
Differential Thermal analysis ( DTA )
One of the most used to detect changes thermal of material is differential thermal analysis means (ATD) that highlights all phenomena taking place with an energy variation.
The DTA curve of a molecular sieve highlights 3 fig phenomena. 8
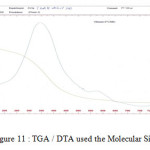 |
Figure11: TGA / DTA used the Molecular Sieve Click here to View figure |
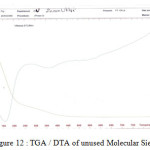 |
Figure12: TGA / DTA of unused Molecular Sieve Click here to View figure |
Dehydration: (endothermic peak of lower amplitude to 100 ° C)
This step is not a major transformation. This is water which physic sorbed departure does not change the crystal structure of the molecular sieve.
Recrystallization (exothermic peak around 350 ° C)
There is a structural rearrangement: So between 300 ° C and 400 ° C causes the change of coordinate aluminum atoms from the octahedral layer.
This structure is composed of several distinct areas:
-the amorphous regions segregated from silica and alumina.
-the mixed regions of SiO4, structuring the connecting tetrahedra 1 or 2 atoms of aluminum and still possessing a hydroxyl bonds -the traces of molecular sieves mothers
-the regions or silicon atoms contain hydroxyl groups.
Dehydroxylation (endothermic peak of large amplitude to 500 ° C)
This is the reaction in which the structural hydroxyls are removed from the molecular sieve.
The decomposition temperature depends on the origin of the experimental material and partial pressure of water vapor.
Maintaining a partial pressure of water vapor affects the dehydroxylation [35].
Dehydroxylation overall reaction can also be broken down into several steps.
The first step is the dissociation of hydroxyl groups and the water molecule formation.
This is the transfer of a proton between two hydroxyl groups but also the structural transformation.
First, a hydroxyl group dissociates to proton and oxygen ion, then the proton combines with another hydroxyl to form a water molecule.
These two reactions occur simultaneously. Some authors [Brindley, GW, and Al] [20]. think it unfolds from two adjacent hydroxyl. The reaction is said to
homogeneous, water molecules are produced within the structure and migrate through
the crystal lattice.
Dehydroxylation spreads from the surface to the center of the particle [36], after dissociation of the proton anion attack the nearest hydroxyl bond and form an oxygen bridge [37], provides a mechanism by which the reactions take place in the different regions of the particle.
Dehydroxylation develops from two distant hydroxyl groups.
After dissociation of the proton, it diffuses more rapidly than the water molecules, to
Because of its small size and migrates to a “free” site.
Then hydroxyl anion attacks a favorable connection to the reaction.
The second step is the elimination of the water formed out of the previous step, by diffusion within the particles.
This step can be the limiting process dehydroxylation.
The first water molecules easily escape from the crystal structure.
The new molecules of water formed can be trapped in the crystal lattice until the internal pressure is large enough to enable their evacuation by bursting of the particles or by breaking some chemical bonds.
Thermogravimetric analysis ( TGA )
The curves (ATG) are characterized by two inflections of mass loss between 10 ° C and 50°C is due to the evaporation of the free water contained in the molecular sieve pores within and between aggregates interarticular one second mass loss between 150 ° C and 450 ° C is attributed to loss of water and linked to the recombination of the hydroxyl groups located on the surface of pores to form siloxane bonds, with evolution of water as shown in Figure 8 and Figure 9.
Several Energy Dispersive X-ray spectroscopy ( EDAX)
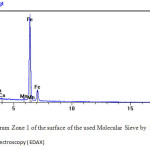 |
Figure13 : Spectrum Zone 1 of the surface of the used Molecular Sieve by Several Energy Dispersive X-ray spectroscopy ( EDAX) Click here to View figure |
Table5: Results of the analysis by several energy dispersive x-ray of molecular sieve used
| Element | keV | KRatio | Wt% | At% | ChiSquared |
| O | 0,523 | 0,0592 | 45,58 | 39,03 | 141,33 |
| Na | 1,041 | 0,0003 | 0,07 | 0,04 | 46,29 |
| Mg | 1,254 | 0,0001 | 0,01 | 0,01 | 46,29 |
| Al | 1,487 | 0,0006 | 0,08 | 0,04 | 46,29 |
| Si | 1,740 | 0,0010 | 0,12 | 0,06 | 46,29 |
| K | 3,313 | 0,0000 | 0,00 | 0,00 | 3,07 |
| Ca | 3,691 | 0,0002 | 0,02 | 0,01 | 3,07 |
| Mn | 5,898 | 0,0002 | 0,02 | 0,00 | 73,05 |
| Fe | 6,403 | 0,0064 | 0,76 | 0,19 | 73,05 |
| Mo | 2,293 | 0,0021 | 0,21 | 0,03 | 46,29 |
| C | 0,277 | 0,3760 | 53,12 | 60,59 | 141,33 |
| Total | 0,4459 | 100,00 | 100,00 | 61,25 |
Area 1 a
Dans le spectre de la zone 1a voir figure10 on trouve en plus des composantes du tamis moléculaires le fer en grande quantité plus des traces de Mn Table 5 Results of the analysis by TEM u molecular sieveet Ca.
Zone 1 a
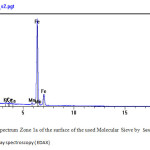 |
Figure14: Spectrum Zone 1a of the surface of the used Molecular Sieve by Several Energy Dispersive X-ray spectroscopy ( EDAX) Click here to View figure |
Table6: Results of the analysis by several energy dispersive x-ray of molecular sieve used
| Element | keV | KRatio | Wt% | At% | ChiSquared |
| C | 0,277 | 0,3644 | 53,50 | 61,13 | 220,25 |
| O | 0,523 | 0,0591 | 44,78 | 38,41 | 220,25 |
| Na | 1,041 | 0,0000 | 0,01 | 0,01 | 8,20 |
| Mg | 1,254 | 0,0000 | 0,01 | 0,00 | 8,20 |
| Al | 1,487 | 0,0001 | 0,01 | 0,01 | 8,20 |
| Si | 1,740 | 0,0002 | 0,02 | 0,01 | 8,20 |
| K | 3,313 | 0,0000 | 0,01 | 0,00 | 1,68 |
| Ca | 3,691 | 0,0001 | 0,01 | 0,00 | 1,68 |
| Mn | 5,898 | 0,0004 | 0,05 | 0,01 | 217,51 |
| Fe | 6,403 | 0,0126 | 1,50 | 0,37 | 217,51 |
| S | 2,307 | 0,0010 | 0,11 | 0,05 | 68,35 |
| Total | 0,4379 | 100,00 | 100,00 | 127,04 |
La même constatation pour la zone 1b voir figure11 sauf que les éléments O et Fe sont en grande quantité dans cette zone
Zone 1 b
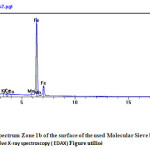 |
Figure14A : Spectrum Zone 1b of the surface of the used Molecular Sieve by Several Energy Dispersive X-ray spectroscopy ( EDAX) Figure utilisé Click here to View figure |
Table7: of the analysis by several energy dispersive x-ray of molecular sieve used
| Element | keV | KRatio | Wt% | At% | ChiSquared |
| C | 0,277 | 0,3448 | 49,78 | 57,25 | 369,21 |
| O | 0,523 | 0,0658 | 49,12 | 42,40 | 369,21 |
| Na | 1,041 | 0,0002 | 0,05 | 0,03 | 38,75 |
| Mg | 1,254 | 0,0001 | 0,02 | 0,01 | 38,75 |
| Al | 1,487 | 0,0004 | 0,06 | 0,03 | 38,75 |
| Si | 1,740 | 0,0008 | 0,09 | 0,05 | 38,75 |
| K | 3,313 | 0,0000 | 0,00 | 0,00 | 1,95 |
| Ca | 3,691 | 0,0001 | 0,01 | 0,00 | 1,95 |
| Mn | 5,898 | 0,0002 | 0,02 | 0,00 | 102,38 |
| Fe | 6,403 | 0,0065 | 0,78 | 0,19 | 102,38 |
| S | 2,307 | 0,0007 | 0,08 | 0,03 | 60,44 |
| Total | 0,4194 | 100,00 | 100,00 | 124,13 |
Pour la zone 2 voir figure 13 nous avons toujours onze éléments avec Fe et O en grande quantité et des traces de Mn.
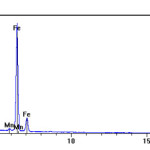 |
Figure15: Spectrum Zone 2 of the surface of the used Molecular Sieve by Several Energy Dispersive X-ray spectroscopy ( EDAX) Click here to View figure |
Table8: of the analysis by several energy dispersive x-ray of molecular sieve used
| Element | keV | KRatio | Wt% | At% | ChiSquared |
| C | 0,277 | 0,3703 | 53,31 | 60,81 | 220,87 |
| O | 0,523 | 0,0593 | 45,28 | 38,77 | 220,87 |
| Na | 1,041 | 0,0001 | 0,02 | 0,01 | 24,28 |
| Mg | 1,254 | 0,0000 | 0,01 | 0,00 | 24,28 |
| Al | 1,487 | 0,0007 | 0,10 | 0,05 | 24,28 |
| Si | 1,740 | 0,0006 | 0,07 | 0,03 | 24,28 |
| S | 2,307 | 0,0009 | 0,10 | 0,04 | 49,73 |
| K | 3,313 | 0,0001 | 0,01 | 0,00 | 2,95 |
| Ca | 3,691 | 0,0002 | 0,02 | 0,01 | 2,95 |
| Mn | 5,898 | 0,0002 | 0,03 | 0,01 | 97,13 |
| Fe | 6,403 | 0,0090 | 1,07 | 0,26 | 97,13 |
| Total | 0,4413 | 100,00 | 100,00 | 77,68 |
We note that our molecular sieve is not pure that impurities are collected and mixed with the components of the previous molecular sieve, we work under varying conditions of II Treatment of methylene Blue by molecular sieves used determination of the wavelength (λmax)
A scan over a range of 280 nm to 780 nm was carried out for a MB solution at a concentration of 10 mg / l at pH 6.5 the measurement results of absorbance are shown in Figure 13.
Figure 13: Absorption spectrum of methylene blue in aqueous solution [10 mg / l]
According to the absorption spectrum, the absorption wavelength of methylene blue is 66o nm.
Establishment of the calibration curve:
Solutions ranging from 1 mg / l to 50 mg / l were followed by measuring the absorbance Al 660 nm for methylene blue.
The curve depending on the concentration absorbance is shown in Figure 14.
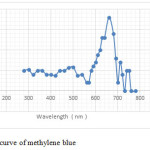 |
Figure16: Calibration curve of methylene blue Click here to View figure |
The relationship between the concentrations and the absorbances follows linearity with a correlation coefficient R2 = O, 996 for the methylene blue.
from the relationship: A = ξ (λ) .lc Beer Lambert.
Was the slope ξ (λ) = 0.039 lμ mol-1 cm-1 for methylene blue.
Used sieve adsorption on and treated:
After preparation of the samples they were carefully removed that is to say, we closed the crystallizer so that the materials do not adsorb moisture and were weighed three different mass m1, m2, m3, respectively 4 g, 18 g, 37 g, of each sample (4 Å used, 4Å used 100 ° C, 4 ° C A350), the masses are brought into contact with the methylene blue different concentrations C = 10 mg / l and C = 100 mg / l as an adsorption time of 24 hours and temperature T ° = 25 ° C.
The results shown in the two tables below are taken after adsorption:
Table 4: methylene adsorption capacity 10 mg / l for the zeolite (4Å used 4Å used 100 ° C, 4 ° C A350)
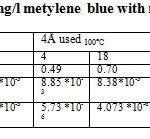 |
la Table9: Capacity of adsorption 10 mg/l metylene blue with molecular sieve 4 Å used Click here to View table |
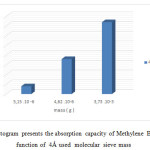 |
Figure17: Histogram presents the absorption capacity of Methylene Blue 10 mg/l in function of 4Å used molecular sieve mass Click here to View figure |
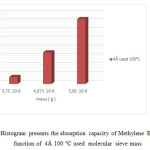 |
Figure18: Histogram presents the absorption capacity of Methylene Blue 10 mg/l in function of 4Å 100 °C used molecular sieve mass Click here to View figure |
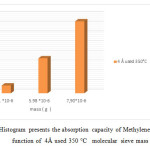 |
Figure19: Histogram presents the absorption capacity of Methylene Blue 10 mg/l in function of 4Å used 350 °C molecular sieve mass Click here to View figure |
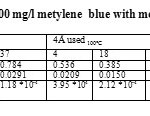 |
Table10: Capacity of adsorption 100 mg/l metylene blue with molecular sieve 4 Å used Click here to View table |
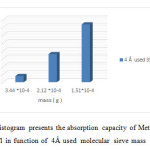 |
Figure20: Histogram presents the absorption capacity of Methylene Blue 100 mg/l in function of 4Å used molecular sieve mass Click here to View figure |
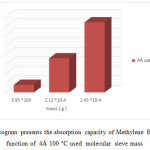 |
Figure21: Histogram presents the absorption capacity of Methylene Blue 100 mg/l in function of 4Å 100 °C used molecular sieve mass Click here to View figure |
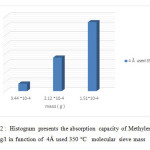 |
Figure22: Histogram presents the absorption capacity of Methylene Blue 100 mg/l in function of 4Å used 350 °C molecular sieve mass Click here to View figure |
Note that the used molecular sieves heated to 350 ° C have an adsorption capacity to raise more than heated to 100 ° c and the left at room temperature.
The concentration of methylene blue 100mg / l plays a more important role in the adsorption than 10mg / l. Our molecular sieves can be reused to revalue.
Conclusion
The type of waste used is a molecular sieve zeolite type A, it is an aluminosilica zeolite structural formula Na 12 (AlO 2) 12 (SiO2) 12, 27H2o,
The molecular sieve used is classified in the categories of inert waste because as they saw it contains a large amount of water and a large amount of magnetite proved by the characterization of this waste.
The characterization of this waste has shown the presence of water proved by differential thermal analysis method by comparing ATD / ATG molecular sieve used and not used.
The infrared spectrum of the zeolite used confirms the presence of hydroxyl ions in the band located between 1330 to 1430.
Regarding the structure of the waste the X-ray diffractometer telling us about this structure which is nothing other than aluminosilicate type A zeolite 4A ° in specific adsorption of water molecules.
Our test sample is completely covered by a film of magnetite which was determined by the physical test confirmed by chemical and physical method FRX why our waste is considered inert we can classified as non-hazardous waste, the landfill at level complex is not really dangerous.
After we made a simple wash with distilled water, we noticed with the naked eye that our sample changes color from black to white gray we repeated the same physical magnetism test, it was negative .We made a heat treatment at 100 ° C to remove water physiosorbée and 350 ° C to remove the pore water, finally we made several
applications of this waste:
- regeneration
- the scope of our waste: filtration
- Use of this inert material in the construction field addition to the cement.
- eliminating certain hazardous telque dyes in the textile field.
Knowing that The cost of dehydrator returned from a DA is 1283670 its life is 3 to 4 years, we know we have six trains and three trains per dehydrators our goal is to extended the life of this sieve Molecular by a simple practice at the laboratory scale by a single heat treatment and washing with distilled water, the result was positive, it is a waste present on the industrial site and a considerable amount we realized a pilot laboratory scale allowing us to use this molecular sieve used as a decontaminating wastewater.
References
- Ikeda, K ; Ohya , H ; Kanemitsu, O ; Shimomura, K.; Chem.Eng.Sci. 1977, 32, 619.
- Lee, L.K.;Yucel, H; the Canard.J.chem.Eng.1979,57,71-77.
- Belessi, V.C.;bCosta, C.N.; Efstathisu, A.M. ; Pomonis, P.J. ; Appl.Catal.,B,.2000, 28,13 .
- Soualah, A.; Berkani ; M.; Chater, M ; Comptes Rendus Chimie, 2004, 7, 713-720
- Ouis , N.; Benharrats, N.; Belbachir, M; Comptes Rendus Chimie, 2004, 7(8) ; 955-962
- Soualah, A.; Berkani; M.; Chater , M.; Comptes Rendus Chimie, 2004 , 7 , 713-720
- Ozdemir, O. ; çinar ; M. S; Journal of Hazardous Materials, 2007, 147, 625-632
- Riahi, G. ; Guillemot, D ; Pollisset, M ;Bonnin, D ; Fraisard, J.CRC Press, New York, 2007
- Guillemot, M ; Mijoin, J ; Mignard, S ; ind Eng. Chem.Res, 2007, 46 (13), 4614-4620.
- Kaghazchi, T. ; Mehri, M. ; Ravanchi, M.T. ;Kargari, A. ; International journal of Heat and Fluid Flow ; 2007, 28(4), 838-845
- Treacy, M.M.J. ; Higgins, J.B. ; Collection of simulated , 5th Revised Edition, 2007
- Helmy, A. K; de Bussetti, S.G.; Applied surface Science, 2008, 255, 2920-2924
- Guiza, S. ; Bagane, M. ; Revue des Sciences de l’eau / Journal of Water Science, 2013, 26(1) , 39-50
- Mane, V.S. ; Mall, I.D. ; Shrivastava, V.C.; J. Environ.Manage.2007, 84, 390-400.
- Department Technical Manual of GP1/Z Complexe Sonatrach, Algeria, Mers El Hadjaj.
- Rida, K ; Bouraoui, S. ; Hadnine, S. ; Applied Clay Science, 100, 83-84, 2013.
- Chue, K.T.,Kim, J.N., Yoo, Y.J., S.H., Yang, R.T., Ind.Eng.Chem.Res., 34,591-598,1995.
- Manuel opératoire séchage, 4 ,1984.
- Jonhson, H.B. ; Kessler , F. ; J. Amer.Ceram.Soc.1969, 4 (52 ), 199-204.
- Brindley , G.W. ; Lemmatize, J. ; Chem.Clay. Miner.1987, 319.
- Wilson , M.J. ; ed. A handbook of determinative methods in clay miner.,1987, 26-98.
- Dutta , P.K.; Barco , B.D. ; J.Phys.Chem.1989, 89, 1861,198.
- Angell , C.L. ; J.Phys.Chem.1973, 77 (2 ), 222-227.
- Fischer , K.F. ; Meier , W.M. ; Fortsehr. Miner.1965,42, 50.
- No , K.T. ; Bal , D.H. ; Jhon , M.S. ; J.Phys.Chem., 1986, 90, 1772.
- Miecznikowski , A. ; Hanuza , J. ; Zeolites 5 .1985. 364, 188-193.
- Dutta , P.K. ; Shieh, D.C.; Puri , M.; J.Phys.Chem.1987, 91, 2323.
- Mcmillan , P. ; Amer. Miner.1984, 69, 622.
- Griffith , W.P. ; J.Chem.Soc.A, 1969, 9, 1372.
- Dutta, P.K.; Barco , B.D. ; J.Phys.Chem.1988,92,354.
- Bellotto,M. ; Gualtieri, A. ; Artioli, G.; Clark, S.M.; Phys. Chem. Miner.1995.20,207-214.
- Tsangari-Akhouayri , S. ; Thèse de Doctorat , Université de Provence-Aix Marseille I , 1989,145.
- Stoch , L. ; J. Therm. Analys.1984, 29,919-931.
- Heide , K. ; Kluge , G. ; Hlawatsch, V. ; Thermochimi. Act.1980,36,151-160.
- Gniewek, J.; Thèse de Doctorat , INSA de Lyon.1987.184.
- Brindley , G.W. ; Nakahira , M. ; J. Amer. Ceram.Soc.1959,42,311-324.
- Taylor, H.F.W. , Clay Miner.Bull.1962,5,44-55.

This work is licensed under a Creative Commons Attribution 4.0 International License.
![]()
A New Edition of Web of Science
Journal Impact Factor
2022: 0.5
Five Year: 0.8
Journal is Indexed in

Cabells Whitelist
![]()


