The Synergistic Effect of Anionic Surfactant on Adsorption Enhancement of the Carotenoids Extract using Mesoporous Hydroxyapatite Nanoparticles
Supalak Kongsri1, Suchila Techawongstien2 and Saksit Chanthai1*
1Department of Chemistry and Center of Excellence for Innovation in Chemistry, Faculty of Science, Khon Kaen University, Khon Kaen 40002, Thailand.
2Department of Plant Science and Agricultural Resources, Faculty of Agriculture, Khon Kaen University, Khon Kaen 40002, Thailand.
Corresponding author E-mail: sakcha2@kku.ac.th
DOI : http://dx.doi.org/10.13005/ojc/310310
Article Received on :
Article Accepted on :
Article Published : 27 Jul 2015
Fish hydroxyapatite (FHAp) was prepared from fish scale waste by alkaline heat treatment. The obtained nanoparticles (21 nm) of FHAp with high crystallinity (89.5%) were used as biocompatible adsorbent for an adsorption of plant carotenoids extract. For optimum conditions of batch adsorption study, experimental parameters including pH of solution, adsorbent dosage, an initial concentration of carotenoids, amount of sodium dodecyl sulfate (SDS), contact time and temperature were investigated in details. From the results, the carotenoids adsorption of the FHAp was drastically enhanced in the presence of SDS through their hydrophobic interactions between the carotenoids and the cationic element FHAp via the anionic head of SDS by electrostatic and ion-exchange interactions and surface complexation. The adsorption behaviors fitted well by pseudo-second order kinetic model and Freundlich adsorption isotherm. Thermodynamic data demonstrated that the adsorption behaviors of the carotenoids on the hydroxyapatite nanoparticles were spontaneously endothermic and physisorption process.
KEYWORDS:Hydroxyapatite; Fish scale waste; Carotenoid; Freundrich adsorption isotherm
Download this article as:| Copy the following to cite this article: Kongsri S, Techawongstien S, Chanthai S. The Synergistic Effect of Anionic Surfactant on Adsorption Enhancement of the Carotenoids Extract using Mesoporous Hydroxyapatite Nanoparticles. Orient J Chem 2015;31(3). |
| Copy the following to cite this URL: Kongsri S, Techawongstien S, Chanthai S. The Synergistic Effect of Anionic Surfactant on Adsorption Enhancement of the Carotenoids Extract using Mesoporous Hydroxyapatite Nanoparticles. Orient J Chem 2015;31(3). Available from: http://www.orientjchem.org/?p=10067 |
Introduction
Fish waste is the residual by-product mostly generated from the fish processing industry. Almost all the waste is often deposited in an environment causing pollution and health problem. The use of this waste as alternative biomaterials has been increasingly encouraged the attention of researcher all around the world during last two decades. The utilizations of fish waste not only increase the production of value-added products but also reduce the amount of waste. Fish processing residues including scale, bone, skin, viscera and head are possible sources of proteins, unsaturated essential fatty acids, minerals and antioxidants1,2. The waste investigated in this study was the fish scale that contained a numerous valuable inorganic components, mainly hydroxyapatite (HAp) and was considered for hydroxyapatite source in recent years because of its widely available waste2-4.
Hydroxyapatite, formulated as Ca10(PO4)6(OH)2 is chemically similar to the main component of hard tissues in bones. It has high commercial value in manufacturing functional food, drug delivery, biomaterials, cosmetics and biomedical products. HAp can be produced either from natural source or synthesis process. This latter process is relatively complicated and expensive due to the use of high purity of reagents. The HAp derived from fish scale has the advantages that they inherit some chemical properties and can be processed by simple, inexpensive and environmental friendly. In this work, HAp was prepared from fish scale waste using alkaline heat treatment, which was modified from an alkaline hydrolysis method. The method was carried out using a mild agent (dilute hydrochloric acid and sodium hydroxide solutions) and soft conditions (temperature of 70-100°C). The preparation of HAp from fish scales is, thus, biologically safe, easy and cheap. A great interest towards the use of nanocrystalline HAp as an ideal adsorbent for a wide range of compounds (e.g. Cd, Pb, As, Mn, Al and Ni) because of its high adsorption capacity, low water solubility, availability, low cost and high stability under oxidizing and reducing conditions5-8. Some adsorption mechanisms are involved including ion-exchange, surface complexation, dissolution of HAp and precipitation of metal phosphates, substitution of Ca in HAp by metals during recrystallization (coprecipitation) which have been proposed in order to describe the uptake of heavy metals from aqueous solutions9,10. Nanocrystalline HAp has the ability to exchange their calcium, phosphate and hydroxyl ions with other ions without the loss of the crystalline structure. There are a few works reporting about antioxidants adsorbed on the HAp substrate. Thus, the antioxidant adsorbed by nanocrystalline of FHAp was investigated in order to improve the concern about the FHAp properties that can be utilized as medical materials.
Tomatoes are rich in carotenoids, especially lycopene. It is well known as a powerful antioxidant in the group of carotenoid compounds which play an important role to prevent human from the risk of cardiovascular disease and cancers by destruction of free radical intermediates11. It has been reported for some beneficial actions in bone diseases. Previous work showed that the daily consumption of lycopene may moderate the risk of osteoporosis12. Consequently, the incorporation of lycopene into apatites may actually be possible to use for pain relief of osteoporosis. From literature, no work of the lycopene incorporated into hydroxyapatite has ever been reported elsewhere.
In this study, the fish scale waste was utilized as a raw material to prepare nanocrystalline hydroxyapatite by alkaline heat treatment method. The possibility of using FHAp as an adsorbent for caroteniod adsorption in the presence of sodium dodecyl sulfate (SDS) was investigated for the first time. Other physiochemical parameters that influence the adsorption process in a batch adsorption including pH, adsorbent dosage, initial concentration and contact time were investigated. The experimental data were analyzed using adsorption isotherm, adsorption kinetic and thermodynamic parameters aiming for their adsorption process.
Materials and Methods
Preparation and characterization of FHAp nanoparticles
All chemicals were analytical reagent grade and the aqueous solutions were prepared using deionized water with a resistivity of 18.2 MW cm used throughout the experiment was from RiOsTM Type I Simplicity 185 (Millipore water, USA). Nanocrystalline of FHAp adsorbents used in this study was prepared by alkaline heat treatment. This method was described in our previous work13. Briefly, fish scale waste was initially deproteinized through an external washing with 0.1 M HCl and washed several times with distilled water. The remaining proteins of fish scale were treated with 5% (w/v) NaOH, heated and stirred at 70°C for 5 h. The obtained fine white precipitate was washed with distilled water and dried at 60°C. For the next step of alkaline heat treatment, 50% (w/v) NaOH was added into the treated scale powder, heated up to 100°C and stirred for 1 h. The obtained FHAp nanopowder was washed thoroughly with deionized water until the washing solution became neutral and then dried at 60°C.
The crystallinity and particle size of the FHAp sorbent was identified by X-ray diffraction (XRD), using Shimadzu model XRD-6000 with Cu Ka radiation (l = 1.5406 Å). The XRD patterns were collected from 2q = 20°-60° with scan step 0.02°. The specific surface area of nanocrystalline FHAp was determined by nitrogen adsorption at 77 K (Quantachrome Autosorb-1 Instrument). Surface area was calculated from adsorption data using Brunauer–Emmett–Teller (BET) equation. The determination of average pore size and pore volume was carried out at relative pressure (P/Po) equal to 1. The Fourier transform infrared spectroscopy (FT–IR) was done by Perkin Elmer Spectrum One with resolution of 4 cm-1 in the frequency range of 4000-400 cm-1.
Carotenoid extraction
Tomato powder (3 g) was extracted with 30 mL mixed solvent of hexane, ethanol and acetone (2:1:1, v/v/v) into Teflon extraction vessel. Each vessel was placed in microwave assisted extraction apparatus (Anton Parr 3000, Austria). The extraction was performed at a constant power of 300 W. After microwave heating, the mixtures in the extraction vessels were allowed to cool down at room temperature. The supernatants were filtered and hexane layer was evaporated off under reduced pressure at 50°C by a rotary evaporator (Büchi R-200 Rotavapor, Switzerland). Then, the residue was thawed into the flask before used and diluted to an appropriate concentration with ethanol. The quantitative analysis of the carotenoid content in the tomato extract was performed using a calibration curve of working standard solution of lycopene14.
Adsorption experiments
The batch adsorption experiments were performed at ambient temperature (30 ±2 °C). An adsorbent (0.1 g) was added into a 125-mL conical flask containing 25 mL of the carotenoid extract (10 mg L-1) with a fixed amount of SDS solution and the pH of the solution was adjusted and shaken by an orbital shaker (Yamato Scientific, Japan) at approximately 250 rpm until equilibrium was reached. In order to study the optimum conditions for the batch adsorption, various experimental parameters were studied including the effect of pH (3-10), SDS concentration, adsorbent dosage, initial concentration, ionic strength, contact time and temperature. After a period of shaking, the aqueous sample was centrifuged, and the residual concentration of the carotenoids in the supernatant was measured at 470 nm by UV-Visible spectrophotometer (Model 6400, Jenway, Germany).
All experiments were conducted in triplicate under the same conditions. The adsorption capacity (qe, mg g-1) of the carotenoid extract at the equilibrium state was determined as follows:
qe(1)= (Co -Ce) V/m (1)
where Co is the initial concentration (mg L-1) of the carotenoid extract in the mixture solution, Ce is the carotenoid concentration (mg L-1) at the equilibrium state, V is the volume (L) of the mixture solution, and m is the mass (g) of the adsorbent used.
Results and Discussion
Characterization of FHAp nanoparticles
The XRD pattern of FHAp nanocrystalline obtained from alkaline heat treatment method and the commercial hydroxyapatite were very similar (data not shown). The XRD (002), (211), (300), (202), (222) and (213) diffraction lines were used to evaluate the crystallite size by Scherer’s formula, giving its estimated crystal size of 21 nm. Since the sharpness of vibration bands relates to crystallinity, their crystallinity can also be calculated. For XRD, the crystallinity degree (Xc) of FHAp was evaluated by the relation:
where K is a constant found equal to 0.24 for a very large number of different HAp powders and B002 is FWHM (o) of reflection (002)15. The crystallinity of 89.5 % was obtained indicating good crystals and confirmed that all nanopowders were composed of a crystalline hydroxyapatite phase. For IR, the crystallinity index (CIIR) is calculated following equation:
CIIR = (A603 +A567)/ A590 (3)
where Axis the absorbance at the wave number x, assuming a straight baseline between 750 and 450 cm-1.16 The CIIR of 4 indicates also that FHAp is a crystal form.
The structural characterization was also analyzed by FT-IR (data not shown). The FTIR spectrum exhibited at 628, 590 and 567 cm-1 corresponding to the triple degenerate bending vibrations of phosphate groups in HAp and the sharpness of these peak indicates that the FHAp is crystalline. The broad band peaks at 3467 cm-1 and 1637 cm-1 are attributed to the –OH stretching and bending of the H2O molecules while the bands (876, 1458, and 1417 cm−1) are assigned to asymmetric stretching of the carbonate group (B-type carbonate)17,18.
Figure 1 shows the N2 adsorption–desorption isotherms of FHAp. The results represent the type IV adsorption isotherm with hysteresis loop which is associated with capillary condensation taking place in mesopores and the limiting uptake over a range of high P/Po. The initial part of the type IV adsorption isotherm is ascribed to monolayer-multilayer adsorption because it follows the same path as the corresponding part of a type II adsorption isotherm obtained with the given adsorption on the same surface area of adsorbent in a non-porous form. From the shape of the hysteresis loop pattern, FHAp can be classified with specific pore structures. This type of hysteresis loop shows no overlapping between adsorption and desorption of gaseous molecules. This indicates that a difference in mechanism between condensation and evaporation process takes place in pores with narrow necks and wide bodies like ink bottom pores. The result was confirmed by Barrett-Joyner-Halenda (BJH) adsorption as illustrated in the Fig. 1. The result from BJH adsorption plot shows that the pores are distributed as narrow pores indicating that mesopores (2-50 nm) are in the FHAp structure. Analysis of surface characteristics with BET and BJH models showed that the specific surface area of FHAp was 110.6 m2/g and the sizes of the pores were lower than 13.2 nm.
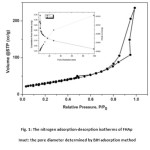 |
Figure1: The nitrogen adsorption-desorption isotherms of FHAp Inset: the pore diameter determined by BJH adsorption method
|
Adsorption of carotenoid from tomato extract
Effect of pH
The pH of an aqueous solution is an important parameter affecting the adsorption process because of ionization of both adsorbent and adsorbate in the solution. The effect of pH on the adsorption can be described on the basis of the pH of point zero charge (pHpzc), which is the point at which the net charge of the adsorbent is zero. The pHpzc of the FHAp was determined by the batch equilibrium method19. It was evident in our work13 that the FHAp exhibits excellent buffering properties and performs as a buffer over a wide pH range of 4-9 at 30°C. The surface properties of HAp in aqueous solutions were demonstrated as the following reactions5:
At pH < pHpzc, the HAp surface is protonated by hydrogen ions (H+) in the solution resulting in the surface of HAp becomes positively charged º CaOH2+ and neutral º POHo on HAp surface. In contrast, when the HAp surface is deprotonated by hydroxide ion (OH–) at pH > pHpzc, it produces the negatively charged º PO– and neutral º CaOHo. The pHpzc value of FHAp was previously reported to be 7.86. The effect of pH was investigated by determining the adsorption of carotenoids onto FHAp nanocrystals either in the presence or in the absence of SDS at pH ranging from 3 to 10 and the results are given in Fig. 2a. The results show that the adsorption capacity increased with increasing pH until pH 6 and it decreased at pH higher than this point. When the solution pH was below the pHpzc, anionic surfactant SDS was attracted to the positively charged surface of FHAp. The accumulation of anionic surfactant SDS on the surface leads to the interactions between carotenoid and SDS through hydrophobic interactions onto FHAp. Thus, the adsorption capacity of FHAp increased in the present of SDS. For pH values above 7.86, the FHAp is mainly negative charge. Since the electrostatic repulsion between anionic surfactant SDS and the active sites at the surface of FHAp, the adsorption capacities decreased with increasing of pH. The maximum adsorption capacities were 1.1004 and 0.8725 mg g-1 for SDS-FHAp and FHAp, respectively, at pH 6 implying the optimum pH for carotenoid adsorption. Therefore, the solution pH 6 was carried out throughout for further studies.
Effect of SDS concentration
The influence of SDS concentration was also considered in the adsorption of carotenoids on FHAp substrate as shown in Fig. 2b. The results are presented by plotting the adsorption capacity versus the concentration of SDS in the reaction mixture. It is clear that the adsorption of carotenoid on FHAp increased with increasing SDS concentration (below the critical micelle concentration, cmc) because of the release of phosphate ion from the FHAp surface. Above the cmc, the adsorption of carotenoid on the FHAp remained almost constant with the increase of SDS concentration because the SDS in the aqueous solution had become micelle form leading more stable than the aggregate formation on the FHAp surface20. Therefore, this study was done at the SDS concentration lower than the cmc point.
Effect of adsorbent dosage
Figure 2c shows the effect of adsorption dosage. The adsorption percentage (%) and adsorption capacity (qe) of carotenoid were plotted as a function of adsorbent dosage. It was observed that the adsorption percentages of adsorbent increase with increasing the adsorbent dosages. With the increase in SDS-FHAp dosage from 0.025 to 0.20 g, the adsorption percentages increased rapidly from 34.53 % to 72.79 % and approach a plateau at dosage higher than 0.15 g. This trend increased with increasing adsorbent dosage due to the increment of the available surface area and adsorption site; therefore, more adsorbate can be attached to their surfaces. On the other hand, the plot of adsorption capacity revealed that the decrease of adsorption capacity with increasing the adsorbent dosage is due to the unsaturated adsorption sites during the adsorption process21. This can be explained that the amount of adsorbent for adsorption increased but the amount of adsorbate remained the same. The optimum adsorbent dosages were considered at 0.15 g and 0.05 g for SDS-FHAp and FHAp, respectively, for further studies.
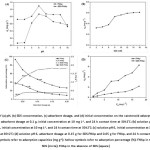 |
Figure2: Effects of (a) pH, (b) SDS concentration, (c) adsorbent dosage, and (d) initial concentration on the carotenoid adsorption. Adsorption conditions: (a) adsorbent dosage at 0.1 g, initial concentration at 10 mg L-1, and 24 h contact time at 30±2°C; (b) solution pH 4, adsorbent dosage at 0.1 g, initial concentration at 10 mg L-1, and 24 h contact time at 30±2°C; (c) solution pH 6, initial concentration at 10 mg L-1, and 24 h contact time at 30±2°C; (d) solution pH 6, adsorbent dosage at 0.15 g for SDS-FHAp and 0.05 g for FHAp, and 24 h contact time at 30±2°C. Symbols: full symbols refer to adsorption capacities (mg g-1); hollow symbols refer to adsorption percentage (%); FHAp in the presence of SDS (circle); FHAp in the absence of SDS (square) Click here to View figure |
Effect of an initial concentration of carotenoids
The effect of an initial carotenoid concentration was investigated in the range of 1-17.5 mg L−1 at pH 6. Fig. 2d shows a plot of adsorption capacity versus the initial concentration of carotenoid on both SDS-FHAp and FHAp. It was observed that the equilibrium adsorption capacity of the carotenoid increased proportionally with an increasing carotenoid concentration. This was attributed to a higher initial concentration provided a driving force to overcome all mass transfer resistances of the carotenoid between the aqueous and solid phase22. The adsorption capacity of SDS-FHAp shows the qe trend which is higher than FHAp, indicating that the present of SDS can enhance adsorption capacity drastically. In this study, Langmuir and Freundlich adsorption isotherms were also used to describe the experimental results. The Langmuir isotherm model23,24 assumes that an adsorption occurs on a homogenous adsorbent surface. The adsorption takes place only at specific sites of the adsorbent surface that is equally available and energetically equivalent, each site is carrying equal numbers of molecules and no interaction between the adsorbate molecules. The linear form of Langmuir isotherm model is valid for monolayer adsorption onto a surface, which can be written as follows25:
1/qe = 1/(qmKLCe) (6)
where qm is the maximum amount of the carotenoid adsorbed per unit weight of adsorbent (mg g-1) to form a complete monolayer covered on the surface at equilibrium carotenoid concentration, Ceis the concentration of carotenoid in aqueous solution at equilibrium (mg L-1), qe is the carotenoid adsorption capacity for adsorbent at equilibrium (mg g-1), KL is the Langmuir constant (L mg-1). The values of qm and KL can be calculated from the intercepts and slopes the of the straight line by plotting 1/qe versus 1/Ce (Fig. 3a). The model for Langmuir adsorption isotherm can be evaluated by dimensionless constant separation factor or equilibrium parameter, RL, given as the following equation26:
RL = 1/(1+KLCo) (7)
where C0is the initial concentration of carotenoid in aqueous solution (mg L-1). The RL value indicates at which the adsorption process is unfavorable (RL > 1) or favorable (0 < RL < 1). The RL values for the adsorption of SDS-FHAp and FHAp are illustrated in Table 1.
Table1: Langmuir and Freundlich isotherm data for the adsorption of the carotenoids extract onto the SDS-FHAp compared with FHAp itself
| Adsorbent | Langmuir isotherm | Freundlich isotherm | |||||
| qm | KL | RL | R2 | KF | 1/n | R2 | |
| (mg g-1) | (L mg-1) | [(mg g-1)(L mg-1)1/n] | |||||
| SDS-FHAp | 64.103 | 0.0052 | 0.9165 | 0.9894 | 0.2675 | 0.9183 | 0.9952 |
| FHAp | 7.8988 | 0.0146 | 0.7965 | 0.9706 | 0.1027 | 0.9699 | 0.9924 |
The Freundlich isotherm model assumes that the adsorption process occurs on a heterogeneous surface with difference in energy of adsorption sites and the adsorption capacity is related to the concentration of an adsorbate at equilibrium. The mathematical description of the model for Freundlich adsorption isotherm can be represented by the linear form as follows27:
Iog qe = Iog KF +1/nIog Ce (8)
where KF is the Freundlich constant related to the adsorption capacity (mg g-1)/(L mg-1)n and n is the intensity of adsorption. Values of 1/n are in the range 0.1 < 1/n < 1, the adsorption process is favorable. Both values of KF and 1/n were calculated from the intercepts and slopes of the plots of log qe versus log Ce (Fig. 3b). The constant values obtained from both Langmuir and Freundlich adsorption isotherms and their correlation coefficients, R2, were calculated and are also summarized in Table 1. It can be concluded that Freundlich isotherm model fitted the experimental data better than Langmuir isotherm model because of high value of the correlation coefficient (R2 > 0.99). A value of 1/n of 0.9183 indicates favorable adsorption and high affinity for carotenoids onto FHAp in the presence of SDS.
Effect of contact time
The effect of contact time on the adsorption of carotenoid onto SDS-FHAp and FHAp were investigated using 0.1 g dosage with 10 mg L-1 of the initial carotenoid concentration at pH 6 as shown in Fig. 4a. It was evident that the rate of adsorption increased rapidly at the initial period of contact time and then got down gradually with time until the adsorption reached at the equilibrium point as a plateau value in approximately 3 h and 6 h for SDS-FHAp and FHAp, respectively. No further adsorption was occurred with a prolonged contact time.
Kinetics of the adsorption is desirable information about the mechanism of adsorption, which is important for the adsorption process. The nature of the adsorption process depends on either physical or chemical characteristics of the adsorbent and the adsorbate. In order to elucidate the adsorption process of the carotenoid on both SDS-FHAp and FHAp, three kinetic models including a pseudo-first order, a pseudo-second order and an intraparticle diffusion models were used to analyze the experimental data. The pseudo-first order equation of Lagergren can be expressed as Eq. (9)28,29.
Iog (q1-qt) = Iogq1 – kIt (9)
where qt is the amount of carotenoid adsorbed at time t (mg g-1), q1 is the maximum adsorption capacity for pseudo-first-order kinetic model (mg g-1). k1 is the equilibrium rate constant of pseudo-first-order kinetic model (min-1). The values of k1 and q1 are calculated from slope and intercepts of the plots of versus t (as shown in Fig. 4b). The linear form of the pseudo-second order kinetic model is expressed by following equation30,31.
where qt is the amount of carotenoid adsorbed at time t (mg g-1), q1 is the maximum adsorption capacity for pseudo-first-order kinetic model (mg g-1). k1 is the equilibrium rate constant of pseudo-first-order kinetic model (min-1). The values of k1 and q1 are calculated from slope and intercepts of the plots of Iog (qe-qt) versus t (as shown in Fig. 4b). The linear form of the pseudo-second order kinetic model is expressed by following equation30,31.
t/qt = 1/(k2q22)+t/q2 (10)
where q2 is the maximum adsorption capacity (mg g-1) for the pseudo-second-order adsorption, qt is the amount of carotenoids adsorbed at equilibrium (mg g-1) at time t (min) and k2 is the rate constant of the pseudo-second-order adsorption (g (mg min)-1). The values of q2 and k2 were calculated from slopes and intercepts of the plots (as shown in Fig. 4c) of t/qt versus t.
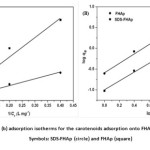 |
Figure3: Langmuir (a) and Frundlich (b) adsorption isotherms for the carotenoids adsorption onto FHAp in the presence and absence of SDS Symbols: SDS-FHAp (circle) and FHAp (square) Click here to View figure |
The rate-limiting step which is an important factor is used to predict the adsorption process. For a solid-liquid adsorption process, the adsorption of an adsorbent and adsorbate usually takes place through four steps: bulk solution transport, film diffusion, pore diffusion, and adsorption on the surface or pores. Generally, the rate-limiting step is determined by the slowest step, which may be either film diffusion or diffusion into particle pores (intra-particle diffusion) or both. To investigate whether or not the intra-particle diffusion is the rate-controlling step, the intra-particle diffusion model was expressed as31,32:
qt = kpt1/2 +C (11)
where qt is the amount of carotenoid adsorbed at equilibrium (mg g-1) at time t, C is the intercept and kp is the intraparticle diffusion rate constant (mg (g min1/2)-1). The values of kp and C were calculated from slopes and intercepts of the plots of qt versus t1/2 (Fig. 4d).
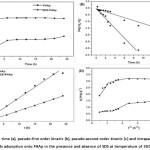 |
Figure4: Studies on contact time (a), pseudo-first order kinetic (b), pseudo-second order kinetic (c) and intraparticle diffusion kinetic (d) models for the carotenoids adsorption onto FHAp in the presence and absence of SDS at temperature of 30±2°C. For Symbols see Fig. 3 |
Figure 4d shows the intraparticle diffusion plots for adsorption of carotenoid on SDS-FHAp and FHAp. The adsorption processes have three steps involving an initial linear portion, a second linear portion and plateau portion32,33. The first portion, rapid sharper portion is attributed to the diffusion of adsorbate through the solution to the external surface of adsorbent or the boundary layer diffusion of solute molecules. The second portion describes the gradual adsorption stage where intra-particle diffusion is the rate limiting. The third portion is the final equilibrium stage where intraparticle diffusion starts to slow down due to extremely low adsorbate concentrations left in the solutions. An intraparticle diffusion model was used to determine the rate-limiting step of the adsorption process. If the intraparticle diffusion occurs, then qt versus t1/2 will be linear and if the linear plot passes through the origin, it evidents that the rate-limiting step is only due to the intraparticle diffusion. This figure shows the linear plots did not pass through the origin, indicating that the intraparticle diffusion was not only the rate-limiting step in this process. The C value was greater than zero for SDS-FHAp implying that more than one process affected in this adsorption process. For FHAp, the value of C is zero which indicates that the rate of adsorption is controlled by intraparticle diffusion over all adsorption process.
The kinetic parameters for carotenoid adsorption onto SDS-FHAp and FHAp were calculated from Eq. (9) – (11) and are shown in Table 2. It was found that the pseudo-second order model fitted the experimental data better than the pseudo-first order model. It was noted that the values of correlation coefficient were very high (R2 >0.999) and the calculated, qe,cal values were closer to the experimental qe,exp values.
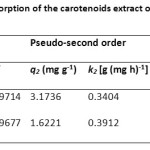 |
Table2: Adsorption kinetic data for the adsorption of the carotenoids extract onto the SDS-FHAp compared with FHAp itself |
Effect of temperature
In order to understand the effect of temperature on the adsorption process, both free energy change and entropy change factors should be considered to determine what processes will occur spontaneously. Thermodynamic parameters such as Gibbs free energy changes (ΔG°), enthalpy changes (ΔH°) and entropy changes (ΔS°) were calculated using the following equation28,34:
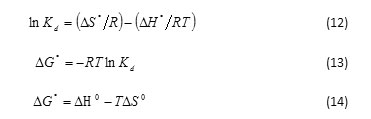
where ΔG ° is Gibbs free energy change (kJ mol-1), ΔH°is enthalpy change (kJ mol-1) and ΔS°is entropy change (kJ mol-1 K-1). T is temperature (K), R is gas constant (8.314 J mol-1 K-1) and Kd is distribution coefficient of adsorbent (mL g-1) and equal to Cs /Ce. Where, Cs and Ce are the amount of adsorbate adsorbed (mg g−1) and the adsorbate concentration (mg L-1) at the equilibrium state. The values of ΔH◦ and DS◦ could be obtained from slope and intercept of the plot of ln Kd versus 1/T at different temperatures. The data of thermodynamic parameters for the adsorption of carotenoid onto SDS-FHAp and FHAp are shown in Table 3. The negative values of ΔG ° at various temperatures indicated that the adsorption process of the carotenoid on these sorbents was spontaneous nature. The degree of spontaneity on adsorption process is also increased with increasing temperature. Meanwhile, the positive values of ΔH◦ showed that this adsorption process was endothermic nature, which can also be predicted from the increase of the carotenoid adsorbed on the adsorbent with increasing in temperature. In addition, the positive values of ΔS° can be explained that this process is an increment in the randomness at the solid/liquid interface during the adsorption of the carotenoid onto both SDS-FHAp and FHAp35.
Table3: Thermodynamic data for the adsorption of the carotenoids extract onto the SDS-FHAp compared with FHAp itself
| Adsorbent | ΔS° | ΔH° | ΔG° (kJ mol-1) | |||
| (J mol-1K-1) | (kJ mol-1) | 30 °C | 40 °C | 50 °C | 60 °C | |
| SDS-FHAp | 11.9971 | 2.8600 | -0.7747 | -0.8946 | -1.0145 | -1.1344 |
| FHAp | 60.7587 | 19.3134 | 0.8907 | 0.2840 | -0.3245 | -0.9322 |
Proposed adsorption interactions
At the surface of FHAp nanocrystal, there are three ion groups (phosphate ion, calcium ion and hydroxide ion) that can possibly interact with carotenoids in the presence of sodium dodecyl sulfate (SDS) through various mechanisms such as ion exchange, hydrophobic interaction and electrostatic forces. Therefore, the effect of adsorption and/or release of these ions were examined in order to support the mechanisms for the carotenoids sorption by FHAp. According to previous work20 described that sulfate group of SDS can be replaced with phosphate ion on the FHAp surface by an ion exchange mechanism because both phosphate and sulfate are oxoacidic and tetrahedral and the interatomic distance of S-O of sulfate group (1.49 Å) is slightly different from P-O of phosphate ion (1.55 Å), so it can easily substitute PO43‑ in the FHAp nanocrystal. Therefore, the one possible mechanism model is the formation of a monolayer at solid-liquid interface via an ion exchange between the sulfate group of SDS and the phosphate ion which occurred at the FHAp surface. After that, the carotenoids were adsorbed on the surface of the FHAp through hydrophobic interactions between polyunsaturated hydrocarbon of the carotenoids and the hydrocarbon tail of SDS at FHAp surface which is previously replaced. The relations between Ca2+ and PO43- released into solution after the adsorption experiment were measured to confirm the release of Ca2+ and PO43- from FHAp at different SDS concentration in solution (Fig . 5a and 5b). The result shows that an ion exchange mechanism is involved in the adsorption process. When the concentration of SDS is lower than cmc, it gave a good linear relationship between phosphate ion released into solution and an increasing of SDS concentration. On the other hand, the concentration of phosphate ion decreased with increasing SDS concentration above the cmc. In fact, SDS in aqueous solution is micelle form leading more stable than the aggregate formation on the FHAp surface resulting in the decrease in phosphate ion in solution. However, the ion exchange was not a dominant mechanism because no proportional ratio at 1:1 between the phosphate ion released and the SDS concentration was observed. Another possible mechanism may be an electrostatic interaction between the negatively charged dodecylsulfate of SDS and calcium ion on the surface site of FHAp20, which leads the carotenoid adsorption on the FHAp through hydrophobic interactions between the hydrocarbon tail of SDS and the hydrophobic part of the carotenoids. Therefore, the experiment should be performed at the concentration of SDS lower than the cmc to reduce the calcium released. FT-IR spectra of the carotenoid adsorptions in the presence or absence of SDS are shown in Fig. 5c. The new bands were obtained from the stretching vibration of =C-H at 3035 cm-1, the stretching vibrations of non-symmetric and symmetric methyl bands at 2970 and 2852 cm-1. It can confirm that the surface complex has occurred on the FHAp surface. Moreover, the electrostatic interactions between the protonated groups of the hydroxyl group (OH2+) of FHAp and the anionic SDS, followed by hydrophobic interactions between the tail of SDS and the hydrophobic part of the carotenoid can be occurred. Figure 6 illustrates the possible mechanisms of the carotenoid adsorption onto FHAp substrate in the presence of SDS.
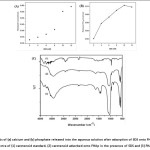 |
Figure5: The analysis of (a) calcium and (b) phosphate released into the aqueous solution after adsorption of SDS onto FHAp and (c) FT-IR spectra of (1) carotenoid standard, (2) carotenoid adsorbed onto FHAp in the presence of SDS and (3) FHAp Click here to View figure |
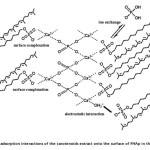 |
Figure6: The proposed adsorption interactions of the carotenoids extract onto the surface of FHAp in the presence of SDS Click here to View figure |
Conclusion
Nanocrystalline FHAp was prepared by alkaline heat treatment method. The adsorption of carotenoid from tomato extract carried out using nanocrystalline FHAp (with high specific surface area and crystallinity) in the presence of SDS. The carotenoid adsorption was enhanced by the hydrophobic group of SDS that adsorbed on the surface of FHAp via sulfate group. The adsorption was obeyed with Freundlich isotherm and well fitted by pseudo-second order kinetic model. The adsorption process was spontaneous, endothermic and physisorption process in nature. We expect this work to be utilized for many scientific fields such as pharmaceutical, medical, chemical applications and waste management.
Acknowledgements
The authors thank the Higher Education Research Promotion and National Research University Project of Thailand, Office of the Higher Education Commission, through the Food and Functional Food Research Cluster of Khon Kaen University (Grant No: NRU541019) for financial support. We are also grateful to the Center of Excellence for Innovation in Chemistry (PERCH-CIC), Commission on Higher Education, and Ministry of Education National for financial support.
References
- Ferraro, V.; Cruz, I. B.; Jorge, R. F.; Malcata, F. X.; Pintado, M. E.; Castro Paula, M. L. Food Res. Int. 2010, 43, 2221-2233.
- Huang, Y. C.; Hsiao, P. C.; Chai, H. J. Ceram. Int. 2011, 37, 1825-1831.
- Tongchan, P.; Prutipanlai, S.; Niyomwas, S.; Thongraung, C. As. J. Food Agric.-Ind. 2009, 2(04), 669-676.
- Mondal, S.; Mondal, B.; Dey, A.; Mukhopadhyay, S. S. J. Miner. Mater. Charact. Eng. 2012, 11, 55-67.
- Xu, Y.; Schwartz, F. W.; Traina, S. J. Environ. Sci. Technol. 1994, 28, 1472-1480.
- Chen, X.; Wright, J. W.; Conca, J. L.; Peurrung, L. M. Environ. Sci. Technol. 1997, 31(3), 624-631.
- Chaturvedi, P. K.; Seth, C. S.; Misra, V. Chemosphere 2006, 64, 1109-1114.
- Mobasherpour, I.; Salahi, E.; Pazouki, M. Desalination 2011, 266, 142-148.
- Sheha, R. R. J. Colloid Interface Sci. 2007, 310, 18-26.
- Corami, A.; Mignardi, S.; Ferrini, V. J. Hazard. Mater 2007, 146, 164-170.
- Rahman, K. Clin. Intervention Aging 2007, 2(2), 219-236.
- Rao, L. G.; Mackinnon, E. S.; Josse, R. G.; Murray, T. M.; Strauss, A.; Rao, A. V. Osteoporosis Int. 2007, 18, 109-115.
- Kongsri, S.; Janpradit, K.; Buapa, K.; Techawongstien, S.; Chanthai, S. Chem. Eng. J. 2013, 215-216, 522-532.
- Olives Barba, A. I.; Cámara Hurtado, M.; Sánchez Mata, M. C.; Fernández Ruiz, V.; López Sáenz de Tejada, M. Food Chem. 2006, 95, 328-336.
- Landi, E.; Tampieri, A.; Celotti, G.; Sprio, S. J. Eur. Ceram. Soc. 2000, 20, 2377-2387.
- Pucéat, E.; Reynard, B.; Lécuyer, C. Chem. Geol. 2004, 205, 83-97.
- Markovic, M.; Fowler, B. O.; Tung, M. S. J. Res. Nat. Inst. Stand. Technol. 2004, 109, 553-568
- Zaragoza, D. L.; Guzman, E. T. R.; Gutierrez, L. R. R. J. Miner. Mater. Charact. Eng. 2009, 8, 591-609.
- Corami, A.; Mignardi, S.; Ferrini, V. J. Colloid Interface Sci. 2008, 317, 402-408.
- Shimabayashi, S.; Nishine, S.; Uno, T.; Hino, T. ACS Symp. Ser. 2002, 105-116.
- Han, R. P.; Zou, W. H.; Zhang, Z. P.; Shi, J.; Yang, J. J. J. Hazard. Mater. 2006, 137, 384-395.
- Mobasherpour, I.; Salahi, E.; Pazouki, M. Arabian J. Chem. 2012, 5, 439-446.
- Wong, Y. C.; Szeto, Y. S.; Cheung, W. H.; McKay, G. Process Biochem. 2004, 39, 693-702.
- Konaganti, V. K.; Kota, R.; Patil, S.; Madra, G. Chem. Eng. J. 2010, 158, 393-401.
- Lin, K.; Pan, J.; Chen, Y.; Cheng, R.; Xu, X. J. Hazard. Mater. 2009, 161, 231-240.
- Hameed, B.; Salman, J.; Ahmad, A. J. Hazard. Mater. 2009, 163, 121-126.
- Sundaram, C. S.; Viswanathan, N.; Meenakshi, S. J. Hazard. Mater. 2008, 155, 206-215.
- Islam, M.; Patel, R. K. J. Hazard. Mater. 2007, 143, 303-310.
- Islam, M.; Mishra, P. C.; Patel, R. K. J. Environ. Manage. 2010, 91, 1883-1891.
- Ho, Y. S.; McKay, G. Chem. Eng. J. 1998, 70, 115-124.
- Gupta, N.; Kushwaha, A. K.; Chattopadhyaya, M. C. J. Taiwan Inst. Chem. Eng. 2012, 43, 604-613.
- Ahmad, A. L.; Chan, C. Y.; Shukor, S. R.; Mashitah, M. D. Chem. Eng. J. 2009, 148, 378-384.
- Moussavi, G,; Khosravi, R. J. Hazard. Mater. 2010, 183, 724-730.
- Wang, Y.; Chen, N.; Wei, W.; Cui, J.; Wei, Z. Desalination 2011, 276, 161-168.
- Zhang, D.; Luo, H.; Zheng, L.; Wang, K.; Li, H.; Wang, Y,; Feng, H. J. Hazard. Mater. 2012, 241-242, 418- 426.

This work is licensed under a Creative Commons Attribution 4.0 International License.
![]()
A New Edition of Web of Science
Journal Impact Factor
2022: 0.5
Five Year: 0.8
Journal is Indexed in

Cabells Whitelist
![]()


