Synthesis and characterization of manganese ferrite spinel for adsorption of malachite green from water
Saeedeh Hashemian*, Atena Dehghanpor, Mahnaz Moghahed
Chemistry Department, Islamic Azad University, Yazd Brunch, Yazd, Iran. Corresponding Author Emails Sa_hashemian@iauyazd.ac.ir
DOI : http://dx.doi.org/10.13005/ojc/310358
Article Received on :
Article Accepted on :
Article Published : 08 Aug 2015
The manganese ferrite spinel was synthesized by co-precipitation. The nano sized manganese ferrite characterized by X-ray diffraction (XRD), Scanning electron micrograph (SEM), tunneling electron micrograph (TEM) and Energy dispersive X-ray (EDX) techniques. The adsorption ability of malachite green (MG) from the aqueous solution by manganese ferrite was investigated. It was found that pH value of 2 and contact time 30 min is favorable for adsorption of malachite green by manganese ferrite. The adsorption process follows second-order kinetics and Arrhenius behavior.
KEYWORDS:Adsorption; manganese ferrite; malachite green; Synthesis
Download this article as:| Copy the following to cite this article: Hashemian S, Dehghanpor A, Moghahed M. Synthesis and characterization of manganese ferrite spinel for adsorption of malachite green from water. Orient J Chem 2015;31(3). |
| Copy the following to cite this URL: Hashemian S, Dehghanpor A, Moghahed M. Synthesis and characterization of manganese ferrite spinel for adsorption of malachite green from water. Orient J Chem 2015;31(3). Available from: http://www.orientjchem.org/?p=10199 |
Introduction
Spinels are important class of mixed-metal oxides, which has the general chemical composition of AB2O4. They are very important magnetic materials because of their interesting magnetic and electrical properties with chemical and thermal stabilities1. The ferrite spinels have wide application in industrial as well as re- search areas. Among spinel compounds, manganese spinel ferrites (MnFe2O4) have received much research attention owing to both broad practical applications in several important technological fields such as ferrofluids, magnetic drug delivery and magnetic high-density information storages. The ferrite spinels also were used for degradation of organic pollutants and dyes in wastewater treatments2-6.
Recently, they received increased attention for their application as negative contrast agents (CAs) in magnetic resonance imaging (MRI). Indeed super paramagnetic MnFe2O4 nanoparticles were found very useful in MRI for the detection of tumors and definition of damaged zones in local oedemas or hemorrhages7.
Dyes and pigments are widely used, mostly in the textiles, paper, plastics, leather, food and cosmetic industry to color products. Most of the dyes are toxic and carcinogenic. Dye removal from different industrial wastewaters is of major environmental concern because dyes create severe environmental problems8-11.
Malachite green is classified in the dyestuff industry as a triarylmethane dye and also using in pigment industry. Malachite green also is used as a direct dye for silk, wool, jute, and leather and to dye cotton that has been mordanted with tannin. Removal of Malachite green by different sorbents was studied12-16.
The first aim of the present study is to synthesize and characterize manganese ferrite spinel. Adsorption studies of malachite green dye by manganese nano spinels is second aim of this work.
Experimental
Materials and methods
All of compounds were analytical grade and were used as received without any purification. The all of chemicals were purchased from Merck chemical co.
1 mmol of manganese (II) chloride and 2 mmol ferric chloride were dissolved in the distilled water and then under vigorous magnetic-stirring at 70 °C, NH3 solution (5 %) was added drop wise to raise the suspension pH to around 9 and the stirring was continued for 1 h. After being cooled, the prepared manganese ferrite was repeatedly washed with distilled water and dried in an oven at 100 °C for 2h17.
Malachite green as a sample of pollutant was used. Malachite green (MG) has chemical formula C27H34N2O4S. It has molecular weight of 482.63 g mol-1. The standard solution of MG 1000 g L-1 was prepared and subsequently whenever necessary diluted. UV-Vis spectrophotometer 160 A Shimadzu was used for determination of concentration of MG. IR measurements were performed by FTIR tensor-27 of Burker Co., using the KBr pellet between the ranges 400 to 4000 cm-1. The powder X–ray diffraction studies were made on a Philips PW1840 diffractometer using Ni-filtered Cu kα radiation and wavelength 1.54˚A. The average particle size and morphology of samples were observed by SEM using a Hitachi S-3500 Scanning Electron Microscope. All pH measurements were carried out with an ISTEK- 720 P pH meter.
Adsorption experiments were performed at 25 ˚C in an open borosilicate glass reactor of 250 ml capacity whose temperature was regulated by thermostat.
The MG dye solution of 1000 mg L-1 was prepared as stock solution and subsequently whenever necessary diluted. The initial concentration of MG was 100 mg L−1. 0.2 g of MnFe2O4 was added in 30 mL of MG on rotary shaker at a constant speed of 300 rpm. Samples were withdrawn at appropriate time intervals and centrifuged at 1000 rpm for 5 min. Different parameters like; contact time and pH on the sorption capacity of MG have been studied. pH of the dye solutions were adjusted in the range of 2–12 with 0.1 M NaOH or HCl solutions. To determine the effects of dye concentration, the dye concentrations 50, 100 and 200 mg L-1 of MG were used. To determine the effect of adsorbent dosage, the adsorbent concentrations of 0.05-2 g were used. To evaluate the adsorption thermodynamic parameters, the effect of temperature on adsorption were carried out. To examine the effect of temperature, temperatures of 15-60 ˚C were used. After the equilibrium, suspensions were filtered off and analyzed for dye concentration.
UV-Vis spectrophotometer 160 A Shimadzu was used for determination of concentration of MG. The percent removal of MG by the hereby adsorbent is given by8:
% adsorption = [(C0-Ce)/C0] × 100 (1)
Where C0, Ce is denoted the initial and equilibrium concentration of MG mg L-1, respectively.
Results and Discussion
Characterization of nano ferrite manganese
The nanopowder of MnFe2O4 spinel was also characterized by IR spectroscopy. The FTIR spectra of MnFe2O4 nano particles are shown in Fig. 1. The spectrum of the in Fig. 1 shows that there are two strong absorption bands at 696 and 541 cm-1 which coincide with those reported for pinel in the literature18. The peak at 696 cm-1 is attributed to the stretching vibration mode of M–O for the tetrahedrally coordinated metal ions and the band at 541 cm-1 can be assigned to the octahedrally coordinated metal ions. The absorption broad band at 3400-3500 cm-1 represented the stretching mode of H2O molecules and OH groups. The absorption band at 1600 cm-1 on spectrum referred to the vibration of remainder H2O in the sample.
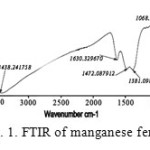 |
Figure 1: FTIR of manganese ferrite |
The XRD pattern of the MnFe2O4 powders is shown in Fig. 2. The pattern of the MnFe2O4 sample can be indexed to MnFe2O4 (JCPDS 74-2403). The average crystallite sizes of MFe2O4 nanoparticles were calculated from X-ray line broadening of the reflections of (2 2 0) and (3 1 1) using Scherrer’s equation (Dh k l= 0.9 λ / (βcos Өhkl), where λ is the wavelength of the X-ray radiation, Dh k l is the particle size perpendicular to the normal line of (h k l) plane, h k l is the full width at half maximum, Өh k l is the Bragg angle of (h k l) peak19. The average crystallite size of nano particles from bond width at 2Ѳ=35˚ is about 20-30 nm. The values of lattice constant are determined. The manganese ferrite has tetragonal structure and a=8.5900, b=8.51900, c=8.5400, a=β=γ=90.
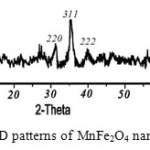 |
Figure 2: XRD patterns of MnFe2O4 nano particles |
Fig. 3 shows the SEM and TEM images of MnFe2O4 spinel nanoparticles with two different magnifications. According to SEM and TEM images, the morphology of nanoparticles is homogeneous and the spinel nanoparticles consist of uniform crystallites with an average size of 25 nm. This value is in agreement with the XRD results. In addition, energy dispersive X-ray (EDX) confirmed the expected Mn to Fe ratio as well as the phase purity of the nano powders.
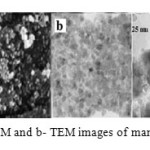 |
Figure 3: a- SEM and b- TEM images of manganese ferrite |
Study of adsorption of MG onto MnFe2O4 ferrite spinel
The effect of varying the parameters that affect the adsorption of MG from an aqueous solution was investigated to optimize the adsorption process. Fig. 4 shows the adsorption of MG by manganese ferrite in different contact times. The result indicates that a fast adsorption process of the dye occurred during the first few minutes and the adsorbed amount of the dye reached its equilibrium value very quickly. It was observed that the equilibrium time for MG by manganese ferrite spinel was about 30 min (Fig. 4).
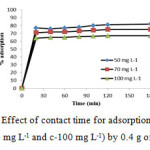 |
Figure 4: Effect of contact time for adsorption of MG (a-50 mg L-1, b-70 mg L-1 and c-100 mg L-1) by 0.4 g of manganese ferrite Click here to View figure |
pH is one of the most important factors affecting the adsorption process. The influence of pH on the removal of MG dye by nanospinel of manganese ferrite was studied. To determine the optimum pH, the pH value was changed from 2 to 11 with fixed initial concentration of dye (70 and 100 mg l−1) and contact time (30 min). Fig. 5 shows the percentage of removal rate of MG by manganese ferrite depends strongly on pH20. Increasing pH from 2 to 7 the adsorption efficiency decreased. Maximum MG adsorption performance was in pH 2.
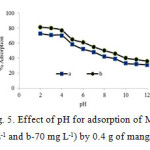 |
Figure 5: Effect of pH for adsorption of MG (a-100 mg L-1 and b-70 mg L-1) by 0.4 g of manganese ferrite Click here to View figure |
The effect of manganese ferrite dosage on the adsorption process was studied. It is clear that the percentage of MG removed from the aqueous solution increased from 33% to 94% when the manganese ferrite dose increased from 10 mg to 40 mg. The increase in the percentage of MG removed from the aqueous solution is primarily due to the greater number of active sites available for adsorption as a result of the increased amount of manganese ferrite present.
The effect of agitation rate on MG adsorption is shown in was investigated (50-500 rpm). As the stirring rate increased from 50 to 300 rpm, the adsorption capacity increased. The decrease in adsorption capacity at a higher shaking rate is probably due to the fact that more particles are broken at 350 rpm, thereby enhancing the desorption process. Another explanation is that the suspension is not homogeneous at 350 rpm20. An agitation speed of 300 rpm was selected for the other tests.
Adsorption Kinetics
Adsorption kinetics which provides the information about adsorption path and adsorption mechanism could evaluate adsorption performance of the adsorbent. Several models are available to investigate the adsorption kinetics.
In the present study, pseudo-first-order22 and pseudo-second-order23 kinetic models were used to fit the experimental data. The pseudo-first-order kinetic model was described by Lagergren and the pseudo-second-order kinetic model based on the assumption that the rate-limiting step of the adsorption process was chemical sorption. The pseudo-first-order and pseudo-second order kinetic models might be represented by Eqs. (2) and (3):
log (qe – qt) = log qe – k1 t (2)
Where qe and qt are the amounts of dye adsorbed per unite mass of the adsorbent (mg g-1) at equilibrium and time t, respectively and k1 is the rate constant of adsorption (min-1). When log (qe – qt) was plotted against time, a straight line should be obtained with a slope of k1, if the first order kinetics is valid.
The pseudo-second order model has the following form:
t/ qt = t/qe + 1/(k2qe2) (3)
Where qe and qt represent the amount of dye adsorbed (mg g-1) at equilibrium and at any time. k2 in the rate constant of the pseudo-second order equation (g mg-1 min-1). A plot of t/q versus time (t) would yield a line with a slope of 1/ qe and an intercept of 1/ (k2qe2), if the second order model is a suitable expression. The plot between log(qe–qt) versus time t shows the pseudo first order model and the plot of t/q versus time t shows the pseudo second order model respectively. The kinetic model with a higher correlation coefficient R2 was selected as the most suitable one (Table 1). The results show that adsorption kinetics of MG fitted well by pseudo-second-order kinetic model. The values of rate constant k are given in Table 1. The values of k increase with the rise in temperature, which shows endothermic nature of the adsorption process. The activation energy Ea for adsorption was found by using the Arrhenius equation:
ln k = -Ea / RT + C (4)
Table 1: Kinetic parameters for adsorption of MG by manganese ferrite
|
Temperature (°C) |
Ea(kJ mol-1) |
First order |
Second order |
||
|
R2 |
K1 (min-1) |
R2 |
K2 (g mg-1) min-1) |
||
|
25 |
0.85 |
0.523 |
0.965 |
0.536 |
|
|
35 |
7.473 |
0.785 |
0.582 |
0.995 |
0.486 |
|
45 |
0.91 |
0.662 |
0.992 |
0.650 |
|
|
55 |
0.84 |
0.725 |
0.982 |
0.680 |
|
Conclusion
Manganese ferrite nanoparticles were obtained by chemical precipitation method under pH 9. The nanoparticles were characterized by FTIR, XRD, TEM and SEM.
The XRD and TEM reveal that the nanoparticles prepared by chemical precipitation method have uniform spinel structure. The nano manganese ferrite spinels exhibit regular morphology with homogeneous particle size distribution. The FTIR spectroscopy confirmed the structure of metal oxide spinel structure. In the present study, we demonstrated the nano manganese ferrite spinels can act as novel adsorbent materials for degradation of MG azo dye. A second order model describes the adsorption kinetic data. In summary, the nano manganese ferrite spinels are promising candidates for the adsorption of azo dyes from wastewaters.
Acknowledgements
This work was financially supported by Islamic Azad University of Yazd brunch. We gratefully acknowledge financial support from the Research Council of Islamic Azad University of Yazd.
References
- Hankare, p.p.; Jadhav, S. D.; Sankpal, U. B.; Patil, R. P.; Sasikala, R.; Mulla, I. S.; Alloys Comp., 2009, 488, 270-272.
- Raj, K.; Moskowitz, R.; Casciari, R..; J. Mag. Mag.Mat., 1995, 149(1-2), 174-180.
- Carta, D.; Casula, M. F.; Floris, P.; Falqui, A.; Mountjoy, G.; Boni, Z. A.; Sangregorio, Y.C.; Corrias, A.; Phys. Chem. Chem. Phys., 2010, 12, 5074–5083.
- Phumying, S.; Labuayai, S.; Swatsitang, E.; Amornkitbamrung, V.; Maensir, S.; Mat. Res. Bull. 2013, 48, 2060–2065.
- Rongcheng, W.; Jiuhum, Qu.; Hong, H.; Yunbo, Y.; J. Appli. Cat. B: Enviro, 2004, 48, 46-56.
- I. Khosravi, M. Yazdanbakhsh, E. K Goharshadi, A. Youssefi, Mat. Chem. Phys. 2011, 130, 1156– 1161.
- Boni, A.; Marinone, M. Innocenti, C.; Sangregorio, C.; Corti, M.; Lascialfari, A.; Mariani, M. ; Orsini, F.; Poletti, G.; Casula, M. F.; J. Phys. D: Appl. Phys., 2008, 41, 134021-134028.
- Hashemian, S.; Salimi, M.; Chem. Eng. J. 2010, 188, 57-63.
- Hashemian, S.; Foroghi moqhadam, A. ; Chem. Eng. J. 2014, 235, 299–306.
- Hashemian, S.; Monshizadeh, M.; Main Group Chem., 2013, 12, 113–124.
- Crini, G.; Biore. Technol. 2006, 97, 1061–1085.
- Sartape, A. S.; Mandhare, A. M.; Jadhav, V. V.; Raut, P. D.; Anuse, M. A.; Kolekar, S. S.; Arab. J.Chem., 2013, In press.
- Hema, M.; Arivoli, S.; J. Appl. Sci. Environ. Manage. March, 2008, 12(1), 43 – 51.
- Shirmardi, M.; Mahvi, A. H.; Hashemzadeh, B.; Naeimabadi,A.; Hassani, G.; Vosoughi Niri, M.; Korean J. Chem. Eng. 2013, 30(8), 1603-1608.
- Garg, V. K.; Kumar, R.; Gupta, R.; Dyes and Pigments, 2004, 62(1), 1–10.
- Kushwaha, A. K. Gupta, N.; Chattopadhyaya, M. C.; J. Saudi Chem. Soc., 2014, 18( 3), 200–207.
- Hidarian, M.; Hashemian, M.; Orien. J. Chem. 2014, 30 (4), 1753-1762.
- Wu,R.; Qu,J.; Chen,Y.; Water Res. 2005, 39(4), 630–638.
- Hashemian, S. African J. Biotechnol. 2010, 9 (50), 8667-8671.
- Hashemian, S.; Dehghanpor, A.; Moghahed,A.; J. Ind. Eng. Chem. 2015, 24 308–314.
- Souza, S.; Pina, P. S.; Leao, V. A.; Silva, C. A.; Siqueira, P. F.; Hydro. A. 2007, 89, 72–81.
- Lagergren, S. Handlingar, 1898, 24, 1–39.
- Ho, Y. S.; McKay, G.; Wase, D. A. J.; Foster, C. F.; Ads. Sci. Technol. 2000, 18, 639–650.

This work is licensed under a Creative Commons Attribution 4.0 International License.
![]()
A New Edition of Web of Science
Journal Impact Factor
2022: 0.5
Five Year: 0.8
Journal is Indexed in

Cabells Whitelist
![]()


