Polyester-Bentonite Clay Composite: Synthesis, Characterization and Application as Anticorrosive Agent
Subramanian Chitra, Sounthari Palanisamy, Kiruthika Ayyasamy*, Parameswari Kandasamy
Department of Chemistry, PSGR Krishnammal College for women, Coimbatore-641 004, Tamil Nadu, India. Correspondence Author Email: kiruthikadreams@gmail.com
DOI : http://dx.doi.org/10.13005/ojc/310364
Article Received on :
Article Accepted on :
Article Published : 20 Aug 2015
New polyester-bentonite clay composite was prepared and characterized by FTIR, TGA, SEM& XRD. The XRD and SEM studies are quite supportive of well dispersed polymer clay composite formation. The thermal stability of the polymer was significantly improved as indicated by TGA. The composite was evaluated for its inhibition performance for mild steel corrosion in 1M H2SO4 by weight loss, polarization and electrochemical impedance techniques. The studies reveal that the clay composite was an excellent adsorption type inhibitor and obeys Langmuir adsorption isotherm. Electrochemical studies showed that the polymer composite was a mixed inhibitor retarding both anodic metal dissolution and cathodic hydrogen evolution.
KEYWORDS:polymer; clay composite; Corrosion inhibition; EIS; isotherm; SEM
Download this article as:| Copy the following to cite this article: Chitra S, Palanisamy S, Ayyasamy K, Kandasamy P. Polyester-Bentonite Clay Composite: Synthesis, Characterization and Application as Anticorrosive Agent. Orient J Chem 2015;31(3). |
| Copy the following to cite this URL: Chitra S, Palanisamy S, Ayyasamy K, Kandasamy P. Polyester-Bentonite Clay Composite: Synthesis, Characterization and Application as Anticorrosive Agent. Orient J Chem 2015;31(3). Available from: http://www.orientjchem.org/?p=10283 |
Introduction
Polymer clay composites which consists of clay particles dispersed in a polymer matrix have been prepared for different applications [1-2]. Clay fillers are widely used in polymers to produce cost effective, strong and energy efficient materials.
Bentonite are clays rich in smectites – group of clay minerals able to expand and contract their structure while maintaining the two dimensional crystallographic integrity. Bentonite clay has montmorrilonite (MMT) as its main component. Along with MMT, it contains other clays and chemicals like illite, kaolinite, quartz and carbonates. These clays are biocompatible green materials, simple processing combined with low cost make it a prospective for nano architectural polymeric composites.
The swelling clays belonging to 2 : 1 layered clays are commonly used for the preparation of polymer layered silicate nanocomposites. Montmorillonite, hectorite and saponite are the most commonly used layered silicates in filled-polymer nanocomposites [3]. The clay used in this work is sodium bentonite because of its natural abundance and low cost.
Bentonites are defined as a sedimentary rock consisting of a large portion of expandable clay minerals with three-layer structures (smectites) such as montmorillonites (80%), beidellite, nontroniteetc with minor amounts of non-clay minerals such as quartz, calcite, dolomite and feldspar [4].
Jastrzebska etal have investigated the properties of polyester composites by modified bentonite [5]. Sarkar etal have found that incorporation of 5 mass percentage of bentonite clay into the polypropylene matrix offered significant improvement in tensile strength and toughness [6]. It has been reported that poly 2-chloro aniline – Na bentonite nano composites showed greater electrical conductivity than the neat polymer[7]. Polymer bentonite composites have been synthesized and used for controlled release of nutrients to plants [8]. Though the capacity of polymer – clay composites is found to be remarkable in various fields, the role of polymer composites in corrosion inhibition studies is less undertaken.
The aim of this work is to develop a polymer clay nano composite by solution blending and to study its performance towards the inhibition of mild steel corrosion in 1M H2SO4 medium. The synthesized polymer and the polymer clay nano composite were characterized by FTIR, XRD, SEM and thermal studies. Corrosion monitoring techniquesviz, mass loss measurements, potentiodynamic polarization, electrochemical impedance spectroscopy were employed to assess the inhibition efficiency.
Experimental Work
Materials and Methods
Bentonite clay (BT) was procured from Merck and used as such. 4,4’-Diamino biphenyl ether, Adipic acid, thionyl chloride, Sodium hydroxide, cetyltrimethyl ammonium bromide (CTAB), dimethylsulphoxide (DMSO) were purchased from Merck and used without any purification.
Synthesis of Polymer:
The polymer was synthesized by the polycondensation of diacid (Adipic acid) and diol monomer(EBAPSB)by the reported procedure [9]. (Scheme-1)
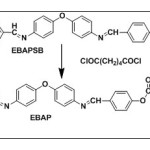 |
Scheme 1 Click here to View scheme |
EBAPSB (Monomer)
1H NMR (400 MHz, DMSO-d6) δ: 5.5 (s, 2H, OH); 9.9 (s, J = 1 Hz, 2H; -CH=N-), 6.9 & 7.8 (d, 8H; Ar H); IR: ν (OH) = 3299cm-1 (s), ν (-CH=N-) =1608cm-1 (s)
EBAP
1H NMR (400 MHz, DMSO-d6) δ: 7.7 (d, 4H, Ar-Ha), 7.4 (d, 4H, Ar-Hd), 7.1 (d, 4H, Ar-Hc), 6.9 (d, 4H, Ar-Hb,), 8.3-8.5 (s, 2H, -CH=N), 2.2 (t, 8H, CH2) (Fig.2); IR: 1680cm-1 (s) ν (-C=O); 1600cm-1 (s) ν (-CH=N-); 1186 cm-1ν (-C-O-C-)
Polymer- Bentonite Composite:
Preparation of composite is carried out in two steps
Preparation of Modified Bentonite Clay Sample
Inorder to produce organophilic clay, bentonite was modified with micellar adsorption of quaternary ammonium surfactant, cetyltrimethylammonium bromide (CTAB). Similar experiments were carried out by Yalcinkaya etal [10]
1 g of bentonite was suspended in 100 ml of distilled water at room temperature.
CTAB was dissolved in hot water (1 wt. %), slowly poured into the bentonite suspension and stirred for 24 h at ambient temperature. the quaternary ammonium surfactant interacts with bentonite by exchanging its sodium ions with quaternary ion.The modified bentonite (mass of 0.5g) was filtered off, dried under vacuum and milled.
Preparation of Composite [EBAP-BT]:
The polyester-organoclay composite was prepared by solution intercalation method[11]. The organo clay 25% by weight of polymer was first suspended in DMSO. Then, the polymer, dissolved in the solvent, was added to the solution and sonicated (in a probe sonicator with amplitude of 30% for 10 minutes with a pulse range of 1 sec) whereby it gets intercalated between the swollen clay layers. The last step consists in removing the solvent by evaporation under vacuum.
Characterization
The synthesized polymer and the composite were characterized by IR, 1H NMR, SEM, TGA and XRD. IR spectra of the samples were recorded in the range 4000 to 400 cm-1 on ATR-IR Affinity1 spectrometer. The 1H NMR spectra of the samples were carried out in Bruker Avance III model instrument 400MHz in DMSO-d6. The surface morphology of the EBAP and EBAP-BT samples was investigated using the Medzer biomedical research microscope. X-ray diffraction studies were carried out for the polymer and the composite using XRD 6000 (Shimadzu, Japan) instrument. The measurement conditions were CuKα radiation with graphite monochromatorwith 30 KV voltages and 40 mA current. The thermograms were recorded in dynamic nitrogen atmosphere (flow rate 20 mL/min) with a heating rate of 10 K/min using a Perkin Elmer (TGS-2 model) thermal analyzer.
Corrosion Monitoring Techniques
Specimen Preparation
Mild steel (Composition-carbon-0.084%, Mn-0.369%, P-0.025%, Cr-0.022%, Ni-0.013% and Fe-remainder) was made into rectangular specimens of size 3cm X 1 cm X 0.1 cm. The specimens were cleaned in pickling solution of HCl washed with water and dried. The specimens were then polished using emery sheets, degreased with trichloroethylene, dried and stored in a desiccator.
For electrochemical studies, the same mild steel as rod embedded with Teflon coating was fabricated with an exposed area of 0.785cm2.
Gravimetric Measurements
Varying concentrations of the inhibitor solutions were prepared in 1M Sulphuric acid (100 ml) and kept in a thermostat maintained at desired temperature. The pre-weighed mild steel plates were immersed in the inhibitor solution at 30±1ºC for 3 hours and for 1 hour at higher temperatures. The plates were then, dried and reweighed. From the loss in mass, the percentage IE of the inhibitors was calculated.
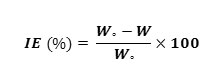
Where,
Wº and W are the weight loss in the absence and presence of the inhibitor respectively.
Electrochemical Measurements
Polarization and EIS experiments were carried out using Ivium compact stat Potentiostat. A three electrode type corrosion monitor with mild steel rod as working electrode was used for the measurements. The potential was varied from -100 to +100mV at a rate of 2mV/s. Corrosion kinetic parameters such as Ecorr, Tafel slopes and Icorr were evaluated from Tafel plot. The IE was calculated using the following equation,
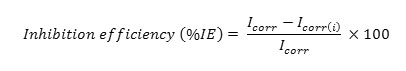
Where,
Icorr&Icorr(i) are the corrosion current density of the uninhibited and inhibited solutions.
EIS experiments were carried out in the frequency range of 10 KHz to 0.01Hz with amplitude of 10mV peak-to-peak using AC signal at the OCP. The difference between total resistance (Rt) and solution resistance (Rs) values gives the charge transfer resistance (Rct) value. The inhibition efficiency and Cdl values were calculated using the following formula,
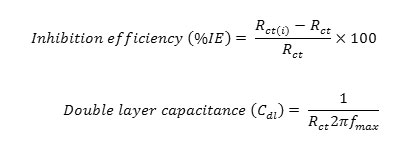
Where Rct and Rct(i) are the charge transfer resistance for uninhibited and inhibited solutions and fmax is frequency at the imaginary component of the impedance.
SEM and EDAX Analysis
The polished mild steel specimens were immersed in the acid solution (1 M H2SO4) and in the acid containing 500 ppm of the polymer and composite for 3 h and then the specimens were taken out, dried and observed under Scanning Electron Microscope(Medzer biomedical research microscope).
Results and Discussion
FTIR Spectra
Fig.1 shows the FTIR spectra of polymer, bentonite clay and the composite. The band due to –OH stretching frequency is absent in the spectra of polymer EBAP indicating that it is involved in the poly esterification. In the spectra of polymer, peaks are observed at 1690 cm-1 and 1628 cm-1 due to –C=O stretching and –CH=N stretching respectively.Pure bentonite clay shows characteristic bands at 1040 cm-1 for Si-O-Si linkage and 660 cm‑1 for Al-O stretching. Also a broad band around 3600 cm-1 is observed due to –OH stretching[12-14].
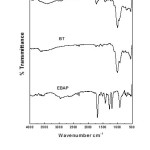 |
Figure 1: FTIR spectra of the samples. Click here to View figure |
The IR spectrum of composite shows characteristic bands of both the polyester and clay which ensures the incorporation of clay in the polymer. The peak at 1650 cm-1 due to C=O stretching of polymer is reduced in intensity which shows that there is interaction with clay through C=O group. The composite also shows bands around 1040 cm-1 and 580 cm-1 characteristic of Si-O and Al-O linkages for bentonite [15].The FT-IR technique therefore confirms the incorporation of clay particles in the polymer matrix[16]. Benchabane Adel et al.[17]Jörn Dau et al.[18] have also reported similar results for their synthesized clay composites.
XRD Data
Fig.3 shows the powder XRD patterns of bentonite clay polymer and the composite. In the scattering curve of the bentonite a prominent broad peak occur at 2Ө=25ᴼ. The polymer shows sharp peaks at 2Ө values 20ᴼ, 28ᴼ, 32ᴼ, 38ᴼ, 68ᴼ and 83ᴼ which indicate its crystalline nature.Blanton etal [19] have reported that it is possible to determine the degree of intercalation or exfoliation by monitoring the position (2Ө), shape and intensity of the characteristic peak for clay in polymer composite. When there is a shift of 2Ө or disappearance of a peak, it shows that there is an efficient dispersion of clay and the polymer.In the XRD curve of the composite, the broad peak characteristic of clay has disappeared and the peaks characteristic of the polymer has diminished in intensity. The peaks at higher 2Ө have disappeared and the peak at 2Ө = 28ᴼ is sharpened. This indicates that the polymer chains are well dispersed between clay layers [20].
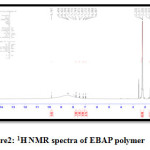 |
Figure 2: 1H NMR spectra of EBAP polymer Click here to View figure |
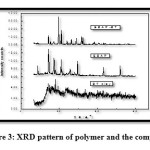 |
Figure 3: XRD pattern of polymer and the composite Click here to View figure |
Thermo Gravimetric Analysis (TGA)
TGA has been used to evaluate the thermal stability of polymer and the composite. Generally, inorganic species have good thermal stability.Introduction of inorganic components into organic materials improve the thermal stability of the resulting composite[21]. The thermograms of the polymer and the composite are shown in Fig.4.
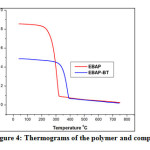 |
Figure 4: Thermograms of the polymer and composite Click here to View figure |
From the TGA curves, it is evident that the polymer undergoes decomposition at 262ºC, the composite shows quite good stability upto 350ºC. The thermal stability of polymer-clay composite is enhanced due to the attractive coulomb interaction between the positive group of polymer layer and negatively charged surface of the clay layer[22].This increased thermal stability of the composite may influence the inhibition of acid corrosion of mild steel at higher temperatures.
SEM
The SEM micrographs of the polymer, clay and the composite are shown in Fig.5. Polyester was found to be semicrystalline in nature. The organo modified clay was flaky and homogeneous as shown in Fig.5 (b). The polyester composite exhibits different ordered surface characteristics and is crystalline in nature. The photographs confirmed that polyester crystals are incorporated into the silicate layers of the clay. The presence of clay increases the compactness of the polymer clay composite albeit more dense. These results were supported by x-ray diffraction studies. Corrosion monitoring techniques:
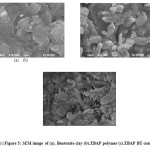 |
Figure 5: SEM image of (a). Bentonite clay (b).EBAP polymer (c).EBAP BT composite Click here to View figure |
Weight loss Method
The inhibition of mild steel corrosion in 1M sulphuric acid by the synthesized inhibitors was studied at room temperature by weight loss measurements. Results obtained from weight loss measurements are shown in Table 1.Increasing the concentration of the compounds increases the percentage inhibition efficiency which reached its optimum value at 500ppm. The inhibitory effect of the polymer and composite can be attributed to the adsorption of the compounds on the steel surface which limits the dissolution of the steel by blocking the corrosion sites and hence decreasing the corrosion rate. The adsorption occurs by the interaction of lone pairs of electrons on nitrogen and oxygen atoms with iron atoms on the mild steel surface. This is facilitated by the presence of vacant d orbitals of the Fe2+ ion. It has been reported that formation of donor-acceptor surface complexes may also be responsible for the inhibition process. [23].
Table 1: Inhibition efficiencies of various concentrations of the inhibitors for corrosion of mild steel in 1M H2SO4 obtained by weight loss measurement at various temperatures
|
Inhibitor
|
Concentration (ppm) | Inhibition Efficiency (%) | |||
| 303 K | 313 K | 323 K | 333 K | ||
| EBAP | 100 | 18.00 | 14.82 | 6.26 | 2.53 |
| 300 | 30.20 | 26.94 | 22.37 | 9.59 | |
| 500 | 79.61 | 77.43 | 67.71 | 46.38 | |
| EBAP-BT | 100 | 64.98 | 72.15 | 77.06 | 82.37 |
| 300 | 79.36 | 81.73 | 82.69 | 86.33 | |
| 500 | 84.19 | 86.28 | 88.04 | 90.71 | |
Effect of Temperature
It is observed (Table-1) that the polymer EBAP showed decrease in inhibition efficiency with increase in temperature whereas EBAP-BT exhibits corrosion inhibiting property at all studied temperatures and the values of %IE increases with increase in temperature. With increase of temperature the equilibrium shifts to a higher adsorption rate until the attainment of new equilibrium. This explains the increased inhibition efficiency at higher temperature which may be due the initiation of chemical adsorption of EBAP-BT.Chemisorption can take place on the steel surface by the interaction between the π electrons and lone pair of electrons on the heteroatoms such as O, N, Si, Al, etc present in the clay and the vacant low energy d orbitals of the Fe surface atoms.
Thermodynamic Parameters
Figure 6 shows the Arrhenius plot for the synthesized inhibitors in 1M sulphuric acid solution. The activation energy calculated from the slope of Arrhenius plots is recorded in Table 2.
Table 2: Activation energies of the polymer and composite
| Inhibitor | Ea (J) |
| Blank | 58.63 |
| EBAP | 59.19 |
| EBAP-BT 100 ppm | 21.26 |
| EBAP-BT 300 ppm | 17.94 |
| EBAP-BT 500 ppm | 22.41 |
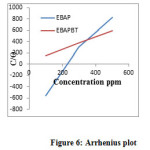 |
Figure 6: Arrhenius plot Click here to View figure |
The Ea value is greater than 20 J mol−1 in both the presence and absence of the inhibitor, which reveals that the entire process is controlled by the surface reaction[24]. The presence of polyester and bentonite clay composite decrease the Ea value at all concentrations studied.
According to Nwabanne[25] unchanged or lowered value of Ea in inhibited system compared to the blank is indicative of chemisorption possibly because some of the energy is used up in the chemical reaction. Ea tends to decrease in the presence of an inhibitor by decreasing the available reaction area (geometric blocking effect), thereby decreasing the corrosion rate.
Table 3: Thermodynamic and Kinetic parameters of polyester and the composite
|
Inhibitor |
ΔHads kJ/mol |
ΔSºads kJ/mol |
-ΔGºads kJ/mol |
|||
|
303 K |
313 K |
323 K |
333 K |
|||
|
EBAP |
1759.97 |
4.36 |
13.09 |
13.72 |
14.75 |
18.34 |
|
EBAP-BT |
-260.064 |
3.06 |
42.50 |
53.81 |
55.00 |
61.60 |
The standard free energy of adsorption ΔGads was calculated using the equation,
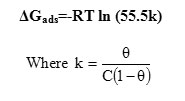
Other thermodynamic parameters such asΔS and ΔH were obtained from transition state plot ie. log(Corrosion rate/T)vs 1/T. The values are presented in Table 3.The negative values of ΔS in the absence and presence of the inhibitors implies that the formation of activated complex is the rate determining step and represents association rather than dissociation. It also reveals that a decrease in disorder takes place in going from reactants to the activated complex. The negative values of ΔH show that the adsorption of the inhibitor is an exothermic process. Generally an exothermic process signifies either physisorption or chemisorption while endothermic process is attributable to chemisorption only.
Adsorption Isotherm
The adsorption of an organic adsorbate at the metal/solution interface can be presented as a substitution adsorption process between the organic molecules in aqueous solution (Orgaq) and the water molecules on the metallic surface (H2Oads)
![]()
Attempts were made to fit the experimentally determined surface coverage values to various isotherms such as Frumkin, Langmuir, Temkin, Freundlich, Bockris-Swinkels, and Flory−Huggins isotherms[26].
Plots of C/θ against C yield straight lines as shown in Fig.7. Both linear correlation coefficient (R2> 0.99) and slope are very close to 1, indicating the adsorption of polymer and the composite on steel surface obeys the Langmuir adsorption isotherm. This isotherm assumes that the adsorbed molecules occupy only one site and there are no interactions with other adsorbed species.
AC impedance Spectra
Nyquist plot for mild steel exposed to 1 M H2SO4 with different concentrations of the inhibitors are shown in Fig. 8. The equivalent circuit model used to fit experimental results is shown as
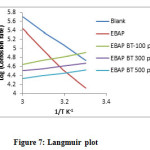 |
Figure 7: Langmuir plot Click here to View figure |
Where Rs represents the solution and corrosion product film, Rt the parallel combination of resistor, polarization resistance and C (Capacitor) ie. double layer capacitance.
The values of the impedance parameters derived from the Nyquist plots using the selected equivalent circuit model Rs (CdlRct) are given in Table. Nyquist diagram shows a single depressed, capacitive semicircle with its center in the real axis regardless of the inhibitor concentration, indicating that the corrosion process is under charge transfer control from the metal to the electrolyte through the electrochemical double layer.
According to the Helmholtz model [27], the capacitance of a double layer is inversely proportional to the thickness of the protective layer and, thus the decrease in the Cdl value indicates that the protective layer becomes thicker with increasing inhibitor concentration; this makes the corrosion inhibition more effective. The behavior of the electrode is not affected by the presence of the inhibitor, indicating that reaction is activation controlled; the diameter of the semicircle pertaining to mild steel impedance significantly increases with the inhibitor concentration, reaching a maximum value with 500 ppm of inhibitor.
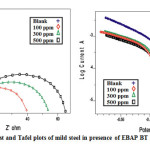 |
Figure 8 & 9: Nyquist and Tafel plots of mild steel in presence of EBAP BT in 1M H2SO4 Click here to View figure |
Table 4: AC impedance data of mild steel in presence of polymer composites at various concentrations in 1M H2SO4
| Inhibitor | Conc (ppm) | Rt(ohm cm2) | Cdl(µF/ cm2) | IE( %) |
| Blank |
– |
11.3 |
0.336 |
– |
| EBAP |
100 |
20.1 |
0.276 |
43.78 |
|
300 |
26.1 |
0.222 |
56.70 |
|
|
500 |
28.3 |
0.199 |
60.07 |
|
| EBAP-BT |
100 |
34.1 |
0.367 |
66.9 |
|
300 |
51.7 |
0.3220 |
78.1 |
|
|
500 |
64.9 |
0.3200 |
82.6 |
The semicircle diameter is related to the charge transfer resistance, the lowest corrosion rate is attained with 500 ppm. The increase in Rct values is attributed to the formation of a protective film at themetal/solution interface[28].
Potentiodynamic Polarization Method
The electrochemical parameters such as corrosion current density (Icorr), corrosion potential (E), cathodic and anodic Tafel slopes (bcand bc) and inhibition efficiency obtained from polarization measurements are listed in Table 5. It is evident that, the presence of increasing amounts of inhibitors decreases the corrosion current. Ecorr value is also shifted in the presence of the inhibitors. Parallel cathodic Tafel plots obtained in Fig. 9 indicate that the hydrogen evolution is activation-controlled and the reduction mechanism is not affected by the presence of inhibitor. The values of ba and bcare both changed but significant change in bc is observed with the addition of clay composite.The formation of a surface inhibitor film on the mild steel surface reduces the active surface area available for the attack of the corrosive medium, delays both the hydrogen evolution and iron dissolution reactions, and provides considerable protection against corrosion to mild steel [29]. Therefore, these inhibitors are of mixed-type with marked cathodic behaviour.
SEM with EDAX Analysis
The SEM micrograph (Fig.10 b) depicts that the presence of adsorbed layer of the inhibitor on mild steel surface resulting in enhanced surface coverage preventing the direct contact between metal and the aggressive medium.
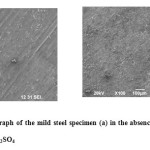 |
Figure 10: SEM micrograph of the mild steel specimen (a) in the absence & (b) in the presence of EBAP polymer in 1M H2SO4 Click here to View figure |
Table 5: Potentiodynamic polarization data of mild steel in presence of polymer and composite at various concentrations in 1M H2SO4
|
|
Inhibitor Concentration (ppm) |
Tafel slopes (mv / dec) |
-Ecorr (mV) |
Icorr (µAmp/cm2) |
IE (%) |
|
|
ba |
bc |
|||||
|
Blank |
52 |
112 |
467.40 |
568 |
– |
|
|
EBAP |
100 |
59 |
118 |
458.0 |
430.7 |
17.60 |
|
300 |
63 |
132 |
441.3 |
509.1 |
22.30 |
|
|
500 |
53 |
168 |
395 |
474.8 |
30.45 |
|
|
EBAP-BT |
100 |
68 |
146 |
462.6 |
490 |
13.73 |
|
300 |
61 |
160 |
431.6 |
330 |
41.90 |
|
|
500 |
59 |
146 |
404 |
280 |
50.70 |
|
EDAX (Fig.11) spectra of the mild steel plate immersed in 1M H2SO4 containing EBAP/EBAP BT show the presence of Al, Si, O in addition to N confirming the formation of a protective film of the composite.
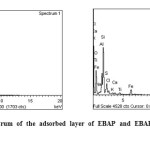 |
Figure 11: EDAX spectrum of the adsorbed layer of EBAP and EBAPBT on the mild steel specimen. Click here to View figure |
Evaluation of the Inhibitors
Analysis of the results obtained by all the three methods showed the composite EBAP-BT exhibit higher inhibition efficiency than the polymer EBAP at all the concentrations used. The presence of clay might have enhanced the strength, compactness and adhesivity of the composite. The compactness of the composite was also evident from the SEM studies.
Chang etal [30] found that the introduction of MMT into organic coatings increases the length of diffusion pathways for oxygen and water as well as decreasing permeability of the coating , which leads to a significant enhancement in corrosion protection on metallic surface.
The higher inhibition efficiency of the polyester – bentonite clay composite obtained in the present study can therefore be interpreted as also due to the barrier effect of clay platelets dispersed in the composite.
Conclusion
- Bentonite clay has been successfully utilized to produce a potential composite useful as good corrosion inhibitor for mild steel.
- The composite can be easily prepared and is eco-friendly.
- The composite inhibit the corrosion of mild steel in 1M H2SO4 by adsorption mechanism and the adsorption obeys Langmuir isotherm.
- The composite behaves as mixed type inhibitor.
Acknowledgement:
The authors are thankful to the University Grants commission (UGC) for financial support and STIC, Kochin for their technical assistance.
References
- Koyama,T.;Tanoue,S.;, Iemoto,Y.;Maekawa,T.;Unryu,T.;Polymer composites,2009301065-1073.
- Kleining,T.; Churchman,G.T.;Chittleborough,D.J.; Saunders,B.R.;Plastics, rubber and composites,200332224-229.
- Park,S.J.;Seo,D.I.; and Lee,J.R.;J. Colloid & Interface Sci,2002251 160-165
- MadhuchhandaSarkar.;Kausik Dana.;SankarGhatak and Amarnath Banerjee.;Bull. Mater. Sci.,200831(1) 23–28.
- Mariola Jastrzebska,; Helena Janik,;Dominik Paukszta,;Polimery,201459(9)656-661.
- Madhu Chhanda Sarkar.; Kausik Dana.; SankarGhatak.; Amarnath Banerjee.;Bull. Mater sci, 200831(1)23-28.
- PorselviLinganathan.; Jhancy Mary Samuel.;Int .J Scientific and technology research,20143(2)69-75.
- LU Qi-Ming.; FENG Xin.; SUN Ke–Jun.; LIAO Zong-wen.;Journal of plant nutrition and fertilizer,200511(2)183-186.
- Benjamin Joy Vasanthi.; Lingam Ravikumar.;European Polymer Journal, 2007434325-4331.
- Erdem Yalcinkaya,S.;Nuray Yildiz.; Mehmet Sacak.;AylaCalimli.;Turk J Chem,2010 34581-592.
- AhmetGurses.;Mehtap Ejder-Korucucetin Dogar.;The scientific world journal,2012, 1-8.
- Porselvi Linganathan.; Jhancy Mary Samuel.;Int .J Scientific and technology research, 20143(2) 69-75.
- OrhanKarabulut.; TahirTilki.; Mustafa Yavuz.; Abdullah Kaplan.; DuyguTakanoğlu.; Mehmet Cabuk.;SedaDogan.;SDU Journal of Science (E-Journal), 20127(2)112-122.
- Kung-Chin Chang.; Shih-Ting Chen.;Hui-Fen Lin.; Chang-Yu Lin.;Hsin-Hua Huang.;Jui-Ming Yeh.; Yuan-Hsiang Yu.;European Polymer Journal,20084413-23
- Subham Banerjee.;SushmaVerma.;Dilipkumar Pal.;Ashoke Kumar Ghosh.; Shiv Sankar Bhattacharya.;Pronobesh Chattopadhyay.;AnimeshGhosh and SantanuKaity.;J PolymEng, 201131567-575.
- ZukaManiania,B.;MbunguTsumbu,J.P.; and MulabaBafubiandi,A.F.;International Conference on Chemical and Environmental Engineering (ICCEE’2013),2013 Johannesburg (South Africa)
- Adel Benchabane.; Karim Bekkour.;“39ème Colloqueannuel du GroupeFrançais de Rhéologie, Mulhouse : France 2004
- Jorn Dau and Gerhard Lagaly.;CCACAA71, 19984 983-1004
- Blanton,T.N.; Majumdar,D.; Melpolder,S.M.;JCPDS-international center for diffraction data, Advances in x-ray analysis,200042562-568.
- Abdolmajid Alipour.;International Journal of Bioscience, Biochemistry and Bioinformatics,20122(2)79-84.
- LenutaStroea.; Emil C. Buruiana.;Revue Roumaine De Chimie, 200954(5)389–397
- Sridhar Pande.;Swaruparani,H.; Mahesh D. Bedre.;RavishankarBhat.; RaghunadanDeshpande.;Venkataraman,A.;Nanoscience and Nanotechnology, 20122(4) 90-98.
- Zhang,D.Q.;Qi,Q.R.;He,X.M.;Cao,L.X.;Kim,G.S.;Materials chemistry and physics, 2009114 612-617
- Ali Yousefi.;Soheila Javadian and Jaber Neshati.;Ind. Eng. Chem. Res. 201453(13)5475−5489
- Nwabanne,J.T.;Okafor, V.N.; and Chima,L.O.;Journal of Engineering and Applied Sciences,20083(11) 92-100
- Zhihua Tao.;Shengtao Zhang.;Weihua Li and Baorong Hou.;Ind. Eng. Chem. Res.492593–2599
- Bentiss,F.;Jama,C.;Mernari,B.; El Attari,H.; El Kadi,L.;Lebrini,M.;Traisnel,M.;Lagrenée,M.;Corros. Sci. 2009511628- 1635
- Sumit Kumar.;Dipti Sharma.;Premanand Yadav and Mahendra Yadav.;Ind. Eng. Chem. Res. 20135214019−14029.
- Sam John and Abraham Joseph.;Ind. Eng. Chem. Res. 201251 16633−16642
- Chang,K.C.; Jang,G.W.;Peng,C.W.; Lin,C.Y.;Shieh,J.C.;Yeh,J.M.; Yang,J.C.;Li, W.T.; Electrochim Acta,2007 525191-5200

This work is licensed under a Creative Commons Attribution 4.0 International License.
![]()
A New Edition of Web of Science
Journal Impact Factor
2022: 0.5
Five Year: 0.8
Journal is Indexed in

Cabells Whitelist
![]()


