Phase Diagrams of W/O Microemulsion Stabilised By Non-ionic Surfactants ToBe Used As Templates ForMicroemulsion Polymerisation
C. R. Laili*, and Hamdan S.
School of Fundamental Science, Universiti Malaysia Terengganu, 21030, K.Terengganu, Terengganu, Malaysia
Correspondence author E-mail: laili@umt.edu.my
DOI : http://dx.doi.org/10.13005/ojc/310338
Article Received on :
Article Accepted on :
Article Published : 24 Jul 2015
A surfactant association behaviour, in order to locatea region of water-in-oil (W/O) microemulsion, stabilised by non-ionic surfactants was carried out. The use of pseudoternary phase diagrams to locate the microemulsion region will be described and the compositions of the template will be suggested. The results showed that the W/O microemulsion were located mostly at the surfactant mixtures apex and protruding towards the water-oil axis. The size of the aggregates were also found to be increasing with the increment of water. This suggested that along the line at increasing water various sizes of aggregates are formed and thus maybe selected as templates for the preparation nanomaterials with the desired particle size.
KEYWORDS:Microemulsion; Phase diagrams; Non-ionic surfactant
Download this article as:| Copy the following to cite this article: Laili C. R, Hamdan S . Phase Diagrams of W/O Microemulsion Stabilised By Non-ionic Surfactants ToBe Used As Templates ForMicroemulsion Polymerisation . Orient J Chem 2015;31(3). |
| Copy the following to cite this URL: Laili C. R, Hamdan S . Phase Diagrams of W/O Microemulsion Stabilised By Non-ionic Surfactants ToBe Used As Templates ForMicroemulsion Polymerisation . Orient J Chem 2015;31(3).. Orient J Chem 2015;31(3). Available from: http://www.orientjchem.org/?p=9985 |
Introduction
Microemulsions are colloidal dispersions of eitherwater-in-oil and oil-in-water stabilised by amphiphiles (surfactants). They are transparent, homogenous, and isotropic dispersions. Microemulsions have merits over other vehicles or solvents due to their improved stability, solubilisation characteristics and ease in preparation. They require only a minimal input of energy for their formation compared to size-reduced kinetically stabilised emulsions. The early report in the late 1940’s by Schulman and a series of collaborators have captured the attention of the scientific researchers1-3. Since then numerous attempts have been made to investigate various aspects of microemulsions from the treatment of microemulsions as colloidal systems4,5 to more theoretical contributions6. With time, contributions have also been directed towards industrial application, due to its unique properties, including encapsulation and controlled drug delivery, preparation of bactericidal and vaccine formulations7as well as for the preparation of cosmetics and pharmaceutical products8,9.
They can be used to carry out chemical reactions and, in particular, to synthesise nanomaterials. By controllingthe parameters of the synthesis, these microemulsionscan be used as template to producetailor-made products down to a nanoscale level withnew and special properties10-11. One such example is microemulsion polymerisation. Due to their small and uniform droplet size, they can form nanomaterialsvia polymerisation processes12. In addition, if biocompatible oils and surfactants are used for the formation of the microemulsion, the need to separate the nanomaterials from the reaction medium following polymerisation when emulsion systems are used may bee liminated13. Candau et al.14 reported that microemulsion regions were found in a hydrophilic-lipophilic balance, HLB domain ranging from 8 to 11 using non-ionic surfactants such as Arlacel 83 and G1096. Recently, it has been reported that a mixture of non-ionic surfactants with a lower HLB value of about 7.1 produce a stable W/O microemulsion region 15. The nonionic surfactants used were Tween 80 and Span 80. Similar HLB values (7-8) with cosurfactant were favourable in order to produce a balanced microemulsion using sorbitan monolaurate (Crill 1) and polyoxyethylene (20) monooleate (Crillet 4 Super)16.
With that note, in this work, the phase behaviour of stable W/O microemulsion regions formed by non-ionic surfactants was investigated. Non-ionic surfactant is an attractive choice due to its mild effect and low cost as compared to other types of surfactants. The W/O microemulsion region was chosen due to its vast potential in the pharmaceutical industry and because it’s potential has not been getting the attention it deserves compared to the O/W systems. We were particularly interested in its potential to incorporate biological molecules such as insulin into the aqueous phase. It is also well known that non-ionic surfactants with the right combination of water and oil produce microemulsion regions without the need of using co-surfactant in some cases which would probably be beneficial to minimise protein denaturation in such systems.
Experimental
The non-ionic surfactants, polyoxyetehylene (20) sorbitan monooleate (Tween 80) (95%) (HLB 15.0); Sorbitan monolaurate (Span 20)(>95%) (HLB 8.5) were purchased from Sigma-Aldrich. 1-butanol, methyl acetate, ethyl oleate and insulin were purchased from Sigma-Aldrich. All components were used as received without further purification. The water used throughout the study was double distilled.
Construction of phase diagrams
The phase diagrams were determined on a clear/turbid criteria basis by mixing two of the components and titrating with the smallest amount of the third component. The samples were then thoroughly mixed to homogeneity with a vortex mixer, centrifuged and then allowed to reach equilibrium at a specific temperature in a water bath. The phases were then examined by visual inspection between cross polarisers. An estimated region of the phases can then be made by this method by noting the turbid and clear compositions.
Dynamic light scattering measurements
A dispersion of 2 ml of selected microemulsion samples were prepared and kept in the water bath at 25oC overnight to equilibrate. A Zetasizer Nano Series (Malvern Instruments, Worcestershire, UK) set at 25oC were used to measure the droplet size. The measurement were made in triplicate.
Result and Discussion
Phase Diagrams
In order to understand the association behaviour of microemulsions, a preliminary investigation of the phase behaviour employing solvent/non-ionic surfactants with different types of oil as the third component was carried out. The solvents were water and insulin solution. The following results and discussion of the phase diagrams were reported in all of the three solvents.
Water/Nonionic Surfactant systems
The two nonionic surfactants with similar HLB values as Crill 1 and Crillet 4 super were employed. The nonionic surfactants were Tween 80 and Span 20. Crill and Crillet are suitable for topical preparation, while Tween and Span are usually used for preparation of food products. Tween 80 (HLB = 15) and Span 20 (HLB = 8.5) were chosen since they have been previously described in the literature17-18. They are readily available and their colloidal structures have been characterized by many groups19-22. Figure 1 shows the location of the one phase isotropic region for water/Span20/Tween 80. It was observed that both of the Tween 80 and Span 20 were completely miscible in each other. The isotropic solution region was found to be extending fully from the water-free axis towards the water apex. A maximum water solubility of 24 weight percent of water was observed at Tween 80/Span 20 weight ratio of 60/40. This observation is in agreement with the previously reported result20.
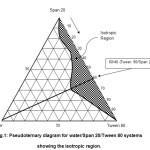 |
Figure1: Pseudoternary diagram for water/Span 20/Tween 80 systems showing the isotropic region. Click here to View figure |
Water/Span 20:Tween 80/1-Butanol systems
The ratio (i.e. 60/40 of Tween 80/Span20) was then used as the mixed nonionic surfactant apex and titrated with a third component containing 1-butanol as shown in Figure 2. The figure showed a similar pattern of the isotropic region to that of the water/Tween 80/Span 20 system (Figure 1) but, with a slightly reduced amount of the maximum water solubility of 20 weight percent. The maximum water solubility occurs at 1-but anol/Tween 80:Span 20 (60:40) weight ratio of 30/70. This suggested that a higher amount of mixed surfactant was required to achieve the maximum water solubility and to form the colloidal structures.
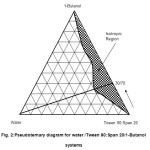 |
Figure2: Pseudoternary diagram for water /Tween 80:Span 20/1-Butanol systems Click here to View figure |
Water/Span 20:Tween 80/1-Butanol/Oil system
For the formation of W/O microemulsion, methyl acetate and ethyl oleate were then added separately as the oil component in systems containing water and Tween 80/Span20 (60/40):1-butanol (70:30) as shown in Figure 3. The system with methyl acetate (solid line, Figure 3) showed a total miscibility of the mixed surfactant and 1-butanol component in both of water and methyl acetate. The microemulsion region was seen to be projecting in an inwards manner from the mixed surfactant/1-butanol-free axis starting from both water and methyl acetate apices.
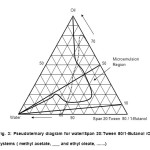 |
Figure3: Pseudoternary diagram for water/Span 20:Tween 80/1-Butanol /Oil systems ( methyl acetate, ___ and ethyl oleate, …….) Click here to View figure |
The microemulsion region for ethyl oleate (dotted line, Figure 3) however showed a different behaviour. The region seemed to cover almost two thirds of the mixed surfactant/1-butanol apex and projecting upwards from the ethyl oleate-free axis with a maximum ethyl oleate solubility of 80 percent by weight. The figure also showed a partial miscibility of the mixed surfactant/1-butanol component in both water (60 %) and ethyl oleate (70 %).
Insulin/Span 20:Tween 80/1-Butanol/Ethyl Oleate system
The dotted line of Figure 4 showed a microemulsion region when water was replaced with insulin solution. The region was observed to shrink towards the solvent-free axis with a maximum insulin solution solubility of about 20 % by weight. It occurred at an ethyl oleate/(Tween 80:Span/1-butanol) weight ratio of 50/50. It was also observed that the solubility region at the ethyl oleate-free axis did not occur in this system. This suggests that the presence of ethyl oleate is vital for the formation of microemulsion when insulin is present.
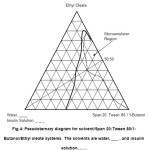 |
Figure4: Pseudoternary diagram for solvent/Span 20:Tween 80/1-Butanol/Ethyl oleate systems. The solvents are water, ___ , and insulin solution, …… |
Dynamic light scattering measurements
In order to elucidate the different types of colloidal structures present in the prepared microemulsion, DLS measurements were carried out to determine the particle size and distribution. For the light scattering measurements of these mixed non-ionic surfactant microemulsion systems, two lines at a constant weight ratio of surfactant/oil of 50/50 and 90/10 were taken. The line at the 50/50 weight ratio shows limited solubility in water of less than 20 percent, while the other line at the 90/10 shows complete miscibility in water (see Figure 3). The droplet size of each of the composition is obtained from the particle size distribution described as intensity percent from the DLS measurements. To illustrate this, Figure 5 showed the droplet size distribution described as intensity percent for sample at 50:50 (mixed surfactant/1-Butanol:Methyl Acetate) for H2O/Tween 80:Span 20/1-Butanol/Methyl Acetate containing at 5 weight percent of water. Similar exercises were used for the other compositions and their droplet size with the variation of water content is shown in Figure 6.
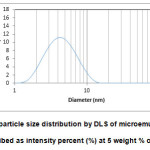 |
Figure5: The particle size distribution by DLS of microemulsion droplet described as intensity percent (%) at 5 weight % of water. Click here to View figure |
The solid line of Figure 6 shows the variation of the droplet size with the weight percentage of water for the methyl acetate system at the weight ratio of 50/50. The sizes of the droplets showed an upward trend from 4.5 to 7.5 nm with the increment of water content. These values are in agreement with the previously reported result i.e. from 3.9 to 13.1 nm for systems containing mixtures of Tween 80 with soya bean oil17. For the 90/10 weight ratio (dotted line, Figure 6), showed a similar increasing trend but a marked increase in the values of the droplet size of more than 100 nm.
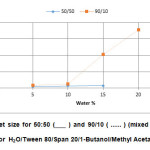 |
Figure6: Droplet size for 50:50 (___ ) and 90/10 ( …… ) (mixed surfactant/1-But:MeAc) for H2O/Tween 80/Span 20/1-Butanol/Methyl Acetate systems. Click here to View figure |
It is also worth mentioning of the sudden increase in the value of the particle size occurring at 10 percent for both systems. The sudden increase in the value of the particle size at 10 percent of water is satisfying since similar observations were made by previous workers23-24. They suggested that at that concentration of water, the first inverse micelles are formed or the increase in size shows a change in association behaviour to form a bicontinuous system. This is further substantiated by Krauel et al.21and Hickey et al.18. whom reported that at water percentage between 5 to 10 percent, W/O microemulsion was formed. However, as the water content was further increased the W/O microemulsion changes to that of bicontinuous type.
Overall, it may be summarised that the solubility area of the microemulsion regions have been located in the systems studied. The region with the presence of insulin however, has some detrimental effect on the solubility area of the microemulsion region. This is expected due the large size of the insulin structure. Therefore, ethyl oleate is needed if insulin is to form a microemulsion in this system. In addition, the droplet sizes of the microemulsion region at increased rapidly at more than 10 percent water by weight showing a possible presence of inverse micelle or the formation of W/O microemulsion of bicontinous type.
References
- Hoar, T.P.; Schulman, J.H. Nature (London) 1943, 152, 102-103.
- Schulman, J.H.; Riley, D.P. J Colloid Interface Sci.1948, 3, 383-405.
- Schulman, J.H.; Friend, J.A. J Colloid Interface Sci.1949, 4, 497-509.
- Adamson, A.W.J Colloid Interface Sci.1969, 29, 261-267.
- Ahmad, S.I.; Shinoda, K.; Friberg, S.E.J Colloid Interface Sci., 1974,47, 32-37.
- Reiss, H. J. Colloid Interface Sci.1975, 53, 61-70.
- Boman,N.L.;Tron, V.A.; Bally, M.B.; Cullis, P.R. Cancer Chemoter Pharmacol1996,37, 351-355
- Bangham, A. D. BioEssays1995,17, 1081-1088.
- Talsania, S.K.; Yongmei, W.; Rajagopalan, R.; Mohanty, K.K. J Colloid Interface Sci.1997, 190, 92-103.
- Eastoe, J.; Warne B. Curr Opin Colloid Interface Sci.1996,1, 800-805.
- Lopez-Quintela, M.A. Curr. Opin. Coll. Int. Sci. 2003,8, 137-144
- Watnasirichaikul, S.; Davies, N.M.; Rades, T.; Tucker, I.G. Pharm. Res.2000, 17, 684-689.
- Vauthier, C.; Dubernet, C.; Fattal, E.; Pinto-Alphandary, H.; Couvreur, P. Adv. Drug Deliv. Rev.2003,55, 519-548.
- Candau, F.; Pabon, M.; Anquetil, J.Y. Colloids and Surfaces1999, 153, 47-59
- Wan, T.; Zang, T.S.; Wang, Y.C.; Zhang, R.; Sun, X.C. Polym. Bull., 2010, 65, 565-576.
- Alany R.G.; Rades, T.; Agatonovic-Kustrin, S.; Davies N.M.;Tucker I.G. Int J Pharm., 2000, 196(2), 141-145.
- Constantinides, P.P.; Scalart, J.P. Intern. J. Pharm.1997,158, 57-68.
- Hickey, S.; Hagan, S.A.; Kudryashov, E.; Buckin, V. Intern. J. Pharm2010, 388, 213-222.
- Aizawa, H.J. Appl. Cryst.,2009, 42: 592-596.
- Alany, R.G.; Tucker, I.G.; Davies, N.M.; Rades,T. Drug Development and Industrial Pharmacy2001,27(1), 31-38
- Krauel, K.; Davies, N.N.; Hook, S.; Rades, T. J Controlled Release2005,106,76-87.
- Shukla, A.; Kiselev, M.A.; Hoell, A.;Neubert, R.H.H.; Indian Acad. Sci.2004, 63(2), 291-295
- Shah, D.O.; Hamlin, R.M. Science, 1971, 171, 483-485
- Friberg, S.E.; Buraczewska, J. Progr Colloid Polym Sci.,1978,63, 1-9.

This work is licensed under a Creative Commons Attribution 4.0 International License.


