Frying Stability Evaluation of Rice Bran Oil Blended with Soybean, Mustard and Palm Olein Oils
Prachi Srivastava* and R. P. Singh
Department of Oil & Paint Technology Harcourt Butler Technological Institute, Kanpur, India. Correspondence Autour: E. mail: prachi4n@gmail.com
DOI : http://dx.doi.org/10.13005/ojc/310348
Article Received on :
Article Accepted on :
Article Published : 23 Jul 2015
Refined rice bran oil (RBO) was blended with PUFA rich Soybean oil (SBO), MUFA rich Mustard oil (MO) and SFA rich Palm Olein oil (POO) to make a blend that had sufficient amount of Omega-3 fatty acid by mixing two or more oils in the ratio of 60:40 and 60:20:20 respectively. RBO and its blends were subjected to deep fat frying of potato chips at 180±10C for 24h. Oil samples were withdrawn after every four hours of frying and evaluated for peroxide value (PV), p-Anisidine value (p-AV), Total polar component (TPC) and oil stability index (OSI) for the RBO and its blends. In general, frying stability of RBO was improved by the blending, the Omega-6/Omega-3 ratio of the blend of RPM and RSM was in the recommended range (1:5-10), and in both cases it was observed to be 1:6. The OSI of RBO deteriorates 66% and it improved by blending with POO and it decline only 53% and 54% for the blend RP and RPM respectively. It was concluded that the blend having more than two oils (RBO+PO+MO) was better in oxidative stability, nutritional value and also contain sufficient amount of Omega-3 fatty acid than that of the RBO and its other blends.
KEYWORDS:Blending; frying stability; mustard oil; palm olein oil; rice bran oil; soybean oil
Download this article as:| Copy the following to cite this article: Srivastava P, Singh R. P. Frying Stability Evaluation of Rice Bran Oil Blended with Soybean, Mustard and Palm Olein Oils. Orient J Chem 2015;31(3). |
| Copy the following to cite this URL: Srivastava P, Singh R. P. Frying Stability Evaluation of Rice Bran Oil Blended with Soybean, Mustard and Palm Olein Oils. Orient J Chem 2015;31(3). Available from: http://www.orientjchem.org/?p=9937 |
Introduction
Frying is the fastest and oldest cooking method of food. In deep fat frying, the food is totally immersed in hot (160-190 0C temperature) oil. Blended oils are gaining popularity worldwide due to advantages they offer such as improved thermal stability, oxidative stability, nutritional benefits and their ability to monitor the desired properties. At times, they may be cheaper alternative/substitutes to pure vegetable oils with improved characteristics (1, 2). Fatty Acid composition plays a major role in relation to oxidative stability (3).With this back ground knowledge about oxidation, in the present work rice bran oil (RBO) is taken as it is expected to improve the oxidative stability of the blends because it contain natural antioxidats and also possesses hypocholesterolemic properties which are beneficial in preventing cardiovascular diseases (4). Recently, Palm olein oil is the most used oil for frying, because of its high saturated fatty acid (SFA) content and excellent oxidative stability of oil. However, negative health effect of this oil is that its dominating saturated fat increases the serum level of total cholesterol and low density lipoprotein (LDL), therefore increasing the risk of cardiovascular disease (5). Soybean oil (SBO) has a good nutritional profile because of its high proportion of unsaturated fatty acid, but the oil has poor oxidative stability and is prone to flavour reversion (6). Mustard oil (MO) is suitable for all type of cooking including frying, but should be used along with other cooking oils to reduce the erucic acid content because dietary erucic acid present should be around 5% of total fatty acid composition. It does not affect heart cholesterol and triglyceride concentration and there is no development of heart lesion(7).
The objective of this work is to present a novel approach of inhibiting rancidity, increasing frying stability and solving the drawback of deficiency of ω-3 fatty acid in RBO by blending with two or more edible oils.
Materials and Methods
The refined, bleached, and deodorized Rice Bran Oil (RBO) was procured from M/S Sethi Oil (P) Ltd, Sitapur. Refined Mustard Oil (MO) of Dhara brand of M/S Mother Dairy fruit and vegetable (P) Ltd and Raag Gold refined Palm olein oil (POO) of fortune brand of M/S Adani Wilmar was procured from local market. Refined Soybean oil (SBO) was arrange from M/S Kanpur Edible (P) Ltd. The other chemicals and reagents used for the analysis were of analytical reagent grade and were obtained from Nath chemicals corporation, Kanpur (India).
Preparation of Blends
The minimum level of incorporation of oil is 20% in an oil blend as per the rules of Prevention of Food Adulteration Act (PFA) applicable in India. The five blends of RBO were prepared in the volume/volume ratio: 60% RBO + 40% SBO (RS), 60% RBO + 40% MO (RM), 60% RBO + 40% POO (RP), 60% RBO + 20% SBO + 20% MO (RSM), 60% RBO + 20% POO + 20% MO (RPM). These blends were analyzed for fatty acid composition and oxidative stability.
Frying procedure and oil sampling
Potatoes were peeled and cut into pieces (7.0 X 0.5 X 0.3 cm) and submerged into water until needed. Potato pieces were fried in the frying oils. The oil (2L) was placed in a 5L capacity double door deep-fryer (Anvil deep fryer, India) and heated to 180±10C. Potato chips were fried in 20±0.5-g batches at constant temperature. The batches were fried at 12-min intervals for 8h per day for total period of 3 days. At the end of every four hour, about 20 g of the frying oil was filtered into a colored glass vial, flushed with nitrogen, and stored at -20 0C until analyzed. Each day, after 8h of frying, the fryer was shut down and left to sit overnight. The volume of oil did not replenish during the frying process. Frying experiments were conducted in duplicate on each frying medium (8).
Fatty Acid Composition by Gas Chromatography
Fatty acid methyl esters (FAME) of the oil samples were prepared by transesterification, according to AOCS Method No: Ce 1-62, (9). FAMEs were analyzed on a NUCON 5765 series gas chromatograph (NUCON Industries, New Delhi), equipped with a hydrogen flame ionization detector (FID) and a fused silica capillary column (100 m 9 0.25 mm i.d.), coated with 0.20 μm SP2560 (Supelco Inc., Bellefonte, PA) as the stationary phase. A reference standard FAME mixture (Supelco Inc.) was analyzed under the same operating conditions to determine the peak identity. The FAMEs were expressed as relative area percentage.
Determination of gamma-Oryzanol Content
gamma-Oryzanol content in RBO and its blends was determined by a spectrophotometric method (10) by dissolving 0.01 g of the sample in 10 ml of hexane and reading the absorbance at 315 nm in a 1-cm cell (double beam UV–visible recording spectrophotometer, make GBC Cintra 6 ). The oryzanol content was calculated by using the formula
gamma – Oryzanol content = [(A/W) X (100/358.9)]
Where, A is the absorbance of the sample, W is the weight of the sample in gram/100 ml, 358.9 is extinction coefficient for oryzanol.
Total Tocopherol (TT) content
The TT content was determined according to the colorimetric method described in (11).
Peroxide Value
AOCS official method Cd 8-53 (1997) was used to determine Peroxide Value (PV) (12).
p – Anisidine Value (p-AV)
Secondary oxidation products were estimated by the p-Anisidine Value, as detailed in AOCS method No: Cd 18-90 (12). This measurement is based on the absorbance increase per g of oil, measured at 350 nm (GBC Cintra 6, UV Spectrophotometer), for individual oil and their blended oil solution in iso –octane, before and after reaction with p-anisidine reagent in the dark.
Total Polar Compound (TPC) content
The TPC content was determined according to the economical micro method developed by Schulte (13).
Oxidative Stability Index (OSI)
Oxidative stability was measured using a 743 Metrohm Rancimat (Herisau, Switzerland) at 120 0C following the AOCS Official Method Cd 12b-92 (12).
Statistical Analysis
All determination was carried out in triplicate, and the results were processed using Microsoft Excel. The triplicate results of extracts from three samples of each oil were pooled together and were expressed as the mean value with standard deviation.
Results and Discussion
Fatty acid composition of RBO and its blends
The fatty acid composition and chemical characteristics of the RBO, SBO, MO and POO are depicted in Table-1. It can be observed that the oils distinguished from each other mainly due to the significant differences in the percentage of palmitic (C16:0), oleic (C18:0), linoleic (C18:2), and linolenic (C18:3) acids. The percentage of saturated fatty acid (SFA) of POO was significantly higher than that of RBO, SBO and MO i.e. 40.5%, 20.8%, 14.3% and 9.5% respectively. The percentage of mono-unsaturated fatty acid (MUFA) was highest in MO (64.48%) and the MUFA percentage of POO, RBO and SBO was 47.9%, 44.5% and 24.2% respectively. The SBO had the highest percentage of poly-unsaturated fatty acid (PUFA), followed by the RBO, MO and POO. From above, it is clear that the PUFA/SFA ratio (also known as polyene index) was the highest for the SBO followed by the MO, RBO and POO. The PUFA/SFA ratio was usually taken as a measure of the extent of polyunsaturation of oil and used as an indicator for its tendency to undergo autoxidation (14).
Table1: Fatty acid composition (%) of Rice bran oil, soybean oil, mustard oil and palm olein oil
| Fatty Acid | RBO | SBO | MO | POO |
| Palmitic acid (C16) | 18.83 ± 0.3 | 10.53 ± 0.9 | 3.43 ± 0.0 | 36.63 ± 0.9 |
| Stearic acid (C18) | 1.99 ± 0.1 | 3.81 ± 0.1 | 1.01 ± 0.6 | 3.9 ± 0.5 |
| Oleic acid (C18:1) | 44.28 ± 0.0 | 24.19 ± 0.4 | 20.48 ± 0.1 | 47.93 ± 1.2 |
| Linoleic acid (C18:2) | 33.08 ± 0.8 | 55.03 ± 0.6 | 6.8 ± 0.1 | 11.54 ± 0.3 |
| Linolenic acid (C18:3) | 1.52 ± 0.2 | 6.44 ± 0.3 | 15.2 ± 0.4 | ND |
| Arachidic acid (C20) | ND | ND | 5.08 ± 0.2 | ND |
| Erucic acid (C22:1) | ND | ND | 48 ± 1.2 | ND |
| SFA | 20.82 ± 0.4 | 14.34 ± 1.0 | 9.52 ± 0.8 | 40.53 ± 1.4 |
| MUFA | 44.58 ± 0.0 | 24.19 ± 0.4 | 68.48 ± 1.3 | 47.93 ± 1.2 |
| PUFA | 34.6 ± 1.0 | 61.47 ± 0.9 | 11.54 ± 0.5 | 11.54 ± 0.3 |
| PUFA/SFA | 1.7 | 4.3 | 2.3 | 0.3 |
ND not detected, Mean ± SD (standard deviation)(n=3)
The RBO blended with SBO, MO and POO in different ratios to make the blend of these oils are depicted in Table-2. As discussed above the POO had higher percentage of SFA than the MO, so the RP and RPM blend had higher percentage of SFA than blend RM, RSM RS, it was approximately 28.7%, 22.5%, 18.2%, 17.3% and 16.3% respectively. The MUFA percentage of blend RM was higher than that for the blend RSM and RPM due to the presence of higher percentage of MO, which contained more MUFA (erucic acid), content i.e. 54.1%, 45.3% and 50.0% respectively. The PUFA percentage of blend RS was higher than blend RSM due to higher percentage of SBO in previous and blend RP, RPM and RM showed almost same percentage of PUFA, it was 45.4%, 37.5%, 25.3%, 27.5% and 29.6% respectively.
Table2: Fatty acid composition (%) of the blends for rice bran oil
| Fatty acid | RS | RM | RP | RSM | RPM |
| Palmitic acid (C16) | 15.54 ± 0.3 | 12.62 ±0.5 | 25.90 ± 0.7 | 14.11 ± 0.4 | 19.26 ± 0.6 |
| Stearic acid (C18) | 2.68 ± 0.4 | 1.65 ± 0.2 | 2.80 ± 0.9 | 2.15 ± 0.1 | 2.21 ± 0.5 |
| Oleic acid (C18:1) | 36.39 ± 1.2 | 34.91 ± 0.6 | 45.96 ± 1.2 | 35.66 ± 0.6 | 40.46 ±1.2 |
| Linoleic acid (C18:2) | 41.89 ± 1.2 | 22.59 ± 0.6 | 24.42 ± 0.6 | 32.19 ± 1.0 | 23.54 ± 0.4 |
| Linolenic acid (C18:3) | 3.49 ± 0.0 | 6.97 ± .04 | 0.91 ± 0.2 | 5.26 ± 0.2 | 3.92 ± 0.3 |
| Arachidic acid (C20) | ND | 2.03 ± 0.1 | ND | 1.00 ± 0.1 | 1.04 ± 0.3 |
| Erucic acid (C22:1) | ND | 19.22 ± 0.8 | ND | 9.62 ± 0.3 | 9.57 ± 0.5 |
| SFA | 18.23 ± 0.7 | 16.3 ± 0.8 | 28.7 ± 1.6 | 17.26 ± 0.6 | 22.51 ± 1.4 |
| MUFA | 36.39 ± 1.2 | 54.13 ± 1.4 | 45.96 ± 1.2 | 45.28 ± 0.9 | 50.03 ± 1.7 |
| PUFA | 45.38 ± 1.2 | 29.56 ± 1.0 | 25.33 ± 0.8 | 37.45 ± 1.2 | 27.46 ± 0.7 |
| PUFA/SFA | 2.5 | 1.8 | 0.9 | 2.17 | 0.8 |
ND not detected Mean ± SD (standard deviation)
The erucic acid percentage of blend RSM and RPM was 9.6% and blend RM was 19.2. Food-grade rapeseed oil in the US (15) and EU (16) is regulated to a maximum of 2% and 5% erucic acid respectively. Therefore, 10% erucic acid will be intolerable. The SFA: MUFA: PUFA (SMP) ratio of blend RS was 18:36.5:45.5, blend RM was 16:54:30, blend RSM was 17:45:38, blend RP was 29:46:25 and for blend RPM was 22.5:50:27.5 respectively. On the basis of WHO recommendation (below 33%: above 33%: about 33%) the results reveal that SMP ratio of blend RP and RPM was near to the recommended level. However, the blends RM, RS and RSM were showing derailment from the recommended levels. The w-6/w-3 ratio of blend RS (12:1), RM (3:1) and RP (27:1) did not lie in the recommended range of 5-10:1 (WHO).Only the blend RSM (6:1) and RPM (6:1) followed the WHO recommendation of w-6/w-3 (linoleic acid/linolenic acid) ratio.
Natural antioxidant
Tocopherols and γ- Oryzanol (Figure-1) are natural antioxidants (17) and they are commonly mentioned as “total natural antioxidant” in this study. Tocopherols prevent lipid peroxidation by acting as captures of lipid peroxyl radicals, inhibiting these radicals from reacting with the lateral chains of adjacent fatty acids. The OH group of the α-tocopherol donates its hydrogen atom to the peroxyl radical (LOO-), forming several resonance stabilized α-tocopheryl free radicals and a hydroperoxide, thus interrupting the chain reaction of the lipid peroxidation (18). γ- Oryzanol is a mixture of sterol esters of ferulic acid and triterpene alcohols. As shown in Figure-1, antioxidant activity of γ- Oryzanol has been attributed due to ferulates can similarly be explained by the formation of several resonance stabilized free radicals (19).
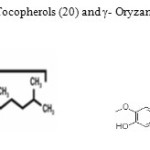 |
Figure1: Chemical Structure of Tocopherols (20) and γ- Oryzanol (21) Click here to View figure |
As shown in Table-3 the total tocopherol content of the SBO (1010 ppm) was significantly higher than that of the RBO (726 ppm), which was in turn significantly higher than those of MO (607 ppm) and POO (324 ppm).
Table3: Total natural antioxidant of rice bran oil and its blend
| OIL | Oryzanol(ppm) | Total tocopherol(ppm) | Total natural antioxidant(ppm) |
| RBO | 2798±2.1 | 726±52.3 | 3525.3±10.2 |
| SBO | ND | 1010±40.2 | 1010±40.2 |
| MO | ND | 607±11.5 | 607±11.5 |
| POO | ND | 324±22.7 | 324±22.7 |
| RS | 1678±1.1 | 844±15.2 | 2526.45±7.3 |
| RM | 1679±1.3 | 680±12.4 | 2364.2±5.4 |
| RP | 1680±1.4 | 580±14.3 | 22762.7±4.8 |
| RSM | 1681±1.2 | 756±14.9 | 2435.33±6.1 |
| RPM | 1681±1.3 | 623.5±10.8 | 2308.9±4.6 |
ND not detected, Mean ± SD (standard deviation) (n=3)
RBO had the highest content of total natural antioxidant i.e. 3525 ppm due to presence of abundant amount of unique antioxidant oryzanol (2798 ppm). Blend RP had lowest amount of total natural antioxidant i.e. 2276 ppm followed by RPM i.e. 2308 ppm due to presence of POO, contain lower amount of total tocopherol. On the other hand, blend RS had highest amount of total natural antioxidant i.e. 2526 ppm followed by RSM i.e. 2435 ppm. Reason behind the above analysis is that the SBO are rich source of natural tocopherol. Blend RM had moderate amount of total natural antioxidant i.e. 2364 ppm.
Effect of frying stability on peroxide value
Peroxide value gives important information about lipid autoxidation, its use was limited to the earlier stage of oxidation and so their products were called primary oxidation products (22). The fresh RBO and its blends had almost same peroxide value. During the frying process, the PV increased at different rates with frying time.
Figure-2 illustrates the PV of RBO and its blends. Significant difference was found in peroxide value of rice bran oil and its blends after three days frying. Blend RP and RPM showed least percent increase in the peroxide formation during 24 h frying i.e. 9.51% and 9% respectively. It could be due to presence of high amount of SFA and MUFA in this blend. The low peroxide formation in the blend RM, individual oil RBO and blend RSM were found to be almost same i.e. 11.64%, 11.58% and 11.84% respectively. The low peroxide formation in blend RM and RSM was due to presence of high amount of MUFA as shown in Table-2 and in case of RBO the peroxide formation was suppressed due to presence of high amount of natural antioxidant Hidalgo et al.(23)observed that oil stability depended on the fatty acid composition and presence of different miner component. Blend RS showed highest percent increase in peroxide formation i.e. 14.08% due to presence of abundant amount of PUFA which have more sites of active methylene group for peroxide formation. Muhizi (24) also observed that peroxide value of frying oil increased with number of frying.
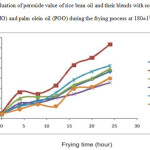 |
Figure2: Evaluation of peroxide value of rice bran oil and their blends with soybean oil (SBO), mustard oil (MO) and palm olein oil (POO) during the frying process at 180±10C Click here to View figure |
Effect of frying stability on p-Anisidine value
The p-Anisidine value (p-AV) is a reliable indicator of oxidative rancidity in fats and oils (25). It measured the secondary oxidation product (aldehyde and ketone etc) produced during oxidative degradation of oils during frying (26). As shown in Table-5 the p-AV of individual oil and its blends were sharply increased after reaching a definite point.
The change in p-AV of RBO and their blends were examined in this study during frying process at 180±10C was shown in Table-4. The increase in p-AV during frying process of blend RS, RM and RSM were steeply increased and they followed almost same trend because PUFA/SFA ratio of these blends were higher. The p-AV of blend RS was 1.06 and it gained 44.71 units to a value of 45.77 units, blend RM was increased by 41.98 units from its initial value 1.03 and it became 43.01 units and blend RSM was gained 43.08 units from its initial value 1.04 and it became 44.12 units. Chue et al. (27)reported that high amount of linoleic acid can cause a change in p-AV during frying process.
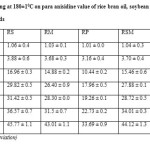 |
Table4: Effect of frying at 180±10C on para anisidine value of rice bran oil, soybean oil, mustard oil, palm olein oil and their blends Click here to View table |
Table-4 showed that RBO was moderately increased in p-AV and it gained 39.01 units from its initial value 1.01 and it became 40.02 units. Blend RP and RPM showed least increase in p-AV during frying it could be due to low PUFA/SFA ratio of these blends. The increase in p-AV of blend RP was 32.68 units from the value 1.01 and it became 33.69 units, whereas in blend RPM the increase in p-AV was 36.89 units from the value 1.01 and it became 37.9 units.
Effect of frying on Total Polar Component
The Total Polar Component (TPC) is a good indicator of quality of oil and it represents the sum of materials that are not triglyceride in oil and fat. More than 24-27% TPC is not accepted in frying oil and it should be discarded (28).
The changes in the TPC content of the individual oil RBO and its blends examined in this study during the frying process at 180±10C are illustrated in Figure-3. The initial TPC of blend RS was high i.e. 5.13 than the RBO and its other blends. Suppose that the limit of acceptance of the TPC content is 24% and the time required to reach this limit was supposed as a measured of frying stability.
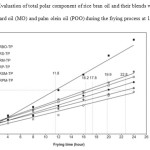 |
Figure3: Evaluation of total polar component of rice bran oil and their blends with soybean oil (SBO), mustard oil (MO) and palm olein oil (POO) during the frying process at 180±10C Click here to View figure |
As depicted in Figure-3 the blend RS showed a frying stability notably lower (11.8 h) than RBO and its other blends (16.2-22.8) the reason is that the PUFA/SFA ratio of blend RS was very high. The frying stability according to increase in TPC for the blend RM and RSM was higher than that for the RBO i.e. 16.2, 17.8 and 19.9 h respectively, the reason behind this is that RBO had abundant amount of natural antioxidant as shown in Table-3 and its PUFA/SFA ratio is also better than its other blends. It was interesting to find that the blend RP and RPM significantly improved in the frying stability and blend RPM was not discarded after 24 h frying because PUFA/SFA ratio of the blends were considerably better than RBO and other blends. Handel and Gurrieri (29) examined that the rate of increase in TPC correlated to the degree of unsaturation.
Effect of frying on Oxidative Stability Index
OSI is equivalent to induction point (IP) and measured by rancimat, it is a quick method to analyze oxidative stability of oil. By rancimat analysis, it is possible to compare the degree of deterioration of individual oil and its blends during the frying study. All the analysis was performed at 1200C by 743 Rancimat (Matroham, swissmade).
The fresh RBO and its blend with PO and MO had OSI (7.18 h and 7.63 h respectively) markedly greater than those of the other blends (5.7-6.63 h). As shown in Figure-4 during the frying process, the OSI, for the RBO blended with single oil in same contribution to the MO, SBO and PO decreased to 75%, 88% and 53% respectively after 24 h of frying. This indicates that the blending of RBO with POO positively enhances the OSI, whereas MO and SBO had negative effect on the OSI, the reason is that the SMP ratio of blend RP was found closer to WHO recommendation (below 33%: above 33%: about 33%) i.e. 29:46:25. The blend RSM and RPM showed a decrease of 64% and 54% respectively. It was notable that the blend RP and RPM showed almost same trend of decrease in OSI, the reason was that their SMP ratio was close to each other.
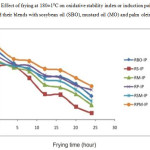 |
Figure4: Effect of frying at 180±10C on oxidative stability index or induction point (IP) of rice bran oil and their blends with sosybean oil (SBO), mustard oil (MO) and palm olein oil (POO) Click here to View figure |
Conclusions
It could be concluded from above results. The shelf life of RBO is higher than their blends but it is too deficient in Omega-3 fatty acid, which is improved by blending with omega-3 fatty acid rich oil. The result shows that after blending the frying stability of RBO and its blends are evaluated on the basis of fatty acid composition, presence of natural antioxidant, PV, p-AV,TPC and OSI. After blending the fatty acid composition of RBO and its blends shows that blend RPM almost follows the criteria of good oil i.e. ω-6/ω-3 ratio of blend RPM (6:1) is in WHO recommendation range (5-10:1), low PUFA/SFA ratio (1.2:1) and SMP ratio of blend RPM (22.5:49:27.5) which is almost nearest to the WHO recommendation (below 33%: above 33%: about 33%). RBO has highest amount of total natural antioxidant i.e. 3525 ppm followed by blend RS and RSM i.e. 2526 ppm and 2435 ppm respectively. Blend RP and RPM showed least percent increase in peroxide formation during 3 day frying i.e. 9.5% and 9% respectively and it is better than RBO (11.5%). The rate of increase in p-AV of blend RP (33 folds) and RPM (37 folds) is suppressed in compression to RBO (40 folds) and its blends (42-43 folds). On the basis of increase in TPC, it is observed that frying stability of blend RP and RPM is significantly better than RBO and its other blends and acceptability of blend RPM is sustain after 24 h frying. The OSI of RBO deteriorates 66% (2.48 h) from its initial value (7.18 h) during 3 days frying and result reveled that it improved by blending with POO and it decline only 53% and 54% from its initial value (6.63h and 7.63 h) for the blend RP and RPM respectively. The summarized conclusion of the above study is that blending of RBO with POO positively enhances the frying stability of blend and it becomes nutritionally rich by adding appropriate amount of mustard oil.
References
- Sharma, H.K.; Kaur, B.; Sarkar, B.C.; Singh, C. Grasas y Aceites 2006, 57(4), 376-381.
- Omar, M. N.; Hazwani, M. H. N.; Nazreen, M. N. M.; Zuberdi, A. M. Orient J Chem. 2014, 30(3), 1279-1286.
- Warner, K.; Kung, T.L. Food Chem. 1998, 62(1), 191-195.
- Theriault, A.; Cha, T.J.; Wang, Q.; Gapor, A.; Adeli, K.. Clin. Biochem. 1999, 32(5), 309-319.
- Mc Donald B.E. and Eskin M.N.A. Deep Frying; Chemistry, Nutrition, and Practical Applications. Erickson M.D. (Ed.), AOCS Press, Urbana IL 2006, 167-171.
- Caiping, Su.; Pamela, W. J. Am. Oil Chem. Soc. 2004, 81(8), 783-788.
- Dasgupta, S.; Bhatacharyya, D.K. J. Oleo Sci. 2007, 56(11), 569-577.
- Tyagi, V.K.; Vasishtha, A.K. J. Am. Oil Chem. Soc. 1996, 73(4), 499–506.
- AOCS. Official Methods and Recommended Practice of the American Oil Chemists Society. 5th edn. AOCS Press, USA, Method No. Ce1-62.
- Gopala Krishna, A.G.; Hemakumar, K.H.; Khatoo, S. J. Am. Oil Chem. Soc. 2006, 83(2), 117–120.
- Wong, M.L.; Timms, R.E.; Goh, E.M. J. Am. Oil Chem. Soc. 1988, 65(2), 258–261.
- AOCS. Official Methods and Recommended Practice of the American Oil Chemists Society. 5th edn. AOCS Press. Champaign IL. Method No. Cd 8-53, Cd 18-90 and Cd 12b-92.
- Schulte, E. Eur. J. Lipid Sci. Tech. 2004, 106(11), 772-776.
- Mendez, E.; Sanhueza, J.; Speisky, H.; Valenzuela, A. J. Am. Oil Chem. Soc. 1996, 73, 1033–1037.
- U. S. Dept. of Health and Human Services, 2010. CFR – Code of Federal Regulations Title 21. Available at: http://www.accessdata.fda.gov/scripts/cdrh/cfdocs/cfcfr/CFRSearch.cfm%3Ffr%3D184.1555
- The Commission of the European Communities, Commission Directive 80/891/EEC of July 1980 relating to the community method of analysis for determining the erucic acid content in oils and fats intended to be used as such for human consumption and foodstuff containing added oils and fats. EurLex Official Journal 254, 1980.
- Xu, Z.; Hua, N.; Godber, J.S. J. Agric. Food Chem. 2001, 49, 2077-2081.
- Porter, N.A.; Caldwell, S.E.; Mills, K.A. Lipids 1995, 30(4), 277-290.
- Graf, E. Free Radic. Biol. Med. 1992, 13(4), 435-448.
- Nielsen, M.M.; Hasen, A. Cereal Chem. 2008, 85(2), 248-251.
- Vorarat, S.; Managit, C.; Iamthanakul, L.; Soparat, W.; Kamkaen, N. J. Health Res. 2010, 24(2), 67-72.
- Gray, J.I. J. Am. Oil Chem. Soc. 1978, 55(6), 539-546.
- Hidalgo, F.J.; Gomez, G.; Navarro, J.L.; Zaora, R. J. Agric. Food Chem. 2002, 50(21), 5825-5831.
- Muhizi, T. Orient J Chem. 2014, 30(2), 643-649.
- van der Merwe, G.H.; du Plessis, L.M.; Taylor, J.R. J. Sci. Food Agric. 2004, 84, 52-58.
- Renuka, D.R.; Jayalekshmy, A.; Arumughan, C. Food Chem. 2007, 104(2), 658-664.
- Chu, B.S.; Ghazali, H.M.; Lai, O.M.; Che Man, Y.B.; Yusof, S.; Yusoff, M.S.A. Food Chem. 2001, 74(1), 21-33.
- Firestone, D. Inform 1993, 4(12), 1366-1371.
- Handel, A.P.; Gurrieri, S.A.. J. Food Sci. 1990, 55(5), 1417-1421.

This work is licensed under a Creative Commons Attribution 4.0 International License.
![]()
A New Edition of Web of Science
Journal Impact Factor
2022: 0.5
Five Year: 0.8
Journal is Indexed in

Cabells Whitelist
![]()


