Development of A Novel Method for the Detection of 54 Pesticides in Gcms-Ms-Tqd
2OTRI, JNTUA, Anantapuramu.
3Dept of Biochemistry, SK. University, Anantapuramu.
4Department of Bio technology, JNTUH, Hyderabad.
5Department of Bio chemistry, SV University, Tirupathi.
Corresponding Author Email: klakshmidevi2000@yahoo.co.in
DOI : http://dx.doi.org/10.13005/ojc/310345
Download this article as:
![]()
Method Development; GC-MS/MS-TQD; Multi residue Method; Pesticides; Organo chlorines; Organophosphates; Synthetic Pyrethroids; Herbicide and Fungicide mixtures
Introduction
Pesticides can broadly be classified as insecticides, fungicides and herbicides. Insecticides are mainly OCs, OPs, SPs, Herbicides, Fungicides, and Carbamates. Organochlorine compounds are synthetic organic insecticides that contain carbon, hydrogen, chlorine and sometimes oxygen. The essential structural feature about OCs is the presence of carbon-chlorine bond or bonds (Stimman et al., 1985). They are therefore also called chlorinated hydrocarbons.
The determination of pesticide residues in vegetables and tropical fruits is of great interest for many countries, especially those from India, South America, that base an important part of their economy on the exportation of fruits and vegetables, mainly tropical fruits. Restrictive legislation around the world is applied to tropical fruits and vegetables, which have to accomplish the maximum residue levels (MRLs).
In Exporting commodities like Chilies and Curry leaf and some of the Vegetables banned the exporting, because the commodities were detected with the pesticide residues. Hence it is necessary to develop the methods to the Analysis of the Pesticide residues in Gas chromatography.
The aim of this work is to develop modified procedures for the analysis of Multi class Pesticides and its metabolites by gas chromatography Mass Spectroscopy (A. Harinatha Reddy etal ,Steven J Lehotay etal) and to choose procedures for the detection of these substances in Agricultural samples like Vegetables and fruits and Environmental samples like water, soil respectively.
QuEChERS is a novel sample preparation Technique for pesticide multi residue analysis that was developed in between 2000 and 2002 and first reported 2003 (Steven Lehothy 2003). This method is accurate, high recoveries will be achieved for many pesticides in many matrices.
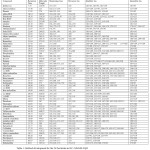 |
Table 1: Method development for the 54 Pesticides in GC- MS/MS-TQD Click here to View table |
Materials and Methods
Chemicals like n-hexane, acetone, and Acetonitrile (HPLC grade) were purchased from Merck, USA, and were glassware distilled before use. Acetone was refluxed over potassium permanganate for 4 h and then distilled. Sodium chloride (NaCl), anhydrous sodium sulfate (Na2SO4), and anhydrous magnesium sulfate (MgSO4) procured from Merck Pvt. Ltd. India. Before use anhydrous sodium sulfate (Na2SO4) and anhydrous magnesium sulfate (MgSO4) were purified with acetone and baked for 4 h at 600◦C in muffle Furnace to remove possible phthalate impurities. Primary secondary amine (PSA) bondasil 40 µmpart 12213024 were purchased from Agilent. Pesticide Standards were procured from Supelco Sigma– Aldrich USA, Fluka Sigma–Aldrich, New Delhi, India.
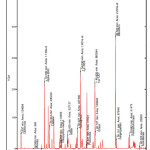 |
Figure 1: OC, OP, SP, Herbicide and fungicides Standard mixture 250 ppb |
Standards and Sample Collection
n-Hexane (Excellar) and Toluene (HPLC Grade) were obtained from Merck respectively and used for the standards preparation. The pesticide reference materials at high purity (≥98 %) were supplied Dr. Ehrenstorfer GmbH (Augsburg, Germany) and sigma Aldrich. For method optimization and validation, pesticides mix (OCs, OPs, SPs, Herbicides, Fungicides and other Pesticides) were prepared at the concentration 1µg/ ml dissolved in (1:1) Hexane: Toluene solution. The solution was stored in the dark at 4°C for the further dilutions.
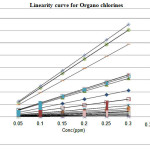 |
Figure 2: Linearity curve for Organo chlorines Click here to View figure |
Six different concentrations of each category (OCs, OPs, SPs, Herbicide and Fungicide mixture) of pesticides were prepared separately for building a calibration curve. Each concentration level was injected six times, and the calculated mean value was used as the calibration point. LOD, LOQ and % RSD values were also calculated for each pesticide.
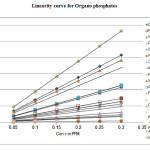 |
Figure 3: Linearity curve for Organo phosphates |
Six calibration standard solutions (0.05, 0.1, 0.15 , 0.20 ,0.25 ,0.30 ppm) of OCs, Alpha HCH ,Aldrin, Dieldrin, Beta HCH, Gamma HCH, Delta HCH, Heptachlor, Dicofol, 2,4 DDE, Alpha endosulfan 4,4 DDE ,2,4 DDD, Beta endosulfan,4,4 DDD, 2,4 DDT, 4,4 DDT, Endosulfan sulphate. OPs Dichlorvos, Monocrotophos, Diazinon, Phorate, Methamidophos, Dimethoate, Methyl parathion, Chloropyrifos methyl, Fenitrothion, Malathion, Azinphosethyl, Triazophos, Chloropyrifos, Quinalphos,Profenophos, Phosphomidon, Chlorfenvinphos, Parathion, Fenamiphos, Ethion, ,Phosalone, Synthetic Pyrethroids(SPs) Bifenthrin, Fluvalinate, Fenvalarate, Fenpropathrin, Deltamethrin, Lamdacyhalothrin, Cypermethrin, Alpha cypermethrin,Permethrin, Cyfluthrin, Herbicides Atrazine, Alachlor, Butachlor Fungicides Hexaconazole Trifloxystrobin, Fipronil of other insecticides were prepared by adding different volumes of the composite standard solution and injected on GC-MS/MS-TQD. Tomatoes were collected from the field of Student farm, College of Agriculture, Professior Jayasankhar Telangana state Agricultural university, Rajendranagar, Hyderabad, Telangana, India.
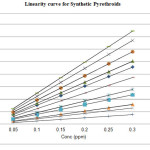 |
Figure 4: Linearity curve for Synthetic Pyrethroids Click here to View figure |
Extraction and Cleanup
The collected fresh vegetable sample (100 g) was chopped, and grind in warring blander. 15 g sample of each vegetable in triplicate was taken for multi-pesticide residue analysis by QuEChERS method. Fifteen grams of macerated sample was mixed with 30 ml acetonitrile and 3gms of Nacl was added and centrifuged at 2500rpm then 9 gms of Sodium sulphate was added to removes water content, and vortexed for 10 min at 50 rpm on rotospin test tube mixture. The extract was centrifuged for 10 min at 10,000 rpm. One milliliter aliquot of supernatant extract was cleaned with the mixture of 0.4 gmsPSA,1.2gms anhy. MgSO4 and 10 mg activated charcoal. The extract was again shaken for 10 min at 50 rpm on rotospin and centrifuged for 10 min at 10,000 rpm. The 2ml of supernatant was collected and evaporated with Turbo vap and finally made up to 1ml with Hexane. One microliter of clean extract was used for the multi pesticide (OCs, SPs, OPs and Herbicides and Fungicides) residues analysis.
The final sample were analyzed on (Brukers 436 GCMS) equipped with fused silica capillary column Factor Four (30 mt×0.25 mm id) coated with 1% phenyl-methyl polysiloxane (0.25 µm film thickness) using Brukers 5ms column. General operating
conditions were as follows: Column temperature program: initially 900C hold for 3min; increase to 1500C @200C hold for 6 min; increase to 2200C @ 20 C hold for 5min; increase to 2800 c @ 50c/min hold for 5min. Total 63 min. injection volume: 1 µl nitrogen flow rate 1 ml/min and makeup 25 ml/min with split ratio 1:10; using carrier gas Helium 99.9%; Injector port temperature 260◦C, Detector parameters are Source- Triple Quadrupole, Mass Range – 50-400, Transfer line temp -2500C, Source temp -2200C, Manifold temp- 400C.
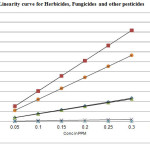 |
Figure 5: Linearity curve for Herbicides, Fungicides and other pesticides |
Results and Discussion
Eight point linearity curve was drawn by injecting OC mix, OP mix, SP mix, Herbicide and Fungicide mix. Regression values were also calculated from Linearity for each pesticide. All the concentration mentioned above were injected six times in order to calculate % RSD values given in Table (2).
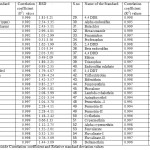 |
Table 2: Pesticide Correlation coefficient and Relative standard deviation values |
It is seen that in Table (2) 54 GCMS six concentrations injected six times and calculated the Regression value and % RSD value. In OCs, Alpha HCH , Aldrin, Dieldrin, Beta HCH, Gamma HCH, Delta HCH, Heptachlor, Dicofol, 2,4 DDE, Alpha endosulfan 4,4 DDE ,2,4 DDD, Beta endosulfan, 4,4 DDD, 2,4 DDT, 4,4 DDT, Endosulfan sulphate shows the Regression value ranged from 0.991-0.999 and percentage of Relative standard deviation is in between 0.29-6.14( Table 2) . LOD of OC pesticides varied in the range of 0.001–0.005 mg kg−1.Similarly, the percent recovery of OCs in the range of 83.65%–102.92% in 0.05 mg/kg, in the range of 78.78–99.66% in 0.25 mg/kg.and in the range of 81.18–108.50% in 0.5 mg/kg respectively (Table 3).
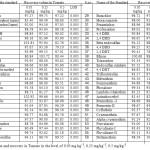 |
Table 3: Fortification and recovery in Tomato in the level of 0.05 mg kg-1, 0.25 mg/kg-1, 0.5 mg/kg-1 Click here to View table |
In OPs, Dichlorvos, Monocrotophos, Diazinon, Phorate, Methamidophos, Dimethoate, Methyl parathion,Chloropyrifos Methyl,Fenitrothion, Malathion, Azinphos ethyl, Triazophos,Chloropyrifos, Quinalphos, Profenophos, Phosphomidon, Chlorfenvinphos, Parathion,Fenamiphos, Ethion, Phosalone shows the Regression value ranged from 0.991-0.998 and percentage of Relative standard deviation is in between 0.31-6.02 (Table 2). LOD of OP pesticides varied in the range of 0.001–0.005 mg kg−1. Similarly, the percent recovery of OPs in the range of 81.45–100.60% in 0.05 mg/kg, in the range of 81.27–103.72% in 0.25 mg/kg.and in the range of 79.07–102.77% in 0.5 mg/kg respectively (Table 3) .
In SPs, Bifenthrin, Fluvalinate,Fenvalarate,Fenpropathrin,Deltamethrin,, Lamda cyhalothrin, Cypermethrin, Alpha cypermethrin,Permethrin, Cyfluthrin shows the Regression value ranged from 0.991-0.999 and percentage of Relative standard deviation is in between 0.58-8.24 ( Table 2) Similarly, the percent recovery of SPs in the range of 91.00–98.69% in 0.05 mg/kg, in the range of 76.45–110.29% in 0.25 mg/kg.and in the range of 90.56–107.40% in 0.5 mg/kg respectively (Table 3) .
In Herbicides and fungicides Alachlor, Butachlor, Atrazine, Hexaconazole Fungicides Trifloxystrobin, Fipronil of other insecticide shows the Regression value ranged from 0.994-0.999 and percentage of Relative standard deviation is in between 0.77-3.79 (Table 2) . Similarly, the percent recovery of Herbicides and Fungicides in the range of 93.57–98.72% in 0.05 mg/kg, in the range of 87.34–97.53% in 0.25 mg/kg.and in the range of 79.10–93.07% in 0.5 mg/kg respectively (Table 3) .
The use of acetone in place of acetonitrile in QuEChERS method has many advantages, but it has low recovery compared to acetonitrile and also it is difficult to analyse in LC. The use of acetonitrile in QuEChERS method has good recovery including its ability to separate from water upon the addition of salt without the addiction nonpolar solvent and amenability with GC and LC applications.
Mixtures of 17 OCs at 6 different levels six times were injected in to GC-MS for drawing the Linearity curve, Regression value ranged from 0.991-0.999 and percentage of Relative standard deviation is in between 0.29 to 6.14 for the all Organo chlorines.
Mixture of 21 OPs at 6 different levels were injected 6 times in to GC-MS for drawing linearity curve. Regression value ranged from 0.991-0.999 and percentage of Relative standard deviation is in between 0.31-6.02 for all the organo phosphates.
Mixture of 10 SPs at 6 different levels was injected 6 times GC-MS for drawing Linearity curve. Regression value ranged from 0.991-0.999 and percentage of Relative standard deviation is in between 0.58-8.24 for all the Synthetic pesticides.
Mixture of Herbicides and Fungicides at 6 different levels were injected 6 times in to GC-MS for drawing linearity curve. Regression value ranged from 0.994-0.999 and percentage of Relative standard deviation is in between 0.77-3.79 for all the Herbicides and Fungicides and Other Pesticides.
Conclusion
Multi residue Method for determination of 54 pesticides of Different categories Viz, OCs, OPs, SPs, Herbicide and Fungicide mix has been developed. All the pesticides were separated and could be analyzed on single method. Linearity curve with all the Regression values ≥ 0.940 and % RSD values in permissible range from 0.29 to 8.24 were calculated.
Acknowledgments
The authors express their gratitude to the Head if the Department, AINP on pesticide residues providing the research facilities and support.
References
- Stimman, M.W., J.S. Bailey and A.S. Deal, 1985. Study guide for agricultural pest control advisers on insects, mites and other invertebrates and their control in Califonia, pp: 69-70.
- A.Harinatha Reddy, D.Ravindranath, N.B.L Prasad and K.Lakshmi Devi , Devolopment of Novel method for the detection of 38 pesticides in GC ECD, Asian journal of chemistry: vol 26, No.7 (2014), 2105-2109.
- Steven J Lehotay and Konstantin I. Eller. Development of Method of analysis for 46 Pesticide Residues in fruits and vegetables by Supercritical fluid extraction and Gas Chromatography / Ion trap Mass Spectroscopy.
- Paula Payá & Michelangelo Anastassiades & Dorothea Mack & Irina Sigalova & Bünyamin Tasdelen &José Oliva & Alberto Barba, Analysis of pesticide residues using the Quick Easy Cheap Effective Rugged and Safe (QuEChERS) pesticide multiresidue method in combination with gas and liquid chromatography and tandem mass spectrometric detection Anal Bioanal Chem (2007) 389:1697–1714 DOI 10.1007/s00216-007-1610-7.


ISSN Online: 2231-5039

![]()


