Ca(II), Zn(II) and Au(III) sulfamethoxazole sulfa-drug complexes: Synthesis, spectroscopic and anticancer evaluation studies
Fatima A.I. Al-Khodir1,2
1Department of Chemistry, College of Science, Princess Nora Bint Abdul Rahman University
2Deanship of Scientific Research, Princess Nora Bint Adul Rahman University.
Corresponding Author Email: fatimaalkhodir@yahoo.com
DOI : http://dx.doi.org/10.13005/ojc/310304
Article Received on :
Article Accepted on :
Article Published : 09 Sep 2015
Herein in this article, three new Ca(II), Zn(II) and Au(III) complexes of sulfamethoxazole (SZ) (sulfa-drug) have been synthesized for the first time. The sulfa-drugs have a great attentions because of their therapeutic applications against bacterial infections. The SZ complexes were discussed with the help of elemental analyses, molar conductance and spectroscopic instruments e.g. IR, 1H-NMR, and electronic spectra. Investigations of the infrared spectra of the SZ and their metal complexes indicated the vibrations due to the sulfonamido (SO2 and –NH) and isoxazole (C=N) groups are shifted with respect to the free molecule in line with their coordination to the metal. In case of calcium(II) an zinc(II) complexes, the coordination site of SZ are the sulfonyl oxygen and SO2-NH sulfonamide nitrogen, but in gold(III) complex, the gold metal ions coordinates through the sulfonyl oxygen and isoxazole nitrogen. These complexes are formulated as: [Ca(SZ)(Cl)2)].8H2O (1), [Zn(SZ)(Cl)2].2H2O (2) and [Au(SZ)(Cl)2].Cl (3). The molar conductance data reveals that both Ca(II) and Zn(II) complexes are non-electrolyte but gold(III) complex is electrolyte. The morphological nano structures of SZ complexes were checked using X-ray powder diffraction (XRD), scanning electron microscope (SEM) and transmission electron microscopy (TEM). The gold(III) complex was recorded good anticancer behavior against Human colon carcinoma (HCT-116) cells and human hepatocellular carcinoma (HepG-2) cells.
KEYWORDS:Sulf-drug; sulfamethoxazole; coordination; nano-size; spectroscopic; anticancer
Download this article as:| Copy the following to cite this article: Al-Khodir F. A. I. Ca(II), Zn(II) and Au(III) sulfamethoxazole sulfa-drug complexes: Synthesis, spectroscopic and anticancer evaluation studies. Orient J Chem 2015;31(3). |
| Copy the following to cite this URL: Al-Khodir F. A. I. Ca(II), Zn(II) and Au(III) sulfamethoxazole sulfa-drug complexes: Synthesis, spectroscopic and anticancer evaluation studies. Orient J Chem 2015;31(3). Available from: http://www.orientjchem.org/?p=10691 |
Introduction
Metal–organic frameworks were the interesting field in the last two decades, not only for the physical applications in the areas such as catalysis, molecular adsorption, magnetism, nonlinear optics, and molecular sensing, but also from their novel topologies and intriguing structural diversities [1-3]. On the other hand, many organic drugs, which possess modified pharmacological and toxicological properties administered in the form of metallic complexes [4], have the potential to act as ligands and the resulting metal–drug complexes are particularly important both in coordination chemistry and biochemistry [5-8], however, the study of metal–drug complexes is still in its early stages, thus representing a great challenge in current synthetic chemistry, coordination chemistry and medicinal bioinorganic chemistry [9-11]. Sulfa drugs have attracted special attention for their therapeutic importance as they were used against a wide spectrum of bacterial ailments [12-14]. Also, some sulfa drugs were used in the treatment of cancer, malaria, leprosy and tuberculosis [14].
Sulfamethoxazole (Fig. 1) is a sulfonamide bacteriostatic antibiotic. It is most often used as part of a synergistic combination with trimethoprim in a 5:1 ratio in co-trimoxazole, also known under trade names such as Bactrim, Septrin, or Septra. Its primary activity is against susceptible forms of Streptococcus, Staphylococcus aureus, Escherichia coli, Haemophilus influenzae, and oral anaerobes. It is commonly used to treat urinary tract infections. In addition it can be used as an alternative to amoxicillin-based antibiotics to treat sinusitis. It can also be used to treat toxoplasmosis [15].
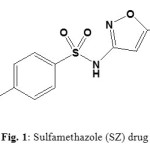 |
Figure 1: Sulfamethazole (SZ) drug Click here to View figure |
In literature survey, many authors have been reported the antimicrobial activity of sulfa-drugs and their metal complexes [16-20]. The metal sulfa-drugs chelates have a great pharmacological and physiological rather than their free drugs itself [19, 20]. In this article, the coordination mode of sulfamethoxazole chelating via Ca(II), Zn(II) and Au(III) metal ions have been investigated. The anticancer activities of gold(III) complex were also evaluated upon its nanometric behavior.
Experimental
Chemicals
Sulfamethoxazole (SZ) antibiotic drug was received from the Aldrich chemical company. All of chemicals used in this study were of analytically reagent grade, commercially available from BDH and used without previous purification like CaCl2, ZnCl2 and sodium tetrachloroaurate(III) dehydrate (NaAuCl4 .2H2O).
Synthesis
The Ca(II), Zn(II) and Au(II) SZ complexes were prepared similarly according to the following procedure: 1.0 mmol of SZ ligand was dissolved in 25 mL methanol then mixed with 25 mL of methanolic solution of 1.0 mmol of each metal ions (CaCl2, ZnCl2 and NaAuCl4 .2H2O). A mixture of 1:1 ratio (metal ions: SZ) was heated under reflux and continuous stirring at 60–70 oC for about 3 h. The mixtures were left overnight until precipitation occurred. The precipitates obtained were filtered off and washed by methanol then left over anhydrous calcium chloride. The yield percent of the products collected were about 70–80%.
Instruments
Carbon, hydrogen and nitrogen analyses have been carried out in Vario EL Fab. CHNS. The amount of water and the metal content percentage were determined by gravimetric analysis method. Infrared spectra of the SZ complexes were recorded on Bruker infrared spectrophotometer in the range of 400-4000 cm-1. The molar conductances of 10-3 M solutions of the complexes in DMSO solvent were measured on a HACH conductivity meter model. All the measurements were taken at room temperature for freshly prepared solutions. The electronic spectrum of the complexes were measured in DMSO solvent with concentration of 1×10⁻³ M, in rang 200-800 nm by using Unicam UV/Vis spectrometer. The effective magnetic moment (μeff) of complexes was measured at room temperature using Gouy’s method by a magnetic susceptibility balance from Johnson Metthey and Sherwood model. 1H-NMR spectra were recorded as DMSO solutions on a Bruker 600 MHz spectrometer using TMS as the internal standard. Thermogravimetric analysis (TGA) experiments were conducted using Shimadzu TGA-50H thermal analyzers. All experiments were performed using a single loose top loading platinum sample pan under nitrogen atmosphere at a flow rate of 30 mL/min and a 10 °C/min heating rate for the temperature range 25-800 °C. SEM images were obtained using a Jeol Jem-1200 EX II Electron microscope at an acceleration voltage of 25 kV. X-ray diffraction (XRD) patterns of the samples were recorded on X Pert Philips X-ray diffractometer. All the diffraction patterns were obtained by using CuKa1 radiation, with a graphite monochromator at 0.02 °/min scanning rate.
Anti-cancer activities
Human colon carcinoma (HCT-116) cells and human hepatocellular carcinoma (HepG-2) cells were obtained from the American type culture collection ATCC, Rockvill, MD). The cells were grown on RPMI-1640 medium supplemented with 10 % inactivated fetal calf serum and 50 µg/mL gentamycin. The cells were maintained at 37 oC in a humidified atmosphere with 5 % CO2 and were subculture two to three times a weak. The cells were grown as monolayers in growth RPMI-1640 medium supplemented with 10% inactivated fetal calf serum and 50 µg/mL gentamycin. The monolayers of 10000 cells adhered at the bottom of the wells in a 96-well micro titer plate incubated for 24 h at 37 oC in a humidified incubator with 5 % CO2. The monolayers were then washed with sterile phosphate buffered saline (0.01 M pH 7.2) and simultaneously the cells were treated with 100 µL from different dilutions of the test sample in fresh maintenance medium and incubated at 37 oC. A control of untreated cells was made in the absence of the test sample. Six wells were used for each concentration of the test sample. Every 24 h the observation under the inverted microscope was made. The number of the surviving cells was determined by staining the cells with crystal violet [21, 22] followed by cell lysing using 33% glacial acetic acid and read the absorbance at 490 nm using ELISA reader (Sun Rise, TECAN, Inc, USA) after well mixing. The absorbance values from untreated cells were considered as 100% proliferation. The number of viable cells was determined using ELISA reader as previously mentioned before and the percentage of viability was calculated as [1 – (ODt/ODc)] 100% where; ODt is the mean optical density of wells treated with the test sample and ODc is the mean optical density of untreated cells. The 50% inhibitory concentration (IC50), the concentration required to cause toxic effect in 50% of inactivated cells, was estimated from graphic plots.
Results and Discussion
Analytical and Physical Data
Stable solid SZ complexes were isolated and assigned based on the elemental analyses, spectroscopic data (infrared, UV-Vis., 1HNMR), molar conductance, and magnetic susceptibility studies. The general formulas (Fig. 2) of the SZ complexes can be depicted as: [Ca(SZ)(Cl)2)].8H2O (1), [Zn(SZ)(Cl)2].2H2O (2) and [Au(SZ)(Cl)2].Cl (3), respectively. The analytical data together with some physical properties of the complexes are summarized in (Table 1).
![Fig. 2: Suggested formulas of [Ca(SZ)(Cl)2)].8H2O (1), [Zn(SZ)(Cl)2].2H2O (2) and [Au(SZ)(Cl)2].Cl (3) complexes.](http://www.orientjchem.org/wp-content/uploads/2015/09/Vol31_No3_CaII_Fati_Fig2-150x150.jpg) |
Figure 2: Suggested formulas of [Ca(SZ)(Cl)2)].8H2O (1), [Zn(SZ)(Cl)2].2H2O (2) and [Au(SZ)(Cl)2].Cl (3) complexes. Click here to View figure |
Table 1: Elemental analyses and physical data of SZ free drug ligand and their metal complexes
| Empirical formula | Color | m.p/ oC |
Λm (μS) |
Elemental analysis, % Found % (Calcd.) |
|||
|
C |
H |
N |
M |
||||
| SZ | White |
169 |
14 |
47.42 |
4.38 |
16.59 |
– |
| 1 | White |
>250
|
12 |
23.51 (23.63) |
5.31 (5.35) |
8.19 (8.27) |
7.39 (7.88) |
| 2 | White | >250 |
23 |
28.12 (28.22) |
3.49 (3.55) |
9.79 (9.87) |
15.31 (15.36) |
| 3 | Yellowish green | >250 |
84 |
21.48 (21.58) |
1.87 (1.99) |
7.43 (7.55) |
35.21 (35.39) |
The sulfamethoxazole ligand behaves as a bidentate ligand and coordinate to the metal ions with different place of chelations (O-SO2 and –NH) and (O-SO2 and C=N) groups. The isolated SZ complexes are 1:1 molar ratio. The molar conductance values for the Ca(II) and Zn(II) complexes of SZ in DMSO solvent with concentration 1.00 x10⁻³ M were found to be within the range of 12 and 23 Ω-1.cm2.mol-1 at 25 oC, respectively, suggesting them to be non-electrolytes [23], but gold(III) complex has value 84 Ω-1.cm2.mol-1 with electrolyte behavior [23]. Hence the molar conductance values of Ca(II) and Zn(II) complexes indicate that no ions are present outside the coordination sphere so the Cl– ions exhibit inside the coordination sphere, but the conductance data of gold(III) complex refer that one of chloride ions presence outside of the coordination sphere. The obtained results were strongly matched with the elemental analysis data where Cl– ions are detected after degradation of these complexes by using nitric acid then precipitation of Cl– ions using AgNO3 reagent.
Infrared spectra
The tentative assignments of the bands for the sulfa-drug ligand (SZ) and their metal complexes are listed in Table 2 and shown in Fig. 3. The SZ ligand is a potential ligand that can be acts as a bidentate or tridentate based on its structure so the full infrared assignments are an important technique to identified the chelation mode with different metal ions. Infrared spectrum of the free SZ ligand shows two strong bands at 3468 and 3378 cm–1 due to the asymmetric and symmetric stretching vibrations of the –NH2 amino group [24]. The medium strong band which appeared at 3299 cm–1 is corresponding to the presence of asymmetric sulfonamide –NH and a very weak band at 3240 cm–1 as symmetric frequency. The other band presence at 1623 cm–1 is assigned to bending vibration motion of –NH2 group. The spectrum of SZ has medium bands at 1597 and 1504 cm-1 which assigned to the stretching frequency of (C=C) of phenyl ring. The methoxazole ring has three stretching vibration bands at 1472, 1439 1365 cm-1. The essential bands exhibited at 1310 and
Table 2: Distinguish Infrared spectral bands and their assignments of a free SZ ligand and their complexes.
| SZ | Ca(II) | Zn(II) | Au(III) | Assignments | ||
| 32683378 | 3464 | 34763386 | 35853498 | ν(NH); NH2 | ||
| 3299 | – | – | 3383 | ν(NH); sulfonamido group | ||
| 1623 | 1624 | 1621 | 1624 | δ(NH2) | ||
| 15971504 | 15991503 | 15961502 | 1496 | ν(C=C); phenyl ring | ||
| 147214391365 | 147114391364 | 147214381398 | 14691424 | Isoxazole ring | ||
| 1310 | 1309 | 1330 | 1322 | νas(SO2); sulfonyl group | ||
| 11881152 | -1152 | -1161 | -1167 | νs(SO2); sulfonyl group | ||
| – | 548 | 548 | 511 | ν(M-O) | ||
| – | 400 | 429 | 441 | ν(M-N) | ||
(1188 and 1152) cm–1 are due to asymmetric and symmetric stretching frequencies of sulfonyl group [24, 25]. The bands concerning –NH2 amino group are unshifted to lower frequencies in case of Ca(II), Zn(II) and Au(III) complexes because of uncoordination toward respected metal ions. The absence of sulfonamide –NH band in the spectra of the Ca(II) and Zn(II) complexes, indicating the involvement of this group in chelation with central metal ion by nitrogen of this group according to the data reported in literature [25]. The band related to isoxazole ring stretching vibrations in free SZ ligand at (1472, 1439 and 1365 cm-1) suffered a shift at (1469 and 1424 cm-1) in the spectra of the gold(III) metal complex indicating that the isoxazole moiety is participation in coordination with gold(III) metal ions [24]. The bands respect to asymmetric and symmetric of sulfonyl group undergoes a shift toward lower or higher frequencies which observed at (1309 and 1152), (1330 and 1161) and (1322 and 1167) cm–1 in Ca(II), Zn(II) and Au(III) complexes, respectively. Upon these results, the coordination mode of the SZ ligand with metal ions is a bidentate through the O and N atoms of sulfonylamid group for Ca(II) and Zn(II) complexes except for Au(III) ion coordinated through O and N atoms of sulfonyl and isoxazole. The new bands appeared in the range 400-550 cm-1are due to the stretching frequency of (M-O) and (M-N) bands.
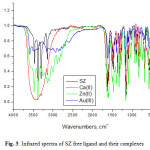 |
Figure 3: Infrared spectra of SZ free ligand and their complexes Click here to View figure |
Electronic spectra and magnetic measurements
The UV-Vis. electronic absorption spectrum of the free SZ ligand (Fig. 4) exhibited two absorption bands in the ultraviolet region, the band at 212 nm assigned to the π→π* transition for the intera-ligand of aromatic system C=C character and a strong absorption band at 270 nm is refer to n→π* transition for oxygen atom of S=O group or nitrogen atom of –NH2 and imine –N=C– groups, respectively [26]. Upon complexation, there are some electronic changes due to the interaction of SZ ligand with calcium(II) and gold(III) metal ions. The UV-visible absorption spectrum of calcium(II) and gold(III) complexes have π→π* transitions at 280 and 290 nm due to aromaticity of double bond characters [27]. On the other side, the n→π* transitions were recorded at the wavelengths 305 and 310 nm which can be assigned to amino, amido, and sulfonyl groups [28]. The magnetic moments of Ca(II), Zn(II) and Au(III) complexes at room temperature have a diamagnetic character. The gold(III) complex also has a diamagnetic nature as expected for low spin d8 complexes, which assigned to square planar geometry [29].
![Fig. 4: Electronic spectra of [Zn(SZ)(Cl)2].2H2O (2) and [Au(SZ)(Cl)2].Cl (3) complexes](http://www.orientjchem.org/wp-content/uploads/2015/09/Vol31_No3_CaII_Fati_Fig4-150x150.jpg) |
Figure 4: Electronic spectra of [Zn(SZ)(Cl)2].2H2O (2) and [Au(SZ)(Cl)2].Cl (3) complexes |
1H-NMR spectra
The 1H-NMR spectra of the SZ free ligand has the expected distinguish signals. 1H-NMR chemical shifts of SZ drug are assigned in Scheme 1. The 1H-NMR spectra of [Ca(SZ)(Cl)2)].8H2O (1), [Zn(SZ)(Cl)2].2H2O (2) and [Au(SZ)(Cl)2].Cl (3) complexes are shown in Fig. 5 and their chemical shifts are listed and assigned in Table 3. The CH3 proton shows singlet at δ= 2.290 ppm and isoxazole proton at δ= 6.107 ppm. In addition a multiplet peak at δ= 6.598 and 7.485 ppm may be due to aromatic protons and peak at δ= 10.95 ppm is due to NH proton. The –NH proton of sulfonylamid group in case of Ca(II) and Zn(II) complexes is disappears indicating the involvement of sulfonylamid nitrogen in the coordination, this result is contrary to the gold(III) complex, because of presence of –NH proton. So, the sites of coordination are different from (Ca(II) and Zn(II)) and Au(III) complex. Signals observed in the calcium(II) and zinc(II) SZ complexes at region of δ= 3.368 and 3.329 ppm, respectively are due to proton of uncoordinated water molecules.
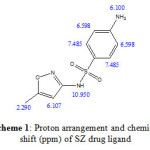 |
Scheme 1: Proton arrangement and chemical shift (ppm) of SZ drug ligand
|
Table 3: 1H-NMR spectral data of free SZ drug and their Ca(II), Zn(II) and Au(III) complexes.
| Assignments |
δ(ppm) |
|||
|
SZ |
Ca(II) |
Zn(II) |
Au(III) |
|
| -NH |
10.950 |
– |
– |
10.946 |
| H; isoxazole |
6.107 |
6.072 |
6.012 |
6.082 |
| H; aromatic |
6.598, 7.485 |
6.588, 7.459 |
6.572, 7.465 |
6.633, 7.490 |
| H; NH2 |
6.100 |
6.098 |
6.053 |
6.085 |
| H; H2O |
– |
3.368 |
3.329 |
– |
| H; CH3 |
2.290 |
2.277 |
2.268 |
2.284 |
![Fig. 5A: 1H-NMR spectrum of [Ca(SZ)(Cl)2)].8H2O (1) complex](http://www.orientjchem.org/wp-content/uploads/2015/09/Vol31_No3_CaII_Fati_Fig5A-150x150.jpg) |
Figure5A: 1H-NMR spectrum of [Ca(SZ)(Cl)2)].8H2O (1) complex Click here to View figure |
![Fig. 5B: 1H-NMR spectrum of [Zn(SZ)(Cl)2].2H2O (2) complex](http://www.orientjchem.org/wp-content/uploads/2015/09/Vol31_No3_CaII_Fati_Fig5B-150x150.jpg) |
Figure 5B: 1H-NMR spectrum of [Zn(SZ)(Cl)2].2H2O (2) complex Click here to View figure |
![Fig. 5C: 1H-NMR spectrum of [Au(SZ)(Cl)2].Cl (3) complex](http://www.orientjchem.org/wp-content/uploads/2015/09/Vol31_No3_CaII_Fati_Fig5C-150x150.jpg) |
Figure 5C: 1H-NMR spectrum of [Au(SZ)(Cl)2].Cl (3) complex Click here to View figure |
Thermal analyses
TGA curves of the [Ca(SZ)(Cl)2)].8H2O (1), [Zn(SZ)(Cl)2].2H2O (2) and [Au(SZ)(Cl)2].Cl (3) complexes are presented in Fig. 6. The first degradation step for calcium(II) and zinc(II) complexes occurs within temperature range of 30-200 oC due to the loss of uncoordinated water molecules. The second-to-third decomposition steps take place within the temperature range of 200-800 oC due to the loss of chlorine gas and decomposition of SZ molecule. The calcium(II) oxide CaO (Calc. 11.03%; Found 10.50%), zinc(II) oxide (Calc. 19.12%; Found 18.60%) and gold metal (Calc. 35.39%; Found 34.90%) are the final products remains stable till 800oC as final residues.
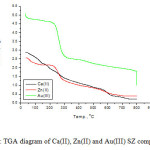 |
Figure 6: TGA diagram of Ca(II), Zn(II) and Au(III) SZ complexes Click here to View figure |
X-ray powder diffraction and SEM studies
Figure 7 shows the XRD patterns of the [Au(SZ)(Cl)2].Cl (3) complex. The main XRD peaks were observed in Fig. 7. The X-ray diffraction patterns confirms that the formed gold(III) complex is a crystalline behavior. The crystalline size diameter of the gold(III) nanoparticle has estimated using Deby-Scherrer formula [30] is 40 nm. The surface morphological and particle size discussions of the gold(III) nanoparticles were performed using scanning electron microscopy (SEM) and transmission electron microscopy (TEM) with pure images represented in Fig. 8. It is clearly obviously that the gold(III) complex is formed extremely fine as a leaf papers with aggregated structure.
![Fig. 7: XRD patterns of [Au(SZ)(Cl)2].Cl (3) complex](http://www.orientjchem.org/wp-content/uploads/2015/09/Vol31_No3_CaII_Fati_Fig7-150x150.jpg) |
Figure 7: XRD patterns of [Au(SZ)(Cl)2].Cl (3) complex Click here to View figure |
![Fig. 8A: SEM image of [Au(SZ)(Cl)2].Cl (3) complex](http://www.orientjchem.org/wp-content/uploads/2015/09/Vol31_No3_CaII_Fati_Fig8A-150x150.jpg) |
Figure 8A: SEM image of [Au(SZ)(Cl)2].Cl (3) complex |
![Fig. 8B: TEM image of [Au(SZ)(Cl)2].Cl (3) complex](http://www.orientjchem.org/wp-content/uploads/2015/09/Vol31_No3_CaII_Fati_Fig8B-150x150.jpg) |
Figure 8B: TEM image of [Au(SZ)(Cl)2].Cl (3) complex
|
Antimicrobial assessments
In vitro cytotoxicity assessment of the [Au(SZ)(Cl)2].Cl (3) complex was performed on human colon carcinoma (HCT-116) cell line and human hepatocellular carcinoma (HepG-2) cell line in the presence of doxorubicin standard drug. The results evaluated upon the determination of inhibitory concentration of 50 % (IC50), the data was listed in Table 4. In comparison between data of [Au(SZ)(Cl)2].Cl (3) complex and doxorubicin standard, the [Au(SZ)(Cl)2].Cl (3) complex has IC50 equal 21.10 and 23.1 μg for HepG-2 and HCT-116 cell line, respectively. From these data we can deduced that [Au(SZ)(Cl)2].Cl (3) complex has an effective against HepG-2 cell line rather than HCT-116 cell line.
Table 4: The inhibitory activities against colon carcinoma and hepatocellular carcinoma cells for the [Au(SZ)(Cl)2].Cl (3) complex and doxorubicin drug
| Sample conc.( μg) |
Viability |
|||
|
HepG-2 cell line |
HCT-116 cell line |
|||
| doxorubicin | Au(III)complex | doxorubicin | Au(III) complex | |
| 50 | 4.91 | 16.72 | 6.82 | 30.92 |
| 25 | 8.87 | 36.28 | 8.89 | 46.73 |
| 12.5 | 14.83 | 48.25 | 14.83 | 68.08 |
| 6.25 | 16.16 | 73.56 | 16.16 | 81.45 |
| 3.125 | 25.28 | 85.94 | 22.28 | 91.32 |
| 1.56 | 34.64 | 94.16 | 34.64 | 96.47 |
| 0.78 | 45.79 | 98.78 | 45.78 | 98.96 |
| 0.39 | 51.08 | 100.00 | 51.28 | 100.00 |
| 0 | 100 | 100.00 | 100 | 100.00 |
| IC50 | 0.467 µg | 2.77 µg | 0.471 µg | 3.41 µg |
Acknowledgment
This work was funded by Deanship of Scientific Research at university of Princess Nora Bint Abdul Rahman.
References
- Moulton, B.; Zaworotko, M.J. Chem. Rev. 2001, 101, 1629.
- Wu, C.D.; Lu, C.Z.; Zhuang, H.H.; Huang, J.S. J. Am. Chem. Soc. 2002, 124, 3836.
- Dybtsev, D.N.; Chun, H.; Kim, K. Angew. Chem. Int. Ed. 2004, 43, 5033.
- Lpez-Gresa, M.P.; Ortiz, R.; Perell, L.; Latorre, J.; Liu-Gonzalez, M.; Garcıa- Granda, S.; Perez-Priede, M.; Cantn, E. J. Inorg. Biochem. 2002, 92, 65.
- Yuan, R.X.; Xiong, R.G.; Abrahams, B.F.; Lee, G.H.; Peng, S.M.; Che, C.M.; You, X.Z. J. Chem. Soc. Dalton Trans. 2001, 2071.
- Turel, I.; Coord. Chem. Rev. 2002, 232, 27.
- Xiao, D.R.; He, J.H.; Sun, D.Z.; Chen, H.Y.; Yan, S.W.; Wang, X.; Yang, J.; Yuan, R.; Wang, E.B. Eur. J. Inorg. Chem. 2012, 1783.
- Drevensek, P.; Zupancic, T.; Pihlar, B.; Jerala, R.; Kolitsch, U.; Plaper, A.; Turel, I. J. Inorg. Biochem. 2005, 99, 432.
- Xiao, D.R.; Wang, E.B.; An, H.Y.; Su, Z.M.; Li, Y.G.; Gao, L.; Sun, C.Y.; Xu, L. Chem. Eur. J. 2005, 11, 6673.
- He, J.H.; Xiao, D.R.; Chen, H.Y.; Yan, S.W.; Sun, D.Z.; Wang, X.; Yang, J.; Yuan, R.; Wang, E.B. Inorg. Chim. Acta. 2012, 385, 170.
- Kathawate, L.; Sproules, S.; Pawar, O.; Markad, G.; Haram, S.; Puranik, V.; Salunke-Gawali, S. J. Mol. Struct. 2013, 1048, 223.
- Beerlev, W.N.; Pelers, W.; Mager, K.; Ann. Trop. Med. Parasite. 1960, 26, 288.
- Hoffman La Roche Co., Swiss Patent No. 416648, 1967.
- Sharaby, C.; Synth. React. Inorg. Met. Org. Chem. 2005, 35, 133.
- Garg, S.K.; Ghosh, S.S.; Mathur, V.S. Int. J. Clin. Pharm. Therapy. Toxicol. 1986, 24(1), 23.
- Ferrer, S.; Borras, J.; Garcia-Esparia, E. J. Inorg. Biochem. 1990, 39, 297.
- Supuran, C.T.; Minicione, F.; Scozzafav, A.; Briganti, F.; Minicinone, G.; Ilises, M.A. Eur. J. Med. Chem. 1998, 33, 247.
- Blasco, F.; Perello, L.; Latorre, J.; Borra, J.; Garcia–Granda, S.J. Inorg. Biochem. 1996, 61, 143.
- Blasco, F.; Ortiz, R.; Perello, L.; Borras, J.; Amigo, J.; Debaerdemaeker, T. J. Inorg. Biochem. 1994, 53, 117.
- Bellú, S.; Hure, E.; Trapé, M.; Rizzotto, M.; Sutich, E.; Sigrist, M.; Moreno, V. Quim. Nova. 2003, 26(2), 188.
- Mosmann, T. J. Immunol. Methods. 1983, 55, 65.
- Gangadevi, V.; Muthumary, J. African J. Biotechnology. 2007, 6, 1382.
- Geary, W.J. Coord. Chem. Rev. 1971, 7, 81.
- Nakamoto, K. “Infrared and Raman spectra of inorganic and coordination compound “. New York: Wiley, 1978.
- Melina, M.; Fernando P.; de Souza, P.C.; Leite, C.Q.; Javier E.; Nascimento, O.R.; Gianella F.; Torre, M.H. J. Mol. Str. 2013, 1036, 180.
- Chohan, Z.H.; Shad, H.A.; Nasim F.H. Appl. Organometal. Chem. 2009, 23(8), 319.
- Ozturk, O.F.; Sekerci, M.; Ozdemir, E. Russ. J. Coord. Chem. 2005, 31, 687.
- Ozturk, O.F.; Sekerci, M.; Ozdemir, E. Russ J Gen Chem. 2006, 76, 33.
- Abdalrazaq, E.A.; Buttrus, N.H.; Abd Al-Rahman, A.A. Asian J. Chem. 2010, 22(3), 2179.
- Cullity, B.D. “Elements of X-ray Diffraction“, Addison-Wesley, Reading, MA, 1972, 102.

This work is licensed under a Creative Commons Attribution 4.0 International License.
![]()
A New Edition of Web of Science
Journal Impact Factor
2022: 0.5
Five Year: 0.8
Journal is Indexed in

Cabells Whitelist
![]()


