Analytical Characterization of two new related impurities of Diltiazem by High Resolution Mass spectrometry and NMR techniques096
DOI : http://dx.doi.org/10.13005/ojc/310363
Download this article as:
![]()
Diltiazem (DTZ) is an optically active calcium channel blocker having a benzodiazepine structure. Two impurities (referred as DTZ-I and DTZ-II) were detected with area percentages ranging from 0.1% to 0.15% during the impurity profile study of Diltiazem hydrochloride drug substance. A simple isocratic high performance liquid chromatographic method (HPLC) and liquid chromatography–mass spectrometry (LC–MS) were used for the detection. The impurities were isolated by preparative column chromatography. Analytical information from nuclear magnetic resonance and mass spectral data of the potential impurities revealed their structures as 2-(4-methoxyphenyl)-5-methyl-4-oxo-2,3,4,5-tetrahydrobenzo[b][1,4]thiazepin-3-yl acetate (DTZ-I) and 2-(4-methoxyphenyl)-4-oxo-5-vinyl-2,3,4,5-tetrahydrobenzo[b][1,4]thiazepin-3-yl acetate (DTZ-II). Impurity identification, isolation and structure elucidation were discussed.
KEYWORDS:Diltiazem; Potential impurities; Isolation; characterization techniques
Introduction
Diltiazem (DTZ), (2S, 3S)-3-acetyloxy-5-[2-(dimethyl-amino)ethyl]-2-(4-methoxyphenyl)-2,3-dihydro-1,5-benzothiazepin-4(5H)-one, is a benzothiazepine calcium-channel blocker with peripherical and coronary vasodilator properties. It is widely used in the management of angina pectoris and hypertension. Treatment with diltiazem is generally well tolerated; however, a variety of skin disorders have been associated with diltiazem therapy; these cutaneous adverse reactions include acne, rash, urticaria and dermatitis1.
During the analysis of different laboratory batches of Diltiazem drug substance, two unknown impurities with area percentages ranging from 0.1% to 0.15% were detected by a simple isocratic HPLC method. To commercialize an active pharmaceutical ingredient (API), as per regulatory requirement, it is mandatory for the manufacturer to identify and characterize all the unknown impurities that are present in API at a level of even below 0.05%2. In this context, a comprehensive study has been undertaken to identify and characterize two impurities present in the laboratory batches of Diltiazem hydrochloride drug substance using spectroscopic and spectrometric techniques.
During the literature survey of Diltiazem3-27 no reports found to unknown impurities isolation and characterization. The study toward the identification and characterization of impurities in Diltiazem was not reported in the literature to date, to the best of our knowledge, and this impurity profiling study will be immense importance for process development chemist to understand the source of potential impurities during the synthesis of Diltiazem hydrochloride (Scheme 1).
Experimental
Samples and reagents
The investigated samples of Diltiazem hydrochloride were obtained from synthetic R&D laboratory of Dr. Reddy’s Laboratories Ltd., CTO-VI, pydibhimavaram, India. Reagents used for analysis, i.e., d-10-camphorsulfonic acid, sodium acetate, sodium hydroxide and acetic acid (AR grade), methanol and acetonitrile (HPLC grade) were obtained from Merck (india) Limited. Dimethylsulphoxide-d6 was purchased from Aldrich Chemical Co., USA. Milli-Q grade water was used.
High performance liquid chromatography (Analytical)
A Waters Model Alliance 2695-separation module (Waters corporation, Milford, MA, USA) equipped with a waters 2998-photo diode array UV detector was used. Data was processed through Waters empower software. The analysis was carried out on Inertsil C18 column, 250 x 4.6 mm i.d., 5m particle size (GL Sciences Inc., Japan) with a mobile phase consisting of Isocratic mixture of buffer, acetonitrile and methanol in the ratio of 50: 25: 25 (v/v/v) dissolved 1.16 gr of d-10-camphorsulfonic acid in 1000 ml of 0.1 M sodium acetate pH 6.2 adjusted with sodium hydroxide as buffer. The column temperature was maintained at ambient condition. Flow rate was kept at 1.6 mL min-1 and the column eluent was monitored at 240 nm.
Preparative liquid chromatography
An Agilent 1200 preparative chromatography system equipped with Agilent G1315D photo diode array UV detector, Fraction collector model Agilent G1346 B and Rheodyne Injector Model 2260A with 1.8 ml loop was used. A 250 x 20 mm i.d column packed with 10mµ YMC Actus triart C18 (YMC Co. Ltd., Japan) was employed for separation with a mobile phase consisting of 30 volumes of 0.1% acetic acid (Aq) and 70 volumes of Acetonitrile was used with UV detection at 240 nm at a flow rate of 20.0 mL min-1. The column temperature was maintained at ambient temperature. The data was recorded using Agilent Chemstation software.
Mass spectrometry
The High Resolution Mass Spectra were obtained from a Waters LCT Premier time of- flight (TOF) mass spectrometer (Milford, USA) with ESI source. Resolution of the LC-TOF/MS was more than 5000. Leucine enkephalin (C28H37N5O7) was used as external lock-mass. The source block and desolvation temperatures were 90°C and 180°C respectively. The nebulizer and desolvation gas (nitrogen) flows were 20 L h-1 and 450 L h-1, respectively. The instrument parameters were used as capillary 3000 V, cone 25 V, extractor 2 V and MCP 2700 V. The acquisitions were done in scan mode. Data acquisition and processing were done using Mass Lynx V.4.0 software. Inertsil C18 column (4.6 mm × 250 mm, 5 μm) with a mobile phase consisting of 30 volumes of 0.1% acetic acid (Aq) and 70 volumes of Acetonitrile was used for the separations. The column temperature was maintained at 30°C. Flow rate was kept at 1.0 mL min-1 and the column eluent was monitored at 240 nm. The diltiazem sample was prepared in methanol at 1.0 mg ml-1 concentration and 10 μL of sample solution was injected in LCMS system.
Nuclear magnetic resonance spectroscopy
1H, 13C, NMR and two dimensional (2D) NMR experiments such as gradient Double Quantum Filtered Correlation Spectroscopy (gDQCOSY), gradient Heteronuclear Single Quantum Coherence Spectroscopy (gHSQC) and gradient Heteronuclear Multibond Coherence Spectroscopy (gHMBC) were performed on 500 MHz Varian Unity Inova FT-NMR instrument at 25oC in DMSO-d6. The 1H and 13C chemical shift values were reported on the δ scale in ppm, relative to TMS (δ = 0.00 ppm).
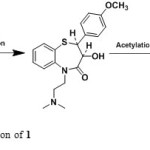 |
Scheme1: Synthetic application of 1 Click here to View scheme |
Results and Discussion
Detection of impurities
Diltiazem hydrochloride samples were analyzed by the HPLC method described in section 2.2. The unknown impurities observed at levels of 0.1 to 0.15%. These samples were subjected to LC- HRMS analysis using the method described in section 2.4. Isolated these unknown impurities by Preparative HPLC using the method described in section 2.3. Isolated two impurities were coinjected with diltiazem to confirm the retention times (Figure 1). The chemical structures of these two impurities were shown in Figure 2.
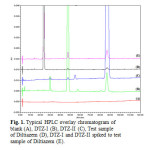 |
Figure1: Typical HPLC overlay chromatogram of blank (A), DTZ-I (B), DTZ-II (C), Test sample of Diltiazem (D), DTZ-I and DTZ-II spiked to test sample of Diltiazem (E). Click here to View figure |
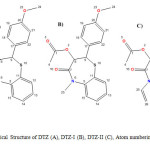 |
Figure2: Chemical Structure of DTZ (A), DTZ-I (B), DTZ-II (C), Atom numbering used for NMR assignments. Click here to View figure |
Structure elucidation of DTZ-I impurity
In the positive mass spectra, the protonated [M+H]+ molecular ion was detected at m/z 358.1. The even m/z number of [M+H]+ ions suggest that DTZ-I contains odd number of nitrogen atoms (nitrogen rule). From these results the molecular ion of DTZ-I was found to be at m/z 357. The mass difference between Diltiazem and DTZ-I was found to be 57 amu less. The positive HR-MS spectrum showed protonated molecular ion at m/z 358.1102 corresponding to molecular formula C19H20NO4S. When compared with the molecular formula of Diltiazem, there was a difference of C3H7N. The difference can be rationalized in terms of the loss of N, N-dimethylethanamine moiety. The presence of additional methyl signal at δ 3.38 ppm in 1H NMR (Figure 3) and corresponding carbon signal at 35.872 ppm in 13C NMR (Figure 4), The correlation between the carbon and proton clearly observed in HSQC (Figure 5) and no methylene protons were observed in HSQC. The methyl proton at δ 3.38 ppm showed HMBC (Figure 6) correlations for carbon C5 and C7 positions at 146.223 and 166.518 ppm respectively (Figure 7). The methyl proton at δ 3.38 ppm didn’t show any correlation in COSY (Figure 8), which confirms the N-Methyl in the structure. NMR assignments are shown in Table 1. The above spectral data supports the assigned structure as 2-(4-methoxyphenyl)-5-methyl-4-oxo-2,3,4,5-tetrahydrobenzo[b][1,4]thiazepin-3-yl acetate (DTZ-I).
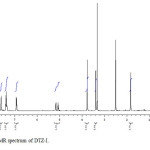 |
Figure3: 1H NMR spectrum of DTZ-I. Click here to View figure |
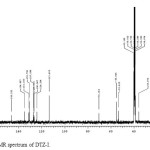 |
Figure4: 13C NMR spectrum of DTZ-I. Click here to View figure |
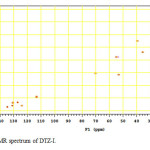 |
Figure5: HSQC NMR spectrum of DTZ-I. Click here to View figure |
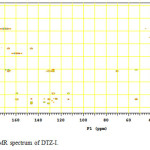 |
Figure6: HMBC NMR spectrum of DTZ-I. Click here to View figure |
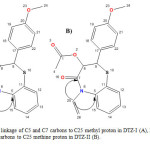 |
Figure7: HMBC linkage of C5 and C7 carbons to C25 methyl proton in DTZ-I (A), HMBC linkage of C5 and C7 carbons to C25 methine proton in DTZ-II (B). Click here to View figure |
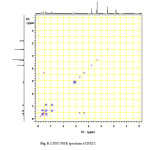 |
Figure8: COSY NMR spectrum of DTZ-I. Click here to View figure |
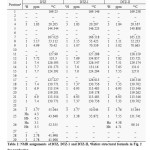 |
Table1: NMR assignments of DTZ, DTZ-1 and DTZ-II, aRefers structural formula in Fig. 2 for numbering. Click here to View table |
Structure elucidation of DTZ-II impurity
In the positive mass spectra, the protonated [M+H]+ molecular ion was detected at m/z 370.1. The even m/z number of [M+H]+ ions suggest that DTZ-II contains odd number of nitrogen atoms (nitrogen rule). From these results the molecular ion of DTZ-II was found to be at m/z 369. The mass difference between Diltiazem and DTZ-II was found to be 45 amu less. The positive HR-MS spectrum showed protonated molecular ion at m/z 370.1131 corresponding to molecular formula C20H20NO4S. When compared with the molecular formula of Diltiazem, there was a difference of C2H7N. The difference can be rationalized in terms of the loss of trimethyl amine moiety. The presence of additional aromatic signal at δ 7.55 ppm in 1H NMR (Figure 9) and corresponding carbon signal at 131.741 ppm in 13C NMR (Figure 10). The correlation between the carbon and proton clearly observed in HSQC (Figure 11) and one methylene signal was observed in HSQC. The methylene proton at δ 4.38 and 4.71 ppm in 1H NMR corresponding carbon signal at 99.41 ppm in 13C NMR. The aromatic methine proton at δ 7.55 ppm showed HMBC (Figure 12) correlations for carbon C5 and C7 positions at 140.808 and 165.121 ppm respectively (Figure 7). The aromatic methine proton at δ 7.55 ppm showed correlation with methylene proton at δ 4.38 and 4.71 ppm in COSY (Figure 13). NMR assignments are shown in Table 1. The above spectral data supports the assigned structure as 2-(4-methoxyphenyl)-4-oxo-5-vinyl-2,3,4,5-tetrahydrobenzo[b][1,4]thiazepin-3-yl acetate (DTZ-II).
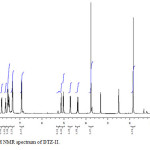 |
Figure9: 1H NMR spectrum of DTZ-II. Click here to View figure |
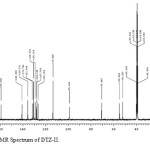 |
Figure10: 13C NMR Spectrum of DTZ-II. Click here to View figure |
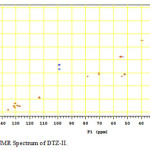 |
Figure11: HSQC NMR Spectrum of DTZ-II. Click here to View figure |
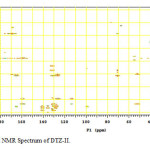 |
Figure12: HMBC NMR Spectrum of DTZ-II. Click here to View figure |
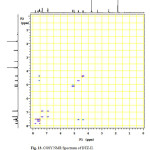 |
Figure13: COSY NMR Spectrum of DTZ-II. Click here to View figure |
Conclusion
The related impurities in Diltiazem hydrochloride were identified, isolated and characterized by HPLC (analytical and preparative), LC-MS and NMR (1H, 13C and 2D) techniques.
Acknowledgements
The authors wish to thank the management of Dr.Reddy’s Laboratories Ltd., for permitting this work to be published. We gratefully acknowledge Dr. Kirti Kumar Jain of Analytical Research and Development for continuous support, motivation and assistance during the course of this project. Cooperation from colleagues of Process R&D and AR&D, Dr.Reddy’s Laboratories Ltd., is appreciated.
Dr. Reddy’s communication number for this research article: IPDO-IPM-00441.
References
- V. Andrisano, P. Hrelia, R. Gotti, A. Leoni, V. Cavrini, J. Pharm. Biomed. Anal. 2001, 25, 589-597.
- ICH harmonized tripartite guidelines, Impurities in New Drug Substances Q3A (R2), current step 4th version, October 25 2006.
- M Seki, T Furutani, R Imashiro, T Kuroda, T Yamanaka, N Harada, H Arakawa, M Kusama, T Hashiyama, Tetrahedron Letters. 2001, 42, 8201–8205.
- R Imashiro, T Kuroda, Tetrahedron Letters. 2001, 42, 1313–1315.
- S Yamada, I T sujioka, T Shibatani, R Yoshioka, Chem. Pharm. Bull. 1999, 47(2), 146-150.
- L Kanerva, U.S. Patent US005514589A, 1996.
- A Pietro, PCT Int. WO 99/20603, 1999.
- V.A. Chatpalliwar, P.K. Porwal, N. Upmanyu, J. Pharm. Analysis 2012, 2(3), 226-237.
- M.A. Ghandour, E.A. Kasim, A.M.M. Ali, M.T. El-Haty, M.M. Ahmed, J. Pharm. Biomed. Anal. 2001, 25, 443-451.
- M.G. Quaglia, E. Donati, S. Fanali, E. Bossu, A. Montinaro, F. Buiarelli, J. Pharm. Biomed. Anal. 2005, 37, 695-701.
- K. Yaku, K. Aoe, N. Nishimura, T. Sato, F. Morishita, J. Chromatgr. A. 1997, 785, 185-193.
- R. Shimizu, K. Ishii, N. Tsumagari, M. Tanigawa, M. Matsumoto, J. Chromatgr. 1982, 253, 101-108.
- B. Dasandi, S. Shah, Shivprakash, J. Chromatgr. B. 2009, 877, 791-798.
- P. Scully, E. Meehan, J. G. Kelly, J. Chromatgr. A. 1996, 729, 297-300.
- E. Molden, G. H. Boe, H. Christensen, L. Reubsaet, J. Pharm. Biomed. Anal. 2003, 33, 275-285.
- P. V. Devarajan, V.V. Dhavse, J. Chromatgr. B. 1998, 706, 362-366.
- G. Carignan, K. Carrier, S. Laganiere, M. Lessard, J. Chromatgr. B. 1995, 672, 261-269.
- B. Chankvetadze, I. Kartozia, G. Blaschke, J. Pharm. Biomed. Anal. 2002, 27, 161-166.
- C. Bodson, E. Rozet, E. Ziemons, B. Evrard, Ph. Hubert, L. Delattre, J. Pharm. Biomed. Anal. 2007, 45, 356-361.
- Y. Sugawara, S. Nakamura, J. Pharm. Biomed. Anal. 1994, 12, 1397-1409.
- R. Shimizu, T. Kakimoto, K. Ishili, Y. Fujimoto, H. Nishi, N. Tsumagari, J. Chromatgr. A. 1986, 357, 119-125.
- K. Shivam, A.C. Shah, B.L. Newalkar, B.V. Kamath, J. liq. Chromatgr. 1992, 15, 2417-2422.
- J.P. Clozel, G.Caillea, Y. Taeymans, P. Theroux, P. Biron, F. Trudel, J.Pharm.Sci. 1984, 73, 771-773.
- A.R. Zoestl, C.T. Hung, S. Wanwimolruk, J. liq. Chromatgr. 1992, 15, 1277-1287.
- T.A. Kolbah, F. Plavsic, J. Pharm. Biomed. Anal. 1990, 8, 915-918.
- J.P. Clozel, G.Caillea, Y. Taeymans, P. Theroux, P. Biron, J.G. Besner, J.Pharm.Sci. 1984, 73, 207-209.
- H.Zhao, M.S.S. Chow, Pharm.Research. 1989, 6, 428-430.


ISSN Online: 2231-5039

![]()


