A Rapid Method for Detection of Refined Olive Oil as Adulterant in Extra Virgin Olive Oil by Differential Scanning Calorimetry
Maryam Karbasian1, Mohammad Hadi Givianrad2* and Yousef Ramezan1
1Department of Food Sciences & Technology, Faculty of Advanced Sciences & Technology, Pharmaceutical Sciences Branch, Islamic Azad University, Tehran, Iran
2Department of Marine Chemistry, Science and Research Branch, Islamic Azad University, Tehran, Iran.
Corresponding Author; Email: givianradh@yahoo.com
DOI : http://dx.doi.org/10.13005/ojc/310354
Article Received on :
Article Accepted on :
Article Published : 08 Aug 2015
Extra virgin olive oil (EVOO) is expensive oil, due to unique specification and its high quality among other edible oils; it might be mixed with other oils. The aim of this research was to identify the added refined olive oil (ROO) to extra virgin olive oil. One sample of each oil was analyzed, admixtures of EVOO: ROO were prepared at different ratios (50:50 ,60:40, 70:30, 80:20, 90:10 and 95:5 w/w). To identify this adulteration, exothermic and endothermic thermograms were investigated. The results indicated that by increasing refined olive oil, onset temperature (Ton) was increased from -61.08 to -56.16 °C; also, offset temperature (Toff) decreased from 19.09 to 12.57 °C. Also results showed that when the ROO ratio increased then the enthalpy average values of both exothermic and endothermic curves were declined. Chemical tests were performed in parallel to better understanding these changes in curves.
KEYWORDS:DSC; Extra virgin olive oil; Refined olive oil; Adulteration; Thermograms
Download this article as:| Copy the following to cite this article: Karbasian M, Givianrad M. H, Ramezan Y. A Rapid Method for Detection of Refined Olive Oil as Adulterant in Extra Virgin Olive Oil by Differential Scanning Calorimetry. Orient J Chem 2015;31(3). |
| Copy the following to cite this URL: Karbasian M, Givianrad M. H, Ramezan Y. A Rapid Method for Detection of Refined Olive Oil as Adulterant in Extra Virgin Olive Oil by Differential Scanning Calorimetry. Orient J Chem 2015;31(3). Available from: http://www.orientjchem.org/?p=10228 |
Introduction
Extra virgin olive oil is a product containing high nutritional quality and has great benefits for consumers. Refined olive oil is the most valuable oil because has the potential effects on human health. So, these two types of oils are categorized as functional food oils1. It also has excellent organoleptic characteristics (Aroma & Taste) and antioxidant properties2. According to trade standard of international olive oil council, olive oil has the highest oleic acid content after canola oil3. Olive oil has a lot of tocopherols like Capparis spinosal oil seeds4. Extra virgin olive oil is a type of oil which is an extracted from fruits of olive trees using mechanical methods or other tools and instruments. Using thermal actions or any extra process such as decanting or centrifuge that changes extra virgin olive oil specification is absolutely prohibited, extra virgin olive oil is rich in natural antioxidant such as phenols, tocopherols and oleic acid. This fatty acid is more resistant than other poly unsaturated fatty acids toward free radical at oxidation process5.
Great amount of demand for extra virgin oil in the world market and also high price of it made profit-seekers to mix low quality oils with extra virgin oil to reach get benefits. Recently Mediterranean and European passed common legislation to support consumers and producers against fraud6.
Various methods are used to detect fraud at extra virgin oil such as Ultraviolet and Visible Spectroscopy (UV/Vis)7, Gas Chromatography (GC-MS)8, Liquid chromatography, electrothermal atomic absorption spectrometry9 and wet methods10, Nuclear Magnetic Resonance Spectroscopy11.
Thermal Analytical techniques such as DSC can also be used to determine melting profile characteristics and crystallization like heat of translation , phase diagram, fatty material contain and fraud identify in fat and butter12.
This technique can provide suitable and precise data from fatty acid profiles and triacylglycerol (TAG) at oils and fats13. Mainly the DSC instrument can be used for food analysis at quality control and research laboratory. The DSC used mostly for comparing materials at heating but cooling material’s studies showed more useful data if thermo dynamically condition is under control. Most methods for fraud detection as mentioned above are expensive and time consuming and could have harmful effect on environment. The DSC instrument have been used by some researchers for fraud detection in olive oil which mixed by other edible oils14.
The aim of this research was investigating DSC cooling and heating thermograms for detection, refined olive oil fraud in extra virgin olive oil.
Experimental
Sampling
EVOO and ROO were purchased from local market in Rood bar (Gilan province, Iran).One samples of each oil was analyzed. Admixtures of EVOO: ROO were prepared at different ratios (50:50, 60:40, 70:30, 80:20, 90:10 and 95:5 w/w). Samples were stored in dark bottles without head space at Room temperature before analysis. All the chemicals and solvents used were of analytical grades purchased from Merck chemical company (Darmstadt, Germany).
Standard chemical analyses
Peroxide (PV), anisdine (AV) and totox (2PV+ AV) values of the samples were determined according to AOCS method15.
Fatty acid composition by gas chromatography (GC)
Gas liquid chromatography was used to determine the component fatty acids. Fatty acids were converted into the methyl esters using transesterification methods of oils with sodium methoxide as catalyst according to AOCS method16. Agilant-technologies 6890 N gas chromatograph equipped with a flame ionization detector and a capillary column (120m X25 mm ID-BPX 700. 250) (USA). Capillary column with temperature programming was used to determine the fatty acid composition according to AOCS method17. Helium was used as the carrier gas.
DSC analysis
Samples of oil (8–10 mg) were weighed into aluminum pans; covers were sealed into place and analyzed with a Setaram instrumentation differential scanning calorimeter, 69300 caluire (France). Indium (melting temperature 156.6 ⁰C, ∆Hf = 28.45 J/g) and n-dodecane (melting temperature -9.65 ⁰C, ∆Hf = 216.73 J/g) were used to calibrate the instrument and an empty pan was used as reference. Oil samples were equilibrated at 30 ⁰C for 3 min and then cooled at -80 ⁰C at the rate of
2 ⁰C/min, equilibrated at -80 ⁰C for 3 min and then heated from -80 ⁰C to 30 ⁰C at 2 ⁰C/min. Dry nitrogen was purged in the DSC cell at 50 cm3/min. Thermograms were analyzed with Universal Analysis Software (Version 3.9A, TA Instruments) to obtain enthalpy ( ∆H, J/g), Ton (⁰C) and Toff (⁰C) of the transitions (intersection of baseline and tangent at the transition) and peak height (Hp W/g). Range of the transitions was calculated as temperature difference between Ton and Toff and at least triplicate analyses were carried out per sample. Statistical analysis was performed using SPSS 19 software, paired t-test model.
Result and Discussion
Differences between samples were significant (p<0.05) for all samples. Standard deviations and mean values of Ton, Toffand enthalpy in admixture refined olive oil and extra virgin olive oil, were tabulated in table1. The results showed that by increasing refined olive oil Ton increased, and Toff decreased; in addition enthalpy in exothermic were tabulated in table1 and endothermic processes decreased. Peroxide value and anisidine value were tabulated in table 1 and by increasing refined olive oil changed. Peroxide value decreased and anisidine value increased.
Table 1: DSC data obtained from DSC thermograms of EVOO, ROO and their admixturesA
|
EnthalpyEndo (Enthalpy J/kg ±SD) |
EnthalpyExo (Enthalpy J/kg ±SD) |
ΔT* (T °C ±SD) |
Toff (T °C ±SD ) |
Ton (T °C ±SDb ) |
Treatments |
|
32.53±0.08h |
10.60±0.03g |
80.8 9±0.10 a |
19.09±0.11a |
-61.80±0.01a |
100%EVOO |
|
26.97±0. 12g |
10.37±0.08f |
78.49 ±0.04 g |
17.10±0.07b |
-61.39±0.03f |
5% ROO |
|
26.15±0.03e |
10.16±0.03e |
60.15±0.00f |
16.95±0.06bc |
-61.23±0.06 e |
10% ROO |
|
25.80±0.03f |
9.89±0.03d |
78.18 ±0.11 e |
16.77±0.12c |
-59.05±0.01d |
20% ROO |
|
24.69±0.04e |
9.89±0.13 d |
75.14 ±0.08 d |
16.53±0.15d |
-58.61±0.07c |
30%ROO |
|
22.92±0.02d |
9.48±0.03b |
73.55 ±0.04c |
15.03±0.05e |
-58.52±0.01c |
40% ROO |
|
20.30±0.11b |
9.27±0.05a |
71.25 ±0.06b |
14.91±0.09e |
-56.34±0.03b |
50% ROO |
|
16.04±0.04a |
9.72±0.01c |
68.72 ±2.06h |
12.57±0.06f |
-56.15±0.00g |
100% ROO |
*ΔT, Temperature difference between Ton and Toff.
A Same letters within each column do not significantly differ (n =3, p < 0.05).
Abbreviations: EVOO, Extra virgin olive oil; ROO, Refined olive oil; Exo, Exothermic; Endo, Endothermic
Table 2: Fatty acids composition of extra virgin olive oil, refined olive oil and their admixture
|
100%ROO |
50%ROO |
40%ROO |
30%ROO |
20%ROO |
10%ROO |
5%ROO |
100%EVOO |
FA |
|
0.02 |
0.05 |
0.00 |
0.00 |
0.015 |
0.04 |
0.01 |
0.01 |
C14:0 |
|
12.25 |
13. 42 |
13.72 |
13.23 |
14.46 |
14.43 |
14.90 |
15.13 |
C16:0 |
|
0.92 |
0.77 |
1. 27 |
0.67 |
0.99 |
0.84 |
1.00 |
0.92 |
C16:1 |
|
2.80 |
2.28 |
1.93 |
2.30 |
2.44 |
2.08 |
2.40 |
2.30 |
C18:0 |
|
69.9 |
69.39 |
68.49 |
68.47 |
64.35 |
64.19 |
63.79 |
62.04 |
C18:1 |
|
9.40 |
11.17 |
11.70 |
11.10 |
12.31 |
12.87 |
12.71 |
13.42 |
C18:2 |
|
1.63 |
1.52 |
1.47 |
1.40 |
1.09 |
1.08 |
1.08 |
1.05 |
C18:3 |
|
3.58 |
3.40 |
3.42 |
3.19 |
4.34 |
3.47 |
4.11 |
5.13 |
others |
|
7.00 |
7.60 |
8.80 |
9.12 |
10.80 |
11.60 |
11.80 |
11.90 |
PV |
|
9.04 |
8.90 |
8.88 |
8.63 |
7.84 |
7.80 |
7.78 |
7.71 |
AV |
| 23.04 |
24.10 |
26.48 |
26.87 |
29.44 |
31.00 |
31.38 |
31.51 |
Totox |
Abbreviations: EVOO, extra virgin olive oil; ROO, Refined olive oil
Abbreviations: PV, peroxide value (meq/ kg oil); AV, Anisidine value
Once, the ratio of ROO was increased, the amount of oleic acid (C18:1) increased, and the amount of linoleic acid (C18:2) was decreased, too.
The results of an investigation showed that the major peak was previously associated with the crystallization of highly unsaturated TAG, while the minor one was attributed to the crystallization of more saturated TAG fractions of EVOO, These results coincides with those reported by former studies. In an investigation Tan et al.,(2000) are revealed a more ordered crystal structure, having TAG chains more compactly associated, could be formed as a result of ROO addition to EVOO, as reflected by the higher crystallization enthalpy. The shift of crystallization toward lower temperatures may be due to the addition of more unsaturated lipid fractions of ROO in EVOO, since lower crystallization temperature onset and significantly narrowed transition range were previously reported for oils with higher degree of unsaturation. In a research conducted by C.P Tan et al.,(1999) , Changes in the sample that are associated with the absorption or evolution of heat cause a change in the different heat flow, which is then recorded as a peak. Naturally occurring fats and oils, such as edible oil composed of a wide variety of triacylglycerols, melt/crystallize over a wide range of temperatures. Thermal properties of edible oils are closely related to those of triacylglycerols18.
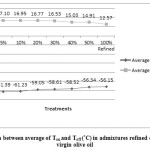 |
Figure 1: Comparison between average of Ton and Toff (°C)in admixtures refined olive oil and extra virgin olive oil |
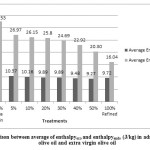 |
Figure 2: Comparison between average of enthalpyexo and enthalpyendo (J/kg)in admixtures refined olive oil and extra virgin olive oil |
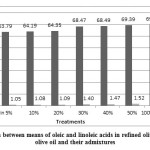 |
Figure 3: Comparison between means of oleic and linoleic acids in refined olive oil, extra virgin olive oil and their admixtures |
Conclusion
In this research , by adding more refined olive oil to extra virgin olive oil, DSC factors were altered and based on these changes by adding more amounts of refined olive oil to extra virgin, Ton increased and Toff decreased. This matter is subject to changes in fatty acids, since by adding more refined olive oil, the amount of oleic acid, which is a monounsaturated fatty acid was increased, and the amount of linoleic acid, which is polyunsaturated fatty acid, decreased. Ton relates to melting monounsaturated triacylglycerols and Toff relates to crystallization of polyunsaturated triacylglycerols. Furthermore, since proxides are primary products and unstable, which could be converted to secondary products like aldehyde and ketones, therefore in this case the proxide value was decreased and anisidine value increased. Moreover, since the refining process was accomplished in vacuum and high temperature, the volatile peroxide could be easily removed; consequently the peroxide value in refined olive oil is much lower than extra virgin olive oil.
Acknowledgments
The authors are so grateful to the Laboratory Complex of I.A.U., science and research branch for valuable technical assistance.
References
- Wong, Y.C.; Hartina, H.; Orient. J. Chem. 2013, 30, 273-245.
- Fragaki, G., Spyros, A., Siragakis, G., Salivaras, E., and Dais, P; Food Chem. 2005, 53, 2810– 2816.
- Nazarbakhsh, V; Ezzatpanah, H; Mashhadi Akbar Boojar, M; Givianrad, M. H.; Ghiassi Tarzi , B.; J. Food Tech. Nutr. 2013, 10, 53-60.
- Givianrad, M.H.; Saffarpour, S; Beheshti, P.; Chem Nat Compd. 2011, 47, 798-799.
- Jafari, M., Kadivar, M., and Keramat, J; Am. Oil Chem. Soc. 2009, 86, 103–110.
- Dourtoglou, V.G., Dourtoglou, Th., Antonopoulos, A., Stefanou, E., Lalas, S., Poulos, C. J. Am. Oil Chem. Soc. 2003, 80, 203-208.
- Frankel, E., Mailer, R., Wang, S., Shoemaker, C., Guinard, J-X., Flynn, J., and Sturzenberger, N.; University of California at Davis: Davis, CA. 2011, 1, 1-22.
- Yang, Y., Ferro, M.D., Cavaco, I., and Liang, Y.; Food Chem.2014. 61, 3693– 3702.
- Givianrad, M.H.; Hashemi, A.; Orient. J. Chem. 2014, 30, 737-743.
- Bahmaei, M., Nazeri, R., and Kalantari, F.; J. Appl. Chem. Res. 2010, 4, 25– 31.
- Fragaki, G., Spyros, A., Siragakis, G., Salivaras, E., and Dais, P.; Food Chem. 2005, 53, 2810– 2816.
- Sheibani, A; Ghotbaddini, N; Bahraman, B; Sadeghi, F.; Orient. J. Chem. 2014, 30, 1205-1209.
- Tan, C. P., Che Man, Y. B., Selamat, J., and Yusoff, M. S. A. .; Food Chem, 2002, 76, 385–389.
- Chiavaro, E., Vittadini, E., Rodriguez-Estrada, M.T., Cerretani, L., and Bendini, A.; Food Chem. 2008, 110, 248–256.
- AOCS (1992). Official methods and recommended practices of the American Oil Chemists Society. D. firestone (Ed.), Champaign, USA (A.O.C.S. Official Method Cd 12b-92: Oxidative Stability Index).
- AOCS (1995a). Official methods and recommended practices of the American Oil Chemists Society. 4th ed. Champaign, USA (A.O.C.S. Official Method Ce 2-66: Preparation of methyl esters of long chain fatty acids).
- AOCS (1995b). Official methods and recommended practices of the American Oil Chemists Society. 4th ed. Champaign, USA (A.O.C.S.Official Method Ce 1-62: Fatty acid composition by gas chromatography).
- Givianrad, M.H.; Saffarpour, S; Larijani, K; Beheshti, P.; Chem. Nat. Compd. 2011, 47, 428-430.

This work is licensed under a Creative Commons Attribution 4.0 International License.
![]()
A New Edition of Web of Science
Journal Impact Factor
2022: 0.5
Five Year: 0.8
Journal is Indexed in

Cabells Whitelist
![]()


