A novel validated RP-HPLC-DAD method for the simultaneous estimation of Metformin Hydrochloride and Canagliflozin in bulk and pharmaceutical tablet dosage form with forced degradation studies
1Department of Pharmaceutical Analysis and Quality Assurance, Malla Reddy College of Pharmacy, Maisammaguda, Secunderabad-500014, India.
2Department of Pharmaceutical Chemistry, Bharat Institute of Technology-Pharmacy, Ibrahimpatnam, Hyderabad-501510, India. Corresponding Author Email: uttampanigrahy@gmail.comDOI : http://dx.doi.org/10.13005/ojc/310328
Download this article as:
![]()
A novel approach was used to develop and validate a rapid isocratic Reversed Phase-High Performance Liquid Chromatographic method for the simultaneous estimation of Metformin Hydrochloride and Canagliflozin in bulk and pharmaceutical tablet dosage form with forced degradation studies. The separation was performed by using Kromasil C18 column (250mm×4.6 mm, 5mm particle size), Waters Alliance e2695 HPLC system with 2998 PDA detector and mobile phase contained a mixture of 0.01M Ammonium acetate (pH adjusted to 3.5 with orthophosphoric acid) and Acetonitrile (65:35, v/v). The flow rate was set to 1ml/min with responses measured at 254nm. The retention time of Metformin Hydrochloride and Canagliflozin was 2.440min and 3.713min respectively with resolution of 8.95.Linearity was established in the range of 50-300µg/ml for Metformin Hydrochloride and 5-30µg/ml for Canagliflozin with correlation coefficients (r2=0.999). The percentage recoveries were between (99.45%-100.65%) and (99.95%-100.74%) for Metformin Hydrochloride and Canagliflozin respectively. Validation parameters were evaluated according to the International Conference on Harmonization (ICH) Q2 R1 guidelines. The forced degradation studies were performed by using HCl, NaOH, H2O2, thermal, UV radiation and water. Metformin Hydrochloride and Canagliflozin are more sensitive towards oxidative degradation condition. The developed method was successfully applied for the quantification and hyphenated instrumental analysis.
KEYWORDS:Metformin Hydrochloride; Canagliflozin; PDA detector; Hyphenated; ICH
Introduction
Metformin Hydrochloride
Metformin Hydrochloride is an orally administered biguanide derivative used to lower blood glucose concentrations in patients with non-insulin-dependent diabetes mellitus1. Metformin Hydrochloride improves insulin sensitivity and decreases insulin resistance by inhibiting Complex 1 of the mitochondrial respiratory chain and inducing AMP-activated protein kinase-dependent signaling2, 3.Metformin Hydrochloride is chemically known as 1, 1-Dimethylbiguanide monohydrochloride were shown in (Figure 1).
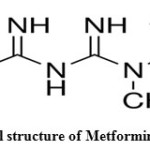 |
Figure 1: Chemical structure of Metformin Hydrochloride Click here to View figure |
Canagliflozin
Canagliflozin is an antidiabetic drug used to improve glycemic control in patients with type 2 diabetes. Canagliflozin is an inhibitor of subtype 2 sodium-glucose transport protein (SGLT2), which is responsible for at least 90% of the glucose reabsorption in the kidney (SGLT1 being responsible for the remaining 10%)4. Canagliflozin is chemically known as (2S, 3R, 4R, 5S, 6R)-2-{3-[5-[4-Fluoro-phenyl)-thiophen-2-ylmethyl]-4-methyl-phenyl}-6-hydroxymethyl-tetrahydro-pyran-3, 4, 5-triol was shown in (Figure 2). Literature review reveals that very few analytical methods have been reported for the determination of Metformin Hydrochloride and Canagliflozin which include ultra performance liquid chromatography5, high performance liquid chromatography with UV detection6,7, Spectrophotometric method8-13,UHPLC-MS/MS14, Solid Phase Extraction-Non-aqueous capillary electrophoresis 15 and bioequivalencestudies16. The present study was aimed to develop a novel, simple, accurate, precise, economic and validated method for the simultaneous estimation of Metformin Hydrochloride and Canagliflozin with forced degradation studies according to ICH guidelines 17.
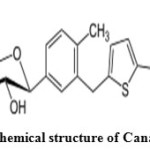 |
Figure 2: Chemical structure of Canagliflozin Click here to View figure |
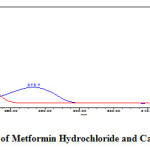 |
Figure 3: Isosbestic point of Metformin Hydrochloride and Canagliflozin at 254nm Click here to View figure |
Experimental
hemicals and Reagents
Metformin Hydrochloride (API) was obtained from Rantus Pharma Pvt. Ltd., Hyderabad, India and Canagliflozin (API) was obtained from Manus Aktteva Biopharma Ltd., Ahmedabad, Gujarat. HPLC grade of Ammonium Acetate was obtained from Rankem Ltd., India and HPLC grade of Acetonitrile was obtained from Merck Specialities Private Limited, India. HPLC grade of Water and Ortho phosphoric acid was obtained from Rankem Ltd., India. Invokamet tablet contains Metformin Hydrochloride 500mg and Canagliflozin 50mg were kindly supplied by Janssen Pharmaceuticals, Inc.
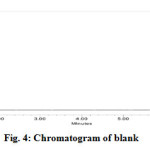 |
Figure 4: Chromatogram of blank Click here to View figure |
Instrumentation
The analysis was performed by using a chromatographic system from Waters Alliance e2695 HPLC system with 2998 PDA detector. The HPLC system was equipped with Empower 2 software. Semi-micro analytical balance (India), Ultrasonic bath sonicator (Frontline FS 4, Mumbai, India), Digital pH meter (Systronics model 802) and Whatmann filter paper No. 41 (Whatmann International Ltd., England) were used in the study.
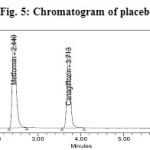 |
Figure 5: Chromatogram of placebo Click here to View figure |
Chromatographic conditions
Metformin Hydrochloride and Canagliflozin was analysed in Kromasil C18 column (250mm×4.6 mm, 5mm particle size) column for the chromatographic separation. The mobile phase was composed of 0.01M Ammonium acetate (pH adjusted to 3.5 with orthophosphoric acid) and Acetonitrile (65:35, v/v). Filtered through 0.45µm nylon membrane filter under vacuum filtration and pumped at ambient temperature, at a flow rate of 1 ml/min with UV detection wavelength at 254nm. Injection volume was 20μl. The run time was 8 min and the retention time of Metformin Hydrochloride and Canagliflozin was found to be 2.440min and 3.713min respectively with resolution of 8.95. The resulting HPLC chromatogram was shown in (Figure 6).
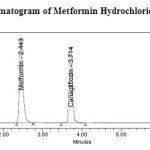 |
Figure 6: Standard chromatogram of Metformin Hydrochloride and Canagliflozin Click here to View figure |
Chromatographic Parameters
Equipment : Waters Alliance e2695 HPLC system with 2998 PDA detector
Column : Kromasil C18 column (250mm×4.6 mm, 5mm particle size) Flow rate : 1ml/min
Wavelength : 254 nm
Injection volume : 20 ml
Column oven : Ambient
Run time : 8 Minutes
Solutions and sample preparation
Preparation of Phosphate buffer
A 0.01M Ammonium acetate buffer was prepared by dissolving0.77gm of Ammonium acetatein 1000ml of HPLC grade water and pH was adjusted to 3.5 with orthophosphoric acid. The buffer was filtered through 0.45μm nylon membrane filter to remove all fine particles and gases.
Preparation of mobile phase
The above prepared Ammonium acetate buffer and Acetonitrile HPLC grade were mixed in the proportion of 65:35, v/v and was filtered through 0.45μm nylon membrane filter and degassed by sonication.
Preparation of diluent
Mobile phase was used as diluent.
Preparation of standard stock solutions of Metformin Hydrochloride and Canagliflozin
Standard stock solutions of Metformin Hydrochloride and Canagliflozin were prepared by dissolving 500mg of Metformin Hydrochloride and 50mg of Canagliflozin in100ml of diluent into a 100ml clean dry volumetric flask and the standard solutions was filtered through 0.45 μm nylon membrane filter and degassed by sonicator to get the concentration of 5000µg/ml of Metformin Hydrochloride and 500µg/ml of Canagliflozin.
Preparation of standard solutions of Metformin Hydrochloride and Canagliflozin for assay
From the above standard stock solution of 5000µg/ml of Metformin Hydrochloride and 500µg/ml of Canagliflozin further pipette 0.4ml and transferred into a 10ml volumetric flask and dilute up to the mark with diluent to get the concentration of 200µg/ml of Metformin Hydrochloride and 20µg/ml of Canagliflozin.
Preparation of sample solutions of Metformin Hydrochloride and Canagliflozin
Twenty tablets were accurately weighed and powdered and tablet powder equivalent to 500mg of Metformin Hydrochloride and 50mg of Canagliflozin were taken into 100ml clean dry volumetric flask, diluent was added and sonicated to dissolve it completely and volume was made up to the mark with the same diluent. Further pipette out 0.4ml from the above Metformin Hydrochloride and Canagliflozin sample stock solution into a 10ml volumetric flask and diluted up to the mark with diluent to get the concentration of 200µg/ml of Metformin Hydrochloride and 20µg/ml of Canagliflozin. 20ml from standard and sample solution were injected into the chromatographic system and the peak areas were measured for Metformin Hydrochloride and Canagliflozin which was shown in (Figure 6 and 7) and the % assay was calculated by comparing the peak area of standard and sample chromatogram by using the formula given below and the assay results was shown in (Table 1).
Table 1: Assay of marketed formulation of Metformin Hydrochloride and Canagliflozin
|
Drug |
Invokamet Tablet Label Claim (mg) |
Amount Found (mg) (n=6) |
% Label Claim ± % RSD (n=6) |
|
Metformin Hydrochloride |
500 |
498.54 |
99.71±0.31
|
|
Canagliflozin |
50 |
49.77 |
99.55±0.43 |
 |
Figure 7: Sample chromatogram of Metformin Hydrochloride and Canagliflozin Click here to View figure |
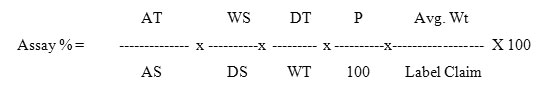
Where:
AT = Average peak area of sample preparation
AS= Average peak area of standard preparation
WS = Weight of standard taken in mg
WT=Weight of sample taken in mg
P = Percentage purity of working standard
DS= Dilution factor for standard preparation
DT=Dilution factor for sample preparation
Selection of wavelength
In simultaneous estimation of Metformin Hydrochloride and Canagliflozin isosbestic wavelength is used. Standard stock solutions of Metformin Hydrochloride and Canagliflozin were prepared by dissolving 500mg of Metformin Hydrochloride and 50mg of Canagliflozin in 100ml of diluent into a 100ml clean dry volumetric flask and the standard solutions was filtered through 0.45μm nylon membrane filter and degassed by sonicator to get the concentration of 5000µg/ml of Metformin Hydrochloride and 500µg/ml of Canagliflozin. From the above standard stock solution of 5000µg/ml of Metformin Hydrochloride and 500µg/ml of Canagliflozin further pipette 0.4ml and transferred into a 10ml volumetric flask and dilute up to the mark with diluent to get the concentration of 200µg/ml of Metformin Hydrochloride and 20µg/ml of Canagliflozin. The wavelength of maximum absorption (λmax) of 200µg/ml of Metformin Hydrochloride and 20µg/ml of Canagliflozin were scanned using UV-Visible spectrophotometer within the wavelength region of 200–400 nm against mobile phase as blank. The isosbestic wavelength (λmax) was found to be 254nm for the combination shown in (Figure 3).
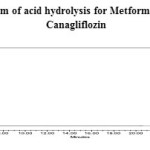 |
Figure 8: Chromatogram of acid hydrolysis for Metformin Hydrochloride and Canagliflozin Click here to View figure |
Method validation
The developed method for the simultaneous estimation of Metformin Hydrochloride and Canagliflozin was validated as per the ICH guidelines for the parameters like system suitability, specificity, linearity, accuracy, precision, ruggedness, robustness, limit of detection (LOD) and limit of quantitation (LOQ) 17.
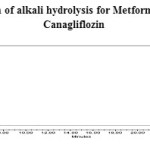 |
Figure 9: Chromatogram of alkali hydrolysis for Metformin Hydrochloride and Canagliflozin Click here to View figure |
System suitability
At first the HPLC system was optimized as per the chromatographic conditions. One blank followed by six replicates of a single calibration standard solution of 200µg/ml of Metformin Hydrochloride and 20µg/ml of Canagliflozin was injected to check the system suitability. To ascertain the system suitability for the proposed method, the parameters such as retention time, theoretical plates, peak asymmetry and resolution were taken and results were presented in (Table 2).
Table 2: System suitability parameters for Metformin Hydrochloride and Canagliflozin
|
Parameter (n=6) |
Metformin Hydrochloride |
Canagliflozin |
|
Retention Time (Mins) |
2.440 |
3.713 |
|
Theoretical plates |
4216 |
12854 |
|
Tailing factor |
1.36 |
1.16 |
|
Resolution |
8.95 |
Specificity
The effect of excipients and other additives usually present in the combined tablet dosage form of Metformin Hydrochloride and Canagliflozin in the determination under optimum conditions was investigated. The specificity of the RP-HPLC method was established by injecting the blank and placebo solution into the HPLC system. The representative chromatogram of blank and placebo was shown in (Figure 4 and 5).
Linearity and range for Metformin Hydrochloride and Canagliflozin
Aliquots of 0.1, 0.2, 0.3, 0.4, 0.5 and 0.6ml of mixed standard working solutions of Metformin Hydrochloride and Canagliflozin was pipette out from the standard stock solution of 5000µg/ml of Metformin Hydrochloride and 500µg/ml of Canagliflozin and transferred into a series of 10ml clean dry volumetric flask and make volume up to the mark with the same diluent to get the concentration of 50, 100, 150, 200, 250 and 300µg/ml of Metformin Hydrochloride and 5, 10, 15, 20, 25 and 30µg/ml of Canagliflozin. The calibration standard solutions of Metformin Hydrochloride and Canagliflozin were injected using a 20μl Hamilton Rheodyne injector and the chromatograms were recorded at 254nm and a calibration graph was obtained by plotting peak area versus concentration of Metformin Hydrochloride and Canagliflozin respectively. The linearity data is presented in (Figure 26) and (Table 3).
Acceptance Criteria: Correlation coefficient should be not less than 0.999
Table 3: Linearity data for Metformin Hydrochloride and Canagliflozin
|
Linearity of Metformin Hydrochloride |
Linearity of Canagliflozin |
||
|
Concentration (µg/ml) |
Peak Area |
Concentration (µg/ml) |
Peak Area |
|
50 |
222108 |
5 |
183389 |
|
100 |
444674 |
10 |
365905 |
|
150 |
673854 |
15 |
552301 |
|
200 |
904485 |
20 |
731880 |
|
250 |
1136832 |
25 |
931837 |
|
300 |
1325355 |
30 |
1092733 |
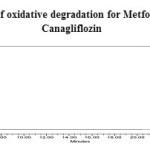 |
Figure 10: Chromatogram of oxidative degradation for Metformin Hydrochloride and Canagliflozin Click here to View figure |
Accuracy studies for Metformin Hydrochloride and Canagliflozin
The accuracy of the method was determined by calculating recovery of Metformin Hydrochloride and Canagliflozin by the method of standard addition. Known amount of standard solution of Metformin Hydrochloride and Canagliflozin at 50%, 100% and 150% was added to a pre quantified sample solution and injected into the HPLC system. The mean percentage recovery of Metformin Hydrochloride and Canagliflozin at each level was calculated and the results were presented in (Table 4 and 5).
Table 4: Recovery study data of Metformin Hydrochloride
|
Sample name |
Amount added (µg/ml) |
Amount found (µg/ml) |
%Recovery |
Statistical Analysis |
|
S1:50% |
100 |
100.04 |
100.04 |
Mean=99.84% (n=3) S.D=0.682 %RSD=0.68 |
|
S2:50% |
100 |
100.40 |
100.40 |
|
|
S3:50% |
100 |
99.08 |
99.08 |
|
|
S4:100% |
200 |
199.50 |
99.75 |
Mean=100.65%(n=3) S.D=0.789 %RSD=0.78 |
|
S5:100% |
200 |
202.42 |
101.21 |
|
|
S6:100% |
200 |
202 |
101.00 |
|
|
S7:150% |
300 |
298.01 |
99.34 |
Mean=99.45%(n=3) S.D=0.291 %RSD=0.29 |
|
S8:150% |
300 |
299.33 |
99.78 |
|
|
S9 :150% |
300 |
297.70 |
99.23 |
Table 5: Recovery study data of Canagliflozin
|
Sample name |
Amount added (µg/ml) |
Amount found (µg/ml) |
%Recovery |
Statistical Analysis |
|
S1:50% |
10 |
10.01 |
100.11 |
Mean=100.74%(n=3) S.D=0.864 %RSD=0.85 |
|
S2:50% |
10 |
10.03 |
100.39 |
|
|
S3:50% |
10 |
10.17 |
101.73 |
|
|
S4:100% |
20 |
20.04 |
100.20 |
Mean=100.06%(n=3) S.D=0.367 %RSD=0.36 |
|
S5:100% |
20 |
20.06 |
100.35 |
|
|
S6:100% |
20 |
19.93 |
99.65 |
|
|
S7 :150% |
30 |
30.09 |
100.33 |
Mean=99.95%(n=3) S.D=0.502 %RSD=0.5 |
|
S8:150% |
30 |
30.04 |
100.16 |
|
|
S9 :150% |
30 |
29.81 |
99.39 |
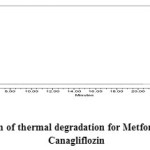 |
Figure 11: Chromatogram of thermal degradation for Metformin Hydrochloride and Canagliflozin Click here to View figure |
Preparation of pre quantified sample solution for accuracy studies
Tablet powder equivalent to 200mg of Metformin Hydrochloride and 20mg of Canagliflozin were taken into 100ml clean dry volumetric flask and diluent was added and sonicated to dissolve it completely and volume was made up to the mark with the same diluent and was filtered through 0.45 μm nylon membrane filter. Further pipette out 1ml from the above Metformin Hydrochloride and Canagliflozin sample stock solution into a 10ml volumetric flask and diluted up to the mark with diluent to get the concentration of 200µg/ml of Metformin Hydrochloride and 20µg/ml of Canagliflozin.
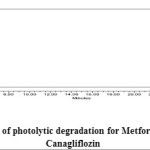 |
Figure 12: Chromatogram of photolytic degradation for Metformin Hydrochloride and Canagliflozin Click here to View figure |
Preparation of standard solution of Metformin Hydrochloride and Canagliflozin for accuracy studies
Standard stock solutions of Metformin Hydrochloride and Canagliflozin were prepared by dissolving 200mg of Metformin Hydrochloride and 20mg of Canagliflozin in100ml of diluent into a 100ml clean dry volumetric flask and the standard solutions was filtered through 0.45 μm nylon membrane filter and degassed by sonicator to get the concentration of 2000µg/ml of Metformin Hydrochloride and 200µg/ml of Canagliflozin.
Preparation of 50% standard solution
From the standard stock solution of 2000µg/ml of Metformin Hydrochloride and 200µg/ml of Canagliflozin further pipette 0.5ml and transferred into a 10ml volumetric flask and dilute up to the mark with diluent to get the concentration of 100µg/ml of Metformin Hydrochloride and 10µg/ml of Canagliflozin.
Preparation of 100% standard solution
From the standard stock solution of 2000µg/ml of Metformin Hydrochloride and 200µg/ml of Canagliflozin further pipette 1ml and transferred into a 10ml volumetric flask and dilute up to the mark with diluent to get the concentration of 200µg/ml of Metformin Hydrochloride and 20µg/ml of Canagliflozin.
Preparation of 150% standard solution
From the standard stock solution of 2000µg/ml of Metformin Hydrochloride and 200µg/ml of Canagliflozin further pipette 1.5ml and transferred into a 10ml volumetric flask and dilute up to the mark with diluent to get the concentration of 300µg/ml of Metformin Hydrochloride and 30µg/ml of Canagliflozin.
Acceptance Criteria: The % Recovery for each level should be between 98.0 to 102.0%.
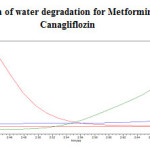 |
Figure 13: Chromatogram of water degradation for Metformin Hydrochloride and Canagliflozin Click here to View figure |
Precision studies for Metformin Hydrochloride and Canagliflozin
Method precision (Repeatability)
Tablet powder equivalent to 200mg of Metformin Hydrochloride and 20mg of Canagliflozin were taken into 100ml clean dry volumetric flask, diluent was added and sonicated to dissolve it completely and volume was made up to the mark with the same diluent and was filtered through 0.45 μm nylon membrane filter. Further pipette out 1ml from the above Metformin Hydrochloride and Canagliflozin sample stock solution into a 10ml volumetric flask and diluted up to the mark with diluent to get the concentration of 200µg/ml of Metformin Hydrochloride and 20µg/ml of Canagliflozin. A homogenous sample of a single batch is analysed six times and was checked whether the method is giving consistent results. The %RSD for the assay of six replicate injections was calculated as mentioned in (Table 6). Acceptance Criteria: The % RSD for the assay of six sample injections should not be more than 2%.
Table 6: Method precision data for Metformin Hydrochloride and Canagliflozin
|
Metformin Hydrochloride |
Canagliflozin |
|||||||
|
S.No. |
Concentration (μg/ml) |
Retention time (min) |
Peak Area |
%Assay |
Concentration (μg/ml) |
Retention time (min) |
Peak Area |
%Assay |
|
1 |
200 |
2.438 |
896027 |
99.35 |
20 |
3.713 |
734744 |
99.73 |
|
2 |
200 |
2.438 |
898822 |
99.66 |
20 |
3.714 |
739030 |
100.31 |
|
3 |
200 |
2.439 |
897108 |
99.47 |
20 |
3.717 |
730041 |
99.09 |
|
4 |
200 |
2.439 |
901800 |
100.00 |
20 |
3.717 |
732051 |
99.37 |
|
5 |
200 |
2.44 |
903334 |
100.17 |
20 |
3.718 |
733069 |
99.50 |
|
6 |
200 |
2.443 |
898203 |
99.60 |
20 |
3.732 |
731465 |
99.29 |
|
Average |
2.4395 |
899215.7 |
99.71 |
Average |
3.7185 |
733400 |
99.55 |
|
|
SD |
0.001871 |
2808.194 |
0.311 |
SD |
0.006892 |
3176.8 |
0.43 |
|
|
%RSD |
0.076 |
0.31 |
0.31 |
%RSD |
0.18 |
0.43 |
0.43 |
|
System precision
The system precision was carried out to ensure that the analytical system is working properly. The standard preparation concentration of 200µg/ml of Metformin Hydrochloride and 20µg/ml of Canagliflozin was injected six times into the HPLC system and the %RSD for the area of six replicate injections was calculated as mentioned in (Table 7). Acceptance Criteria: The % RSD for the peak area of six standard injections should not be more than 2%.
Table 7: System precision data for Metformin Hydrochloride and Canagliflozin
|
Metformin Hydrochloride |
Canagliflozin |
|||||
|
S.No. |
Conc. (μg/ml) |
Retention time (min) |
Peak Area |
Conc. (μg/ml) |
Retention time (min) |
Peak Area |
|
1 |
200 |
2.438 |
898066 |
20 |
3.709 |
735334 |
|
2 |
200 |
2.438 |
897132 |
20 |
3.710 |
733928 |
|
3 |
200 |
2.438 |
895528 |
20 |
3.713 |
735524 |
|
4 |
200 |
2.44 |
900003 |
20 |
3.715 |
730296 |
|
5 |
200 |
2.44 |
896525 |
20 |
3.718 |
734138 |
|
6 |
200 |
2.444 |
902170 |
20 |
3.727 |
733405 |
|
Average |
2.439667 |
898237 |
Average |
3.715 |
733771 |
|
|
SD |
0.002338 |
2453.9 |
SD |
0.006593 |
1891.29 |
|
|
%RSD |
0.09 |
0.27 |
%RSD |
0.18 |
0.26 |
|
Intermediate precision/ruggedness
The intermediate precision (also known as Ruggedness) of the method was evaluated by performing precision on different laboratories by different analysts and different days. The sample preparation concentration of 200µg/ml of Metformin Hydrochloride and 20µg/ml of Canagliflozin was injected six times into the HPLC system and the %RSD for the assay of six replicate injections was calculated as mentioned in (Table 8). Acceptance Criteria: The % RSD for the assay of six sample injections should not be more than 2%.
Table 8: Ruggedness data for Metformin Hydrochloride and Canagliflozin
|
Ruggedness Data for Metformin Hydrochloride |
|||||||||
|
Laboratory-1 (% Assay)-HPLC-1 |
Laboratory-2 (% Assay)-HPLC-2 |
||||||||
|
Analyst-1 |
Analyst-2 |
Analyst-1 |
Analyst-2 |
||||||
|
Conc. (μg/ml) |
Day-1 |
Day-2 |
Day-1 |
Day-2 |
Day-1 |
Day-2 |
Day-1 |
Day-2 |
|
|
200 |
99.30 |
99.42 |
100.04 |
99.32 |
99.17 |
99.72 |
100.08 |
100.16 |
|
|
200 |
99.64 |
99.50 |
99.62 |
99.51 |
99.60 |
99.78 |
99.97 |
100.09 |
|
|
200 |
99.40 |
99.41 |
99.56 |
99.44 |
99.56 |
99.65 |
100.27 |
99.20 |
|
|
200 |
100.01 |
99.66 |
99.67 |
99.19 |
99.70 |
99.77 |
99.98 |
100.01 |
|
|
200 |
100.19 |
99.72 |
99.73 |
99.62 |
99.72 |
100.12 |
99.95 |
99.59 |
|
|
200 |
99.09 |
99.66 |
99.29 |
99.22 |
99.59 |
99.71 |
99.97 |
99.95 |
|
|
Average |
99.61 |
99.56 |
99.65 |
99.38 |
99.56 |
99.79 |
100.04 |
99.83 |
|
|
SD |
0.426 |
0.135 |
0.244 |
0.169 |
0.200 |
0.168 |
0.123 |
0.368 |
|
|
%RSD |
0.43 |
0.14 |
0.24 |
0.17 |
0.20 |
0.17 |
0.12 |
0.37 |
|
|
Intermediate precision within-laboratories variations (n=24) |
|||||||||
|
Laboratory-1 (% Assay)-HPLC-1 |
Laboratory-2 (% Assay)-HPLC-2 |
||||||||
|
Average |
99.55 |
Average |
99.805 |
||||||
|
SD |
0.243 |
SD |
0.214 |
||||||
|
%RSD |
0.24 |
%RSD |
0.21 |
||||||
|
Reproducibility between laboratories (n=48) (% Assay) |
|||||||||
|
Average |
99.68 |
||||||||
|
SD |
0.228 |
||||||||
|
%RSD |
0.22 |
||||||||
|
Ruggedness Data for Canagliflozin |
|||||||||
|
Laboratory-1 (% Assay)-HPLC-1 |
Laboratory-2 (% Assay)-HPLC-2 |
||||||||
|
Analyst-1 |
Analyst-2 |
Analyst-1 |
Analyst-2 |
||||||
|
Conc. (μg/ml) |
Day-1 |
Day-2 |
Day-1 |
Day-2 |
Day-1 |
Day-2 |
Day-1 |
Day-2 |
|
|
20 |
99.71 |
99.86 |
99.76 |
99.69 |
99.26 |
99.26 |
99.30 |
99.28 |
|
|
20 |
100.07 |
99.68 |
99.56 |
99.38 |
99.41 |
99.32 |
99.79 |
99.26 |
|
|
20 |
99.83 |
99.56 |
100.02 |
99.51 |
99.56 |
99.24 |
99.34 |
99.39 |
|
|
20 |
99.42 |
100.01 |
100.21 |
99.68 |
100.10 |
99.30 |
100.05 |
99.48 |
|
|
20 |
99.75 |
100.15 |
99.53 |
100.14 |
99.56 |
100.20 |
99.68 |
99.75 |
|
|
20 |
99.71 |
99.68 |
99.38 |
100.21 |
99.27 |
99.26 |
99.25 |
100.30 |
|
|
Average |
99.75 |
99.82 |
99.74 |
99.77 |
99.53 |
99.43 |
99.57 |
99.58 |
|
|
SD |
0.21 |
0.23 |
0.32 |
0.34 |
0.31 |
0.38 |
0.32 |
0.40 |
|
|
%RSD |
0.21 |
0.23 |
0.32 |
0.34 |
0.31 |
0.38 |
0.32 |
0.40 |
|
|
Intermediate precision within-laboratories variations (n=24) |
|||||||||
|
Laboratory-1 (% Assay)-HPLC-1 |
Laboratory-2 (% Assay)-HPLC-2 |
||||||||
|
Average |
99.77 |
Average |
99.52 |
||||||
|
SD |
0.275 |
SD |
0.352 |
||||||
|
%RSD |
0.27 |
%RSD |
0.35 |
||||||
|
Reproducibility between laboratories (n=48) (% Assay) |
|||||||||
|
Average |
99.64 |
||||||||
|
SD |
0.313 |
||||||||
|
%RSD |
0.31 |
||||||||
Limit of Detection (LOD) and Limit of Quantification (LOQ)
Limit of Detection (LOD) and Limit of Quantification (LOQ) were calculated as 3.3×SD/S and 10×SD/S respectively as per ICH guidelines, Where SD is the standard deviation of the response (Y-intercept) and S is the slope of the calibration curve. The LOD is the smallest concentration of the analyte that gives a measurable response (signal to noise ratio of 3). The LOD of Metformin Hydrochloride and Canagliflozin was calculated and shown in (Table 9). The LOQ is the smallest concentration of the analyte which gives response that can be accurately quantified (signal to noise ratio of 10). The LOQ of Metformin Hydrochloride and Canagliflozin was calculated and shown in (Table 9).
Table 9: Summary of validation parameter for Metformin Hydrochloride and Canagliflozin
|
Parameters |
RP-HPLC method |
|||
|
Metformin Hydrochloride |
Canagliflozin |
|||
| Linearity range (µg/ml) |
50-300 |
5-30 |
||
| Slope |
4475 |
36722 |
||
| Intercept |
1187 |
320.3 |
||
| Correlation coefficient |
0.999 |
0.999 |
||
| LOD (µg/ml) |
0.27 |
0.01 |
||
| LOQ (µg/ml) |
0.83 |
0.04 |
||
| Method Precision (% RSD, n=6) |
0.31 |
0.43 |
||
| System precision (% RSD, n=6) |
0.27 |
0.26 |
||
| Ruggedness (% RSD, n=24) |
Lab-1 |
Lab-2 |
Lab-1 |
Lab-2 |
|
0.24 |
0.21 |
0.27 |
0.35 |
|
| Reproducibility (% RSD, n=48) |
0.22 |
0.31 |
||
| % Accuracy |
99.45-100.65 |
99.95-100.74 |
||
| Robustness (% RSD, n=6) |
Less Flow rate |
More Flow rate |
Less Flow rate |
More Flow rate |
|
0.28 |
0.05 |
0.56 |
0.5 |
|
|
Less Organic phase |
More Organic phase |
Less Organic phase |
More Organic phase |
|
|
1.4 |
0.41 |
0.58 |
0.61 |
|
|
Less Temperature |
More Temperature |
Less Temperature |
More Temperature |
|
|
1.3 |
0.32 |
0.74 |
0.59 |
|
Robustness
As part of the Robustness, deliberate change in the flow rate, mobile phase proportion of ±10% and column temperature was made to evaluate the impact on the method. The results reveal that the method is robust. The results are summarized in (Table 10, 11 and 12).
Table 10: Summary of robustness (change in flow rate) for Metformin Hydrochloride and Canagliflozin
|
Drug |
Change in Flow rate (ml/min) |
Retention Time (Mins) |
Change in flow Rate (0.9 ml/min to 1.1 ml/min) |
||||
|
Average peak area (n=6) |
SD |
% RSD |
USP Plate Count |
Asymmetry |
|||
|
Metformin Hydrochloride |
0.9 |
2.727 |
999154 |
2877.2 |
0.28 |
4027 |
1.48 |
|
1.0 |
2.439 |
898237 |
2453.8 |
0.27 |
4216 |
1.36 |
|
|
1.1 |
2.196 |
801763 |
422.796 |
0.05 |
3526 |
1.45 |
|
|
Canagliflozin |
0.9 |
4.142 |
782675 |
4422.53 |
0.56 |
12240 |
1.19 |
|
1.0 |
3.715 |
733771 |
1891.29 |
0.26 |
12854 |
1.15 |
|
|
1.1 |
3.335 |
638326 |
3195.37 |
0.5 |
11010 |
1.19 |
|
Table 11: Summary of robustness (change in mobile phase) for Metformin Hydrochloride and Canagliflozin
|
Drug |
Change in Mobile Phase |
Retention Time (Mins) |
Change in mobile phase (0.01M Ammonium acetate (pH adjusted to 3.5 with orthophosphoric acid) and Acetonitrile) (68:32 v/v to 62:38v/v) | ||||
|
Average peak area (n=6) |
SD |
% RSD |
USP Plate Count |
Asymmetry |
|||
|
Metformin Hydrochloride |
10% less Organic (68:32 v/v) |
2.426 |
912558
|
13209.89 |
1.4 |
3861
|
1.48
|
|
Actual (65:35 v/v) |
2.439 |
898237 |
2453.8 |
0.27 |
4216 |
1.36 |
|
|
10% more Organic (62:38v/v) |
2.431
|
886527
|
3687
|
0.41
|
3887
|
1.47
|
|
|
Canagliflozin |
10% less Organic (68:32 v/v) |
3.626
|
724007
|
4201.11
|
0.58 |
11949
|
1.19
|
|
Actual (65:35 v/v) |
3.715 |
733771 |
1891.29 |
0.26 |
12854 |
1.15 |
|
|
10% more Organic (62:38v/v) |
3.689
|
716425
|
4385.49
|
0.61
|
11538
|
1.19
|
|
Table 12: Summary of robustness (change in column temperature) for Metformin Hydrochloride and Canagliflozin
|
Drug |
Change in column temperature |
Retention Time (Mins) |
Change in column temperature (28°C to 32°C) |
||||
|
Average peak area (n=6) |
SD |
% RSD |
USP Plate Count |
Asymmetry |
|||
|
Metformin Hydrochloride |
28°C |
2.426 |
911899
|
11887.64
|
1.3
|
3861
|
1.48
|
|
Actual temperature (30°C) |
2.439 |
898237 |
2453.8 |
0.27 |
4216 |
1.36 |
|
|
32°C |
2.196 |
802965
|
2575.56
|
0.32
|
3525
|
1.44
|
|
|
Canagliflozin |
28°C |
3.626 |
720694
|
5344.83 |
0.74
|
11963
|
1.18 |
|
Actual temperature (30°C) |
3.715 |
733771 |
1891.29 |
0.26 |
12854 |
1.15 |
|
|
32°C |
3.335 |
636649
|
3808.48
|
0.59
|
11017
|
1.19 |
|
Stability of solution
The %RSD of the assay of Metformin Hydrochloride and Canagliflozin from the solution stability and mobile phase stability experiments was within 2%. The results of the solution and mobile phase stability experiments confirm that the sample solutions and mobile phase used during the assays were stable upto 48hours at room temperature was calculated and shown in (Table 13 and 14).
Table 13: Summary of solution stability-effect of pH of mobile phase (0.01M Ammonium acetate and Acetonitrile (65:35, v/v)) (pH adjusted to 3.5 with orthophosphoric acid) for Metformin Hydrochloride for 48 hours at room temperature.
|
|
Solution stability for Metformin Hydrochloride |
|||||
|
S.No. |
Concentration (μg/ml) |
Retention time (min) |
Peak Area |
%Assay |
USP Plate Count |
Asymmetry |
|
1 |
200 |
2.438 |
898066 |
99.58 |
4214 |
1.35 |
|
2 |
200 |
2.438 |
897132 |
99.48 |
4124 |
1.36 |
|
3 |
200 |
2.438 |
895511 |
99.30 |
4146 |
1.37 |
|
4 |
200 |
2.440 |
900003 |
99.80 |
4146 |
1.37 |
|
5 |
200 |
2.440 |
896525 |
99.41 |
4183 |
1.36 |
|
6 |
200 |
2.444 |
902170 |
100.04 |
4185 |
1.37 |
|
Average |
2.439 |
898234.5 |
99.60 |
4166 |
1.36 |
|
|
SD |
0.00233809 |
2457.62054 |
0.274 |
33.2184688 |
0.00816497 |
|
|
%RSD |
0.09 |
0.27 |
0.27 |
0.7 |
0.59 |
|
Table 14: Summary of solution stability-effect of pH of mobile phase (0.01M Ammonium acetate and Acetonitrile (65:35, v/v)) (pH adjusted to 3.5 with orthophosphoric acid) for Canagliflozin for 48 hours at room temperature.
|
|
Solution stability for Canagliflozin |
|||||
|
S.No. |
Concentration (μg/ml) |
Retention time (min) |
Peak Area |
%Assay |
USP Plate Count |
Asymmetry |
|
1 |
20 |
3.709 |
728817 |
99.61 |
12204 |
1.14 |
|
2 |
20 |
3.710 |
729244 |
99.66 |
12260 |
1.16 |
|
3 |
20 |
3.713 |
730140 |
99.79 |
12254 |
1.15 |
|
4 |
20 |
3.715 |
727898 |
99.48 |
12219 |
1.15 |
|
5 |
20 |
3.718 |
728235 |
99.53 |
12255 |
1.16 |
|
6 |
20 |
3.727 |
727799 |
99.47 |
12266 |
1.14 |
|
Average |
3.715 |
728688 |
99.59 |
12243 |
1.15 |
|
|
SD |
0.00659293 |
900.411776 |
0.12 |
25.2190404 |
0.00894427 |
|
|
%RSD |
0.17 |
0.12 |
0.12 |
0.20 |
0.77 |
|
Forced degradation studies
Acid Degradation Studies
To 1ml of stock solution of Metformin Hydrochloride and Canagliflozin, 1ml of 2N Hydrochloric acid was added and refluxed for 30mins at 600C. The resultant solution was diluted to obtain 200µg/ml and 20µg/ml solution and 20µl solutions were injected into the HPLC system and the chromatogram were recorded to assess the stability of sample was shown in (Figure 8) and purity plot of acid degradation for Metformin Hydrochloride and Canagliflozin was shown in (Figure 14 and 15).
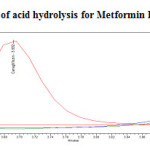 |
Figure 14: Purity plot of acid hydrolysis for Metformin Hydrochloride Click here to View figure |
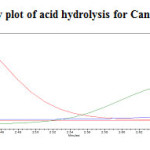 |
Figure 15: Purity plot of acid hydrolysis for Canagliflozin Click here to View figure |
Table 15: Forced degradation data of Metformin Hydrochloride and Canagliflozin in different degradation conditions.
|
Forced degradation data of Metformin Hydrochloride |
|||||||||
|
Degradation condition |
Retention time |
Area |
% Area |
Purity Angle |
Purity Threshold |
USP Plate Count |
Asymmetry |
||
|
Acid hydrolysis |
2.433 |
849907 |
55.68 |
0.275 |
0.978 |
5459 |
1.5 |
||
|
Alkaline hydrolysis |
2.431 |
853423 |
54.83 |
0.224 |
0.540 |
3846 |
1.5 |
||
|
Oxidative degradation |
2.594 |
830313 |
22.85 |
0.192 |
0.204 |
8377 |
1.3 |
||
|
Thermal degradation |
2.431 |
879803 |
55.14 |
0.259 |
0.545 |
3832 |
1.5 |
||
|
Photolytic degradation |
2.433 |
881806 |
54.84 |
0.252 |
0.525 |
3897 |
1.5 |
||
|
Water degradation |
2.431 |
885972 |
55.82 |
0.209 |
0.617 |
3885 |
1.5 |
||
|
Forced degradation data of Canagliflozin |
|||||||||
|
Degradation condition |
Retention time |
Area |
% Area |
Purity Angle |
Purity Threshold |
USP Plate Count |
Asymmetry |
||
|
Acid hydrolysis |
3.692 |
696059 |
44.31 |
0.156 |
0.365 |
12389 |
1.2 |
||
|
Alkaline hydrolysis |
3.688 |
705872 |
45.16 |
0.131 |
0.284 |
12113 |
1.2 |
||
|
Oxidative degradation |
3.690 |
705279 |
38.89 |
0.124 |
0.283 |
11823 |
1.2 |
||
|
Thermal degradation |
3.688 |
712117 |
44.86 |
0.130 |
0.281 |
12128 |
1.2 |
||
|
Photolytic degradation |
3.692 |
715119 |
45.16 |
0.136 |
0.289 |
11369 |
1.2 |
||
|
Water degradation |
3.701 |
721144 |
44.18 |
0.120 |
0.290 |
11835 |
1.2 |
||
|
Degradation condition |
Drug Recovered (%) |
Drug Decomposed (%) |
|||||||
|
Metformin Hydrochloride |
Canagliflozin |
Metformin Hydrochloride |
Canagliflozin |
||||||
|
Standard |
100 |
100 |
100 |
100 |
|||||
|
Acid hydrolysis |
95.22 |
95.63 |
4.78 |
4.37 |
|||||
|
Alkaline hydrolysis |
95.61 |
96.98 |
4.39 |
3.02 |
|||||
|
Oxidative degradation |
93.02 |
96.90 |
6.98 |
3.10 |
|||||
|
Thermal degradation |
98.57 |
97.84 |
1.43 |
2.16 |
|||||
|
Photolytic degradation |
98.79 |
98.25 |
1.21 |
1.75 |
|||||
|
Water degradation |
99.26 |
99.08 |
0.74 |
0.92 |
|||||
Alkali Degradation Studies
To 1ml of stock solution of Metformin Hydrochloride and Canagliflozin, 1 ml of 2N sodium hydroxide was added and refluxed for 30mins at 600C.The resultant solution was diluted to obtain 200µg/ml and 20µg/ml solution and 20µl solutions were injected into the HPLC system and the chromatogram were recorded to assess the stability of sample was shown in (Figure 9) and purity plot of alkali degradation for Metformin Hydrochloride and Canagliflozin was shown in (Figure 16 and 17).
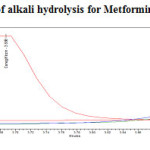 |
Figure 16: Purity plot of alkali hydrolysis for Metformin Hydrochloride Click here to View figure |
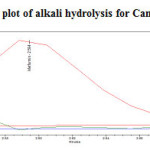 |
Figure17: Purity plot of alkali hydrolysis for Canagliflozin Click here to View figure |
Oxidative degradation Studies
To 1ml of stock solution of Metformin Hydrochloride and Canagliflozin, 1 ml of 3% Hydrogen peroxide (H2O2) was added and the solution was kept for 30 mins at 600C. For HPLC study, the resultant solution was diluted to obtain 200µg/ml and 20µg/ml solution and 20µl solutions were injected into the HPLC system and the chromatogram were recorded to assess the stability of sample was shown in (Figure 10) and purity plot of oxidative degradation for Metformin Hydrochloride and Canagliflozin was shown in (Figure 18 and 19).
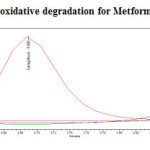 |
Figure 18: Purity plot of oxidative degradation for Metformin Hydrochloride Click here to View figure |
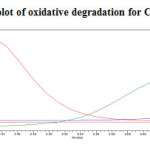 |
Figure 19: Purity plot of oxidative degradation for Canagliflozin Click here to View figure |
Thermal Degradation Studies
The standard drug solution was placed in oven at 1050C for 6hrs to study dry heat degradation. For HPLC study, the resultant solution was diluted to 200µg/ml and 20µg/ml solution and 20µl solutions were injected into the HPLC system and the chromatogram were recorded to assess the stability of sample was shown in (Figure 11) and purity plot of thermal degradation for Metformin Hydrochloride and Canagliflozin was shown in (Figure 20 and 21).
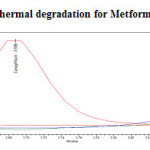 |
Figure 20: Purity plot of thermal degradation for Metformin Hydrochloride Click here to View figure |
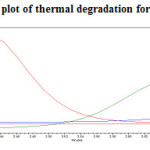 |
Figure 21: Purity plot of thermal degradation for Canagliflozin Click here to View figure |
Photolytic degradation studies
The photochemical stability of the drug was also studied by exposing the drug solution to UV light by keeping the beaker in UV Chamber for 7days or 200 Watt hours/m2 in photo stability chamber.For HPLC study, the resultant solution was diluted to obtain 200µg/ml and 20µg/ml solution and 20µl solutions were injected into the HPLC system and the chromatogram were recorded to assess the stability of sample was shown in (Figure 12) and purity plot of photolytic degradation for Metformin Hydrochloride and Canagliflozin was shown in (Figure 22 and 23).
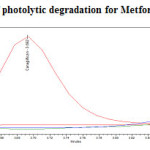 |
Figure 22: Purity plot of photolytic degradation for Metformin Hydrochloride Click here to View figure |
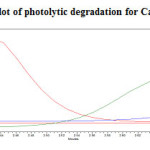 |
Figure 23: Purity plot of photolytic degradation for Canagliflozin Click here to View figure |
Water Degradation Studies
Stress testing under neutral conditions was studied by refluxing the drug in water for 6hrs at a temperature of 60ºC. For HPLC study, the resultant solution was diluted to 200µg/ml and 20µg/ml solution and 20µl solutions were injected into the HPLC system and the chromatogram were recorded to assess the stability of sample was shown in (Figure 13) and purity plot of water degradation for Metformin Hydrochloride and Canagliflozin was shown in (Figure 24 and 25).
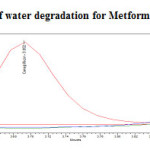 |
Figure 24: Purity plot of water degradation for Metformin Hydrochloride Click here to View figure |
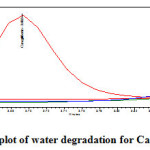 |
Figure 25: Purity plot of water degradation for Canagliflozin Click here to View figure |
Results and Discussion
To optimize the RP-HPLC parameters, several mobile phase compositions were tried. A satisfactory separation and good peak symmetry for Metformin Hydrochloride and Canagliflozin were obtained with a mobile phase containing a mixture of 0.01M Ammonium acetate (pH adjusted to 3.5 with orthophosphoric acid) and Acetonitrile (65:35, v/v) was delivered at a flow rate of 1ml/min to get better reproducibility and repeatability. Quantification was achieved with PDA detection at 254 nm based on peak area. The retention time of Metformin Hydrochloride and Canagliflozin was found to be 2.440 min and 3.713 min respectively with resolution of 8.95 was shown in (Figure 6). Linearity was established for Metformin Hydrochloride and Canagliflozin in the range of 50-300µg/ml for Metformin Hydrochloride and 5-30µg/ml for Canagliflozin with correlation coefficients (r2=0.999) and the percentage recoveries were between 99.45 % to 100.65% and 99.95% to 100.74% for Metformin Hydrochloride and Canagliflozin respectively, which indicate accuracy of the proposed method. The % RSD values of accuracy for Metformin Hydrochloride and Canagliflozin were found to be < 2 %. The % RSD values of method precision are 0.31% and 0.43% for Metformin Hydrochloride and Canagliflozin respectively and % RSD values of system precision are 0.27% and 0.26% for Metformin Hydrochloride and Canagliflozin. The % RSD values of reproducibility are 0.22% and 0.31% for Metformin Hydrochloride and Canagliflozin respectively, reveal that the proposed method is precise. LOD values for Metformin Hydrochloride and Canagliflozin were found to be 0.27µg/ml and 0.01µg/ml respectively and LOQ values for Metformin Hydrochloride and Canagliflozin were found to be 0.83µg/ml and 0.04µg/ml respectively was shown in (Table 9). The % RSD values of robustness studies were found to be < 2% reveal that the method is robust enough was shown in (Table 10, 11 and 12). These data show that the proposed method is specific and sensitive for the determination of Metformin Hydrochloride and Canagliflozin. The results of system suitability testing are given in (Table 2).
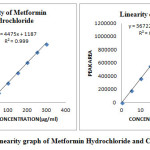 |
Figure 26: Linearity graph of Metformin Hydrochloride and Canagliflozin Click here to View figure |
Conclusion
RP-HPLC method for the simultaneous estimation of Metformin Hydrochloride and Canagliflozin in their combine dosage form was established and validated as per the ICH guidelines. Linearity was achieved for Metformin Hydrochloride and Canagliflozin in the range of 50-300µg/ml for Metformin Hydrochloride and 5-30µg/ml for Canagliflozin with correlation coefficients (r2=0.999). The percentage recoveries of Metformin Hydrochloride and Canagliflozin were achieved in the range of 98-102% which was within the acceptance criteria. The percentage RSD was NMT 2 % which proved the precision of the developed method. The developed method is simple, sensitive, rapid, linear, precise, rugged, accurate, specific, and robust. The forced degradation studies were performed by using HCl, NaOH, H2O2, thermal, UV radiation and water. Metformin Hydrochloride and Canagliflozin are more sensitive towards oxidative degradation condition and moderate degradation towards acidic, alkaline and very much resistant towards thermal, photolytic and water degradations which was shown in (Table 15). No interference from any components of pharmaceutical dosage form or degradation products was observed and the method has been successfully used to perform long term and accelerated stability studies of Metformin Hydrochloride and Canagliflozin formulations. Hence it can be used for the hyphenated instrumental analysis of Metformin Hydrochloride and Canagliflozin in their bulk and combine dosage form.
Acknowledgement
The authors are thankful to Malla Reddy College of Pharmacy for providing the chemicals and instruments and Rantus Pharma Pvt. Ltd., Hyderabad, India and Manus Aktteva Biopharma Ltd., Ahmedabad, Gujarat for providing the drug samples for research.
References
- Bailey, C.J.; Turner, R.C. N Engl J Med., 1996, 334, 574-579.
- 2.Kim, Y.D.; Park, K.G.; Lee, Y.S.; Park, Y.Y.; Kim, D.K.; Nedumaran, B.; Jang, W.G.; Cho, W.J.; Ha, J.; Lee, I.K.; Lee, C.H.; Choi, H.S. Diabetes, 2008, 57, 306-314.
- Viollet, B.; Guigas, B.; Sanz Garcia, N.; Leclerc, J.; Foretz, M.; Andreelli, F. Clin Sci., 2012, 122, 253-270.
- Edward Chao, C. Drugs of the Future, 2011, 36, 351–357.
- Chellu, S. N.; Malleswara, R.;Mulukutla Suryanarayana, V.; Mukkanti, K. Sci Pharm., 2012, 80, 139–152.
- Valentina, P.; Simone, G.S.; Eunice, K.K.; Eunice Emiko, K.; Yara, P. A.; Kazuo, F.; Cristina Helena dos, R. S. Journal of Pharmaceutical and Biomedical Analysis, 2008, 46, 143–147.
- Kar, M.; Choudhury, P.K. Indian J Pharm Sci., 2009, 71,318-320.
- Bhamare, P.C.; Bari, S.B.; Natarajan, S.; Patil, A.A.; Patil, S.H.; Shirode, P.T. Asian Journal of Biochemical and Pharmaceutical Research, 2011, 1, 115-128.
- Rashmi Ranjan, S.; Satya Narayana, P.; Susanta Kumar, P.; Kanhu Charana, S. International Journal of Pharmaceutical & Biological Archives, 2011, 2, 1137-1145.
- Ramzia El-Bagary, I.; Ehab Elkady, F.; Bassam Ayoub, M. International journal of Biomedical science, 2011, 7, 62-69.
- Sheela, N.R.; Muthu, S.; Sampath, S.K. Asian Journal of Chemistry, 2010, 22, 5049-5056.
- Habib, I.H.I.; Kamel, M. S. Talanta, 2003, 60, 185-190.
- Gadape, H.H.; Parikh, K.S. E-Journal of Chemistry, 2011, 8, 767-781.
- Muzaffar, I.; Essam, E.; Khalid Al-Rashood, A.; Yousif Asiri, A.; Naser Rezk, L. Talanta, 2015, 132, 29-36.
- Edward, P.C.L.; Feng, S.Y. Journal of Chromatography B, 2006, 843, 94–99.
- Devineni, D.; Curtin, C.R.; Ariyawansa, J.; Weiner, S.; Stieltjes, H.; Vaccaro, N.; Shalayda, K.; Murphy, J.; Di Prospero, N.A.; Wajs, E. J Bioequiv., 2014, 6, 164-173.
- Shabir, G. A. J Chromatogr A. 2003, 987, 57–66.


![]()


