Thermal Decomposition Study on Solid Complexes of 7-[2-(Benzimidazolyl)azo]-8-hydroxy quinoline with Co(III), Ni(II) and Cu(II)
Department of Chemistry, College of Education, University of Al-Qadisiyah, Post Box 88,
Diwaniya, Iraq
*Author Correspondence E-mail :hasanchem70@gmail.com
DOI : http://dx.doi.org/10.13005/ojc/310223
Download this article as:
![]()
Synthesis and spectral identification of a new azo ligand7-[2-(Benzimidazolyl)azo]-8-Hydroxy quinoline (BIAHQ) is by using IR, UV-Vis, 1H-NMR and mass spectra .The synthesis of metal complexes of this ligand was characterized IR, UV-Vis radiation spectrum beside elemental analysis. The analytical data shows that the metal to ligand ratio [M:L] are 1:2. The thermal decomposition of Co(III),Ni(II) and Cu(II) complexes is studied in argon atmosphere. All complexes do not contain coordinated water molecules but Co(III) and Ni(II) contain one water molecule of crystallization. The water molecules are removed in a single step. The activation thermodynamic parameters, such as energy of activation, enthalpy, entropy and free energy change of the complexes are evaluated and the stabilities of the thermal decomposition of the complexes are discussed.
KEYWORDS:Benzimidazolyl azo; chalet complexes; thermal analysis
Introduction
Chemists, in recent years, have shown a growing concern in studying complexes formed by imidazole, benzimidazole and other related ligands as these are common components of more important molecules.
Benzimidazole is a fused aromatic imidazole ring system where a benzene ring is fused to the 4 and 5 positions of an imidazole ring. Benzimidazole is also known as 1, 3-benzodiazoles(1).
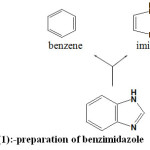 |
Scheme1:-preparation of benzimidazole Click here to View scheme |
They possess both acidic and basic characteristics. The NH group present in benzimidazole is relatively strongly acidic and also weakly basic. Another characteristic of benzimidazole is that they have the capacity to form salts(2).
Benzimidazole with unsubstituted NH groups, exhibit fast prototrophic tautomer’s which leads to equilibrium mixtures of asymmetrically substituted compounds. The benzimidazole scaffold is a useful structural modification for the development of molecules of pharmaceutical or biological interest(3,4).
Thermal stability it is known of that specific heat degree dissolves then starts the chemical compound, accompanied by liberation of volatile products, or that the maximum degree of Heat exposure of the boat occurs without significant changes in an atmosphere of nitrogen or oxygen(5,6). The thermal stability either as a function of the temperature known as Dynamic Thermal Stability, or certified the temperature of the thermal stability known as Isothermal, or as a function of time is known as Quasi -static thermal stability(7).
The thermal stability is the most important thermal characteristics by which they can see the possible use of the complexes in applied fields where their materials to exposed high temperatures. These factors affect many factors of the thermal stability of the complexes as factors synthetic linked to the chemical composition such as groups, side branching, compensators and molecular weight and content aromatic .Also factors machinegun average heating the oven and carrier model and the sensitivity of recording devices and the nature of the installation of carrier model (8,9). View of the owned the ligand being considered the stability of high so it we decided to study the thermal stability of the ligand with its complexes.
Experimental
All chemicals and solvents are of the highest purity from commercial suppliers such as Merck,BDH, Fluka and Aldrich.All chemicals are used without further purification. Mass Spectrum of ligand was obtained using Agilent Technologies 5975 Cat 70e and MSD energy using a direct insertion probe (Acq method low energy) at temperature 90-110 oC (Tarbbiat Modars University Iran).(1H-NMR) of ligand was recorded using NMR-unter Bruker 250Mhz Spectrometer with CDCl3 as solvent (Tarbbiat Modars University Iran). TGA and DSC analysis (England-model pL-TG) (Tarbbiat Modars University Iran). Elemental analysis (C.H.N) was performed on a Euro EA 1106 elemental analyzer (Babylon University Iraq). FT-IR spectra of the ligand as well as the complexes are recorded as KBr discs in the range (400-4000) cm-1on a FT-IR Test scan Shimaduz model 8400S(University of Al-Qadisiyah-Iraq). Electronic spectra of the ligand and its complexes in absolute ethanol at 25oC using 1cm quartz cell are recorded on a UV-vis spectrophotometer Shimaduz model 1650 pc. Melting point apparatus melting point\ SMP, Stuart. pH measurements are carried out using philips pw 9421 pH meter( pH±0.001).
Synthesis of Azo Dye Ligand
The heterocyclic azo dye ligand (BIAHQ) has been synthesized by the diazotization coupling reaction by using shibata method(10)with some modification. The ligandwas earlier studied (11). The structure of ligand was confirmed by IR,1H-NMR,Mass spectrum and C.H.N analysis(11).
![Scheme (2):-Synthesis of azo dye ligand 7-[2-(Benzimidazolyl)azo] 8-Hydroxy Quinoline (BIAHQ)](https://www.orientjchem.org/wp-content/uploads/2015/06/Vol31_No2_Ther_HASS_Sch2-150x150.jpg) |
Scheme2:-Synthesis of azo dye ligand 7-[2-(Benzimidazolyl)azo] 8-Hydroxy Quinoline (BIAHQ)
|
Synthesis of Complexes
The metal complexes of BIAHQ were synthesized by adding 0.289 g (0.002 mol) of ligand dissolved in 50 ml of absolute ethanol gradually with stirring a stoichiometric amount of [1:2] M:L molar ratio for 0.001 mol of metal chloride (II), dissolved in 20 ml buffer solution (ammonium acetate) for each metal ions, the reaction mixture heated for 50-60 oC at 30-40 min, until solid complexes were precipitated then left over night, the solid products formed were filtered off, washed with distilled water until the solution become colorless and washed with 5 ml ethanol to remove traces of the unreacted materials and returned crystallized.
Results and Discussion
Metal: Ligand Ratio
For the purpose of finding possible structural formula of synthesized complexes, molar ratio method was performed at λmax .It has been found that the color of solutions became more intense up to approach of point intersection ratio [M:L] and color stay constant at passing this point which indicates that the complex formed in constant solution(12-15).A 1 : 2 [M:L] molar ratio is suggested for the formation of complexes [M (BIAHQ)2] where: M = Co(III), Ni(II) and Cu(II). The physical properties and elemental analysis are in agreement with this formulae as summarized in Table1.
Table 1: Some physical properties and elemental analysis (C.H.N) for ligand ( BIAHQ) and its complexes
| Compound pH m.p Color m.f Found( Calc.)(%)
(oC) (m.wt) ______________________________ C H N |
|
L=BIAHQ 6 238 Dark red C16H11N5O 66.51 3.71 24.31 (289.26) ( 66.45) (3.83) (24.21) 20.25 [Co(L)2]Cl.H2O 6.5 262 Brown C32H22N10O3ClCo 55.56 3.20 (689.05) (55.78 ) (3.21) (20.32) [Ni(L2)].H2O 7.5 271 Violet C32H22N10O3Ni 58.80 3.43 21.21 (653.27) (58.83) (3.39) (21.14) [Cu(L2)] 6.5 269 Dark brown C32H20N10O2Cu 60.20 3.09 21.23 (640.12) (60.04) (3.14) (21.18) |
The proton nuclear magnetic resonance spectrum for the ligand was carried out using CDCl3 as a solvent and the following peaks were detected (16,17,18)Fig.1.
NH group of benzimidazole to 2. 5 ppm = δ 1-single peak at
- single peak at δ=3.5ppm to H3,H5 and H6 proton of hydroxyl quinoline ring .
- Dblat peak at δ=3.5-3.7 ppm to H8 proton of hydroxyl quinoline ring.
- single peak at δ=3.80 ppm to H2 proton of hydroxyl quinoline ring .
- single peak at δ=6.90-6.93 ppm to H4 and H7 proton of benzimidazole ring .
- single peak at δ=7.23-7.64 ppm to H5 and H6 proton of benzimidazole ring.
- single peak at δ=10.104 ppm to OH group of hydroxyl quinoline ring .
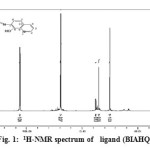 |
Figure1: 1H-NMR spectrum of ligand (BIAHQ) |
Mass Spectrum of Azo Dye Ligand
The mass fragmentation of free azo of dye ligand is shown in Fig.2 .The base peak at m/z=289.2 is corresponding to the original molecular weight of ligand 289.26 with relative abundance 13.63% under investigation. The molecular ion of ligand with high stability shows the clear peak at 260.2 with relative abundance 100% is this emphasis on the health of the molecular structure of the synthesized ligand.This ligand takes the route to the mass fragmentation.
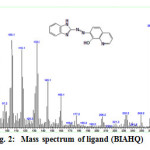 |
Figure2: Mass spectrum of ligand (BIAHQ)
|
The infrared spectroscopic data of azo dye ligand and its complexes are summarized in Table 2 .The comparison between spectra of ligand with the coordination metal complexes have revealed certain characteristic differences of some of these main shifts along with conclusion are given below:-
1-The spectrum of free ligand shows a broad and weak absorption band at 3380cm-1 due to υ(OH).This suggests strong inter molecular hydrogen bonding(19,20).The spectrum of Co(III) and Ni(II)–complexes show a broad and weak bands at 3301 cm-1 and 3420 cm-1 which due to the coordination of water molecule(21) .
2-Two weak bands have been observed at 2661 cm-1and 3047cm-1in the spectrum of the free ligand
due to υ(C-H) aromatic and aliphatic respectively(22).These bands are stable in position as well as in intensity for both ligand and metal complexes.
3-The free ligand shows a medium band at 1573 cm-1 due to υ(C-O) of 8-hydroxy quinoline(21).This
band shifting at 1635 cm-1,1573 cm-1 and 1581cm-1 of Co(III),Ni(II),Cu(II) respectively, producing another evidence about involvement of 8-hydroxy quinoline in coordination with metal ion via oxygen atom of OH group(20-22).
4-The υ(C=N) of benzimidazole 8-hydroxy quinoline in ligand shows two absorption bands at 1580 cm-1and at 1504 cm-1 recpetively.In the spectra of metal complexes ,these bands shifted to a lower frequencies with a little change in the shape. These differences suggest a linkage of M- ion with nitrogen of hetero cyclic benzimidazole ring(20,21).
5-The spectrum of ligand shows two absorption bands at 1411cm-1 and 1473 cm-1 due to azo group υ(N=N).The position of these bands in the spectrum of metal complex is shifted to a lower frequencies with decreased in intensity. This may indicates that it has been effected on coordination with metal ion(22).
6-New weak bands at 601-501)cm-1 in the spectra of the metal complexes may be due to υ(M-O) and (M-N) respectively(23-26). Infrared spectra data leads to suggest that the ligand behaves as a tridentate chelating ligand coordination through the phenolic oxygen, nitrogen atom of azo group which is the nearest 8-hydroxy quinoline ring and N3 of benzimidazole ring to give two five membered chelate ring.
Table 2: Selected IR bands of ligand (BIAHQ) and its metal complexes in cm-1 .
| Compound υ (O-H) υ(NـH) υ(C-O) υ(C═N) υ (N═N) υ(C=C) u(C–N=N–C) υ(C-N) υ (M─O) υ(M-N)imidazole imidazolehydroxyl υ(C-N)quinol |
|
L=BIAHQ 3380 3170 1573 m. 1620 m. 1473 m. 1380 s. 1288 s.br. 1226 s. ___ ___ w.br m.br 1504 s. 1411 s. 779 s. [Co(L)2]Cl.H2O 3301 3240 1635m. 1604 w. 1465 s. 1373 s. 1280 s. 1242 w. 570 w. 509 w. m.br m.br 1573 s. 1419 m. 1110 s. [Ni(L)2].H2O 3209 3062 1573 s. 1604 w. 1465 s. 1373 s 1326 s. 1280 m. 570w. 447w. m.br m.br 1504 s. 1420 m. 1110 s. Cu(L)2] ____ 3379 1581 s. 1596 m. 1473 s. 1373 s. 1327 s. 1281 m. 632 w. 517w. s.br 1505 s. 1419 w. 1111 s. |
w=weak; s=strong; m=medium; vs=very strong; br=broad
Electronic Spectra
The electronic spectra of azo dye ligand and its metal complexes are studied in absolute ethanol as a solvent, the assignments are given in Table 3. The free ligand spectrum gives three absorption bands were detected first band located at 517 nm (19342 cm-1) for n→p* transition of the azo group (-N=N-), this band shows a red shift on coordination with a metal ions around range at (557-560) nm(27). The second band observed at 310 nm (32258 cm-1) due to p→p* transition to the C=C group in heterocyclic benzimidazole and hydroxyl quinoline rings(28) while the third band at 241 nm (41494 cm-1) for n→σ*transition to the C=N group in the ligand structure(29).
Cobalt(III)-complex
The electronic spectrum of Co(III)-complex was studied in 10-4M ethanolic solution shows two absorption bands at 560 nm (17857 cm-1) and 374 nm (26739 cm-1) these are assigned to 1A1g→1T1g (υ1) and 1A1g→1T2g (υ2)transition respectively .This correspond to three unpaired electrons which may suggest low spin a regular octahedral structure and hybridization d2sp3 (30).
Nickel (II)-complex
The electronic spectrum of Ni(II)-complex show two absorption bands in (10-4M) ethanolic solution at 558 nm (17921 cm-1) and 367 nm (27247 cm-1) ,which suggesting the existence of 3A2g→3T2g (F)υ)1) , 3A2g→3T1g (F)υ)2( and 3A2g→ 3T1g (p) υ)3) transition respectively. Because of presence two unpaired electrons which may suggest high spin a regular octahedral geometry and hybridization sp3d2 (31).
Copper(II)-complex
The electronic spectrum of Cu(II)-complex shows one broad band around at 557 nm (17953 cm-1) in (10-4M) ethanolic solution due to 2Eg→2T2g transition due to one unpaired which may suggest an distorted octahedral structure (Z-out or Z-in) and hybridization sp3d2 (32).
The electronic Spectrum of ligand and its metal complexes shows in Figs.3-6
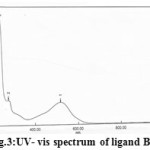 |
Figure3: UV- vis spectrum of ligand BIAHQ |
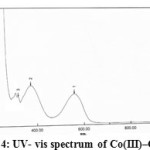 |
Figure4: UV- vis spectrum of Co(III)–Complex |
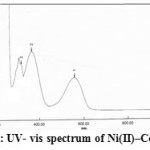 |
Figure5: UV- vis spectrum of Ni(II)–Complex |
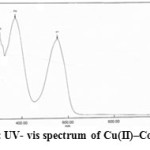 |
Figure6: UV- vis spectrum of Cu(II)–Complex |
Table 3: Electronic spectra, geometry and hybridization of the ligand (BIAHQ) and its M(II)-complex
|
Compound |
λmax nm | Absorption bands (cm-1) | Transition | Geometry | Hybridization |
|
L=BIAHQ
|
517 |
19342 |
n→p* | ______ |
___
|
| 310 | 32258 | p→p* | |||
| 241 |
41494 |
n →σ* | |||
|
[Co(L)2]Cl.H2O |
560 |
17857 |
1A1g→1T1g (υ1) | Octahedral | d2sp3 |
|
374 |
26739 |
1A1g→1T2g (υ2) | |||
|
[Ni(L)2].H2O |
558 |
17921 |
3A1g→3T1g(F)υ)1( | Octahedral | sp3d2 |
| 308 |
32467 |
3A2g→ 3T1g (p) υ)3) | |||
|
[Cu(L)2] |
557 |
17953
|
2Eg→2T2g | Octahedral(distorted) | sp3d2 |
Thermo analytical Study:
The thermo gravimetric analysis(TGA) and the differential scanning calorimetric (DSC) curves for the ligand and its metal complexes are presented in Figs.7-10. Thermal analytical results of BIAHQ and its complexes are given in Table 4 .
The TGA curve reveals the ligand of the formula C16H11N5O decompose in two steps shown in Fig.7, in the temperature range 100-536oC.In the first step, which is rapid, ligand losses benzimidazole group by breakage of (C-N) bound around 100-186 oC with an estimated mass loss 41.04% (calcd. mass loss 40.56%). In this step of decomposition, DSC curve shows endothermic peak at180 oC .
In second step effected and intermediate then decomposes exothermally in temperature rang 186-536oC , liberating the gases with an estimated mass 2.21% (calcd. mass loss 2.07%).
The (TGA) curve of complex have the formula[CoC32H20N10O2]Cl.H2O shown in Fig.8 .It decompose in 2 steps in the temperature range 100-420 oC, the first step involves loss one of H2O and one of HCl molecules around 100-148 oC with an estimated mass loss 8.11% (calcd. mass loss7.90%) ,the second step involves loss one molecule of ligand around 148-420 oC with an estimated mass loss 52.12% (calcd. mass loss 52.70%) the residue left in the crucible consist of corresponding CoO.
Fig.9 illustrates the thermal analyses curves of the Ni(II) complex with the general formula [Ni(C16H10N5O)2].H2O that decompose in 2 steps in the temperature range 90-562 oC, The first estimated mass loss of 2.65% (calcd. mass loss 2.75%) may be due to the thermal dehydration of the complex in the temperature range 90-390 oC. In the second step within the temperature range 390-562 oC ,the organic part of the anhydrous complex decomposed with an estimated mass loss of 44.30% (calcd. mass loss 44.11%).One successive exothermic peak appear be at 330 oC as shown in the DSC may be attributed to the decomposition of one BIAHQ molecule.
Cu(II) complex of the formula [Cu(C16H10N5O)2] exhibits two distinct decomposition steps, as shown in Fig. 10. In the temperature rang 110-423oC,the first step , in the temperature rang 110-137oC with an estimated mass loss of 11.05% (calcd. mass loss 10.33%) may be attributed to the liberation of C7H5N2 molecule. In the second step, DSC curve reveals an exothermic peak at 320 oC followed by one successive endothermic peak at 380 oC.This may be accounted to the vigorous decomposition of BIAHQ molecule leaving CuO as a metallic residue.
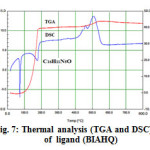 |
Figure7: Thermal analysis (TGA and DSC) of ligand (BIAHQ) |
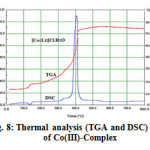 |
Figure8: Thermal analysis (TGA and DSC) of Co(III)-Complex |
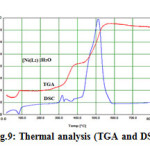 |
Figure9: Thermal analysis (TGA and DSC) of Ni(II)-Complex |
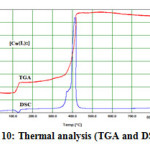 |
Figure10: Thermal analysis (TGA and DSC) of Cu(II)-Complex |
Table4: Thermal analytical results (TGA , DSC) of ligand ( BIAHQ) and its M(II)-Complexes
|
DSC
|
Assignment |
Estim(calc%)
|
TGA rang oC
|
Compounds |
||||
|
Td oC |
Tm oC |
Tc oC |
Tg oC |
Peak |
Mass loss
|
|||
|
510 |
420 |
85 |
75 |
180(+)
|
Loss benzimidazol group LiberationCH4,N2O gases |
41.04 )40.56) 2.21 (2.07) |
100-186 186-536 |
C16H11N5O |
|
410 |
330 |
130 |
110 |
—— |
Loss H2O and HCl Loss one ligand molecule and formation CoO |
8.11 (7.90) 52.12 ( 52.70) |
100-148 148-420 |
[Co(C16H10N5O)2]Cl.H2O |
|
520 |
390 |
90 |
80
|
330(-) |
Loss H2O Loss one ligand molecule |
2.65 (2.75) 44.30 (44.11) |
90-390 390-562 |
[Ni(C16H10N5O)2] .H2O |
|
420 |
380 |
132 |
100 |
320(-) 380(+) |
Loss C7H5N2 Loss one ligand molecule and formation CuO |
11.05 (10.33) 57..62 ( 57.44) |
110-137 137- 423
|
[Cu(C16H10N5O)2] |
Tg= glass transition temperature, Tc=degree of crystallization, Tm= melting point, Td= decomposition Temperature
Kinetic Analysis
The first stage of dehydration of the ligand and its complexes are studied in details .The kinetic parameters such as activation energy (∆E*),enthalpy(∆H*), entropy(∆S*), and free energy change of the decomposition (∆G*)are evaluated graphically by employing the Coast-Redefern relation(33) : as the equations(1-4). relation :
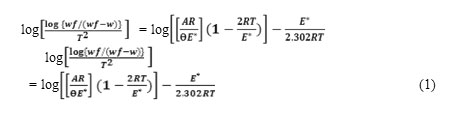
where Wf is the mass loss at the completion of the reaction, W is the mass loss up to temperature T,R is the gas constant the activation energy in KJmol-1,Ɵ is the heating rate and (1-2RT∕ E*)≈1.
 |
Table 4 B |
A plot of the left-hand side of Eq.1 against reciprocal T gives a straight line and slope from which energy of activation was calculated .Arrhenius constant(A) was determined from the intercept. The entropy of activation ,enthalpy of activation and the change of free energy change of activation were calculated using the |following relations:
∆S* =2.303[log(Ah∕ kT)]R (2)
∆H* =E*-RT (3)
∆G*=H*-TS* (4)
Where k and h are Boltizman and Blanck constants, respectively. The calculated values of E*, A ∆S*,∆H*,and ∆G* for the decomposition steps are listed in the Table 5.
Table5: Thermodynamic data of the thermal decomposition
| Complexes | Decom.range(oC) | E*KJ mol-1 | A(S-1) | ∆S*JK-1 mol-1 | ∆H* KJ mol-1 | ∆G*KJ mol-1 |
| L=BIAHQ | 100-186186-536 | 20.34 20.70 | 1.29×10163.6×107 | 73.85 101.6 | 19.71 17.79 | 13.35-17.77 |
| [Co(L)2]Cl.H2O | 100-148 148-420 | 19.7323.12 | 1.72X10³ 7.54×10⁸ | -167.874.30 | 19.3322.72 | 27.382.287
|
| [Ni (L)2].H2O | 90-390390-562 | 23.5719.62 | 3.54X1085.77X109 | -81.15-53.48 | 21.0018.18 | 45.3427.37 |
| [Cu (L)2] | 112-137 137-423 | 11.18 21.09 | 1.06X10³ 2.40X10¹⁶ | -166.4-78.36 | 10.9720.31 | 15.1313.02 |
Conclusions
In this work we report the preparation and identification, of heterocyclic azo ligand derived from imidazole and its complexes with Co(III), Ni(II) and Cu(II) ions. The ligand characterized solid metal complexes are stable in air and moisture, and high melting point gives further proof of the stability of complexes. The complexes Co(III) and Ni(II) possessing octahedral geometry while Cu(II) distorted octahedral geometry. By(TGA and DCS),the available experimental data suggest that the prepared complexes of different metals as well as ligand decompose in a two steps process.
The activation thermodynamic parameters, such as energy of activation, enthalpy, entropy and free energy change of the complexes are evaluated and the stabilities of the thermal decomposition of the complexes are discussed.
References
- Sugumaran M , Yokesh Kumar M , Int. J. Pharm. Sci. Dru. Res. , 2012, 1, 80-83
- Ingle R G , Magar D D , Int. J. Dru. Res. Tech. , 2011, 1, 26-32
- Arjmand F, Mohani B , Ahmad S , Eur. J. Med. Chem., 2005, 11, 1103-1110
- Amrallah A H, Abbdalla N A ,El-Haty E Y , J. Chem. Soc. , 2006, 53, 697-706
- Wendlandt W W M “Thermal Method of Analysis “2ndEd.John Wiley and Sons, N,NY. Londan ,1974
- Jovanović J D , Knežević-Stevanović A B, Grozdanić D K, J. Serb. Chem. Soc., 2011, 76, 417
- Gerloch M , Constable E C ,VCH Verlagsgeselk chaft mbH, Weinheimpp, 1994,143-148
- Arshad M , Rehman S , Hussain A Q , Masud K , Arif M , Saeed A, Ahmed R , Turk. J. Chem., 2008 ,32, 593-604
- Eder C T G ,Francisco L C D, Schpector Z J , Dockal E R ,Therm. chim. Acta, 2001, 370, 129- 133
- Shibata S , Furukawa M , Nakashima R , Anal. Chim. Acta , 1967,81,131
- Habeeb H A , Al-Adilee K J , Jaber Suadad A , J. Chem. Mater. Res., 2014 ,8, 69-80
- Singh D P , Grover V , Kumar K. Jain K , J. Serb. Chem. Soc., 2011,76, 385
- Al-Adilee K J, Abed Al-Rrazaq K A , Al-Hamdiny Z M , Asi. J.Chem., 2013, 25,10475-10481
- Geronikaki A , Theophilidis G , Eur. J. Med. Chem. , 1992 , 27, 1-9
- Al-adely K J , Mussa Y O , Nat. J. Chem., 2009,33,104-113
- Byabartta P, Laguna M , Ind. J. Chem., 2007,46 ,937
- Zamani K , Mobinikhaledi A , Foroughifar N, Faghihi k , Mahdavi V, Turk. J. Chem., 2003, 27, 71-75
- Pal S , Sinha C, J. In. Acad. Sci. , 2001,3,173
- Field L D, Sternhell S, Kalman J R ,”Organic Structures from Spectra” 4thEd. John Wiley and Sons, Ltd. 2008
- Sharma A , Mehta T, Shah K M, Der. Chem. Sin. , 2013,4,141-146
- Watanabe1 I, Sakanishi K , Mochida1 I ,Yoshimoto M , Fuel Chem. Div Prep., 2003 , 8 , 9594-
- Mehdi R T , Ali A M , Nat. J. Chem., 2005, 20,540-546
- Karipcin F , Kabalcilar E , Acta. Chem. Slov. , 2007, 54, 242-247
- AL-adely K J, Dakhil H K , Karam F F , J. Al-Qad. pur. sci., 2011, 2, 50-64
- Drozdzewski P M , Spectro. Chim. Acta , 1988, 44A, 1297
- Pavia D L , Lampman M , Kriz George S , “Introduction to pectroscopy “3rd Ed, Brooks/ Cole Thomson Learning 2001
- Shimanouchi T, Nakagawa I , Spectro. Chim. Acta , 1962 ,18, 89
- Misra K , Das T D , Sinha C , Ghosh P, Pal C K , Inorg. Chem., 1998 , 37, 1672-1678
- Jarad A J , ph. D. Thesis, Baghdad Univ. 2007
- Nicholas D ,Pergamon Texts in Inorganic Chemistry , Pergamon Press Oxford, 1st Ed.,1973
- Lee J D, ” Concise Inorganic Chemistry ” 5thEd. ,2007
- AL-Adilee J K , New J. Chem., 2007, 28,585
- Coast A W , Reffern J P , Nature. , 1964 , 201, 64


![]()


