Theoretical and Experimental Investigation of Quantum Confinement Effect on the Blue Shift in Semiconductor Quantum Dots
2Department of Physics, Amirkabir University of Tchnology, Tehran, Iran
3Department of Mechanical Eng, Ardabil branch, Islamic Azad University, Ardabil, Iran
DOI : http://dx.doi.org/10.13005/ojc/310234
Download this article as:
![]()
Nano particles of zinc sulfide (ZnS) of face centered cubic (fcc) structures were synthesized using sulphur source of soium sulphide and mercaptoethanol respectively via Chemical Bath Deposition method. The synthesized quantum dots were characterized using X-ray diffraction (XRD), transmission electron microscopy (TEM) and UV-visible spectrophotometry. The average crystallite size calculated from TEM and XRD pattern has been found to in the range 4.6 – 1.9 nm, the pariticles size decreases with the increase of the capping agent concentrations from 0. 001 to 0.7 Mol. The absorption coefficient in the range 325 - 250 nm decreases with increasing capping agent and the particles. ZnS nanoparticles were also derived from time independent Schrodinger equations for ZnS system and calculated the coefficient absorption using the density functional theory (DFT) . It is shown that decreasing of ZnS nanosize lead to changes the optical properties and coefficient absorption in the visible region does not occur and the particles act like a transparent material. In this work, the blue shift was observed in absorption-wavelength both theoretical and experimental method due to the quantum confinement effects.
KEYWORDS:Density functional theory; Blue shift; Absorption coefficient; Dielectric properties; Quantum dots
Introduction
Nanomaterials have attracted many interests and attention due to their special characteristics that differ from those of bulk solids and molecules. Because the novel properties of nanomaterials depend on their size, structure and shape, an understanding of their mechanism as well as a new direction for synthetic methods are significant issues in Nano science and nanotechnology (White. 2009). As a result of the high surface-to-volume ratio of the nanoparticles, the surface properties have significant effects on their structure (Hullavarad. 2008). In recent years, semiconductor nanoparticles exhibit specific properties due to the quantum confinement effects. As a consequence of their size in the Nano metric range and the special luminescent properties, a widening of the band gap is caused when the spatial dimension is reduced (Brus. 1986). In semiconductors, the quantum confinement modulates the band structure of the nanoparticles, and hence, many propertiescan be tuned by changing the nanoparticles size. A typical semiconductor nano crystal with 1–10 nm diameters consists of about 100– 10000 atoms. These small colloidal Nano crystals as promising advanced functional materials can be found in many different applications, ranging from lasers, flat panel displays, infrared windows, sensors ( Achermann. 2004 )light-emitting diodes (LEDs), solar cells, transistors and biological systems (Huynh and Cheah 2002 ). Among the nano material the ZnS nano particle is of more importance in industry because of its ability to produce the white color. The first important subject of making this material is its optical properties. Among those properties we can mention to refractive index, absorption coefficient, reflectivity, dielectric constant, optical conductivity coefficient and other parameters. As a matter of fact all of these properties are related to each other; therefore determining one parameter is equal to finding the others. In this work, the density functional theory (DFT) have been studied absorption coefficient ZnS nanoparticles and compared with their bulk counterparts and experimental result.
Material and Methods
Zinc chloride (ZnCl2) and sodium sulfide (Na2S) are used as Zinc source and Sulphur source respectively. ZnCl2, Na2S and Mercaptoethanol were purchased from Merck ( Specialities Private Ltd) and Qualigens fine chemicals respectively. These are of high purity and used without any future purification. ZnS nanoparticles were synthesized with Chemical Bath Deposition method using mercaptoethanol. Mercaptoethanol (M.E) was used as the capping agent (or surface active agent=surfactant). First 50 ml aqueous solution ZnCl2 (0.01 molar) was prepared with stirring at room temperature. For synthesis 0f ZnS nanoparticles, 50ml aqueous solutions of ME with different concentrations (0.001, 0. 1, 0.7 M) were added drop by drop to the first solution with stirring. Then 50 ml of Na2S (0.01 molar) solution added to the mixture. A three neck reaction flask were used under N2 inert gas to prevent any oxidation effect. While reaction was going on, a magnetic stirrer was used for continuous stirring of solution in the reaction vessel .The final solution was centrifuged and washed several times with double distilled water so that NaCl another solvable impurities will be washed perfectly. The remaining centrifuged ZnS will be dried under table lamp or at ordinary temperature and obtained powder can be prepared for XRD, TEM, and UV-visible absorption and etc.
Results and Discussion
XRD and TEM Measurements
The X-ray diffraction studies were carried out for the powder samples and typical diffractograms for the four samples are shown in Fig (1). It is observed three diffraction peaks (2θ) of 29.3, 48 and 56.9 degree, respectively. The peaks were identified to originate from (111), (220) and (311) planes of the cubic (zinc blend) phase of ZnS. The broadening of the diffraction peaks indicates the Nano crystalline nature of the sample. The peak broadening at lower angle was more meaningful for the calculation of particle size. The mean crystallite size (D) of nanoparticles was also estimated using the Debye-Scherrer relation (Kaelble. 1967) along (111) reflection from the XRD pattern as follow.
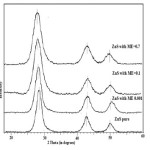 |
Figure1: X-Ray diffractograms of ZnS nanoparticles for various Concentrations of capping agent. Click here to View figure |
D = Kλ /β CosΦ where D is the mean crystalline size, K is the geometric factor (0.9), λ is the X-ray wavelength (1.54056 Å for Cu-Ka), ß is the full width at half maximum (FWHM) of the diffraction peak and θ is the Bragg diffraction angle. The estimated average sizes were 4.65nm (ZnS with ME=0.001), 3.0 nm (ZnS with ME=0. 1), 2.10 nm (ZnS with ME=0.7) respectively. It is also found that when the increase of M.E cause to decreases of the crystalline size (Table1).
The nanostructure observed from TEM (Model JEOL JEM-100cx) is shown in fig (2). The size of the Nano crystalline shown to be spherical in shape and size of the crystal increases with decreasing of Concentrations of capping agent (ME), which were in agreement with the result obtained from XRD observation. The mean particle size estimated from the particle size histograms was 1.8 and 2.8 and 4.6 nm respectively. These values were in good agreement with the TEM measurement. It indicates that the size of crystallites can be adjusted by controlling the capping agent (Vatankhah .2009).
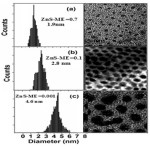 |
Figure2: TEM images and size distribution analyses of ZnS anocrystals after synthesis (a) ZnS – ME=0. 7 M (b) ZnS- ME=0. 1M (c) ZnS-ME=0.7M Click here to View figure |
Absorption Spectroscopy
Fig (3) shows the absorption spectra of the ZnS nanoparticles synthesized with the different concentration of Mercaptoethanol increasing from 0.001 through 0.1 to 0.7 Mol. The optical absorption spectra of nanoparticles were measured using a (UV-visible Perkin Elmer Lambda) spectrophotometer. The first peak in the absorption spectrum shift to lower wavelength from 325(bulk) through 305, 280 to 265nm (nanoparticles), and the optical properties were strongly depend on the particle size. The absorbance between 325 to 265 nm decreases with increasing capping agent concentration, which indicate that the higher the capping agent concentration, the smaller the size of ZnS nanoparticles obtained. The optical absorption spectra of the samples obtained using UV-VIS spectrophotometer shows the blue-shift with decreasing particle size.
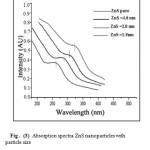 |
Figure3: Absorption spectra ZnS nanoparticles with particle size
|
The solid-state theory based on the delocalized electron and hole within the confined volume can explain the blue shift of absorption edge compared to bulk ZnS optical absorption spectra.The optical band gap of the Nano samples were calculated from the absorption peak. The gap energies were used for calculation of radius of prepared ZnS nano particles using the Brus equation (Brus.1986).
Where, ∆E = ( Eg – Enp) is the blue shift of the band gap, me*=0.25 me is the effective mass of electron, mh*=0.60me is the effective mass of hole, Eg is the bulk band gap in (ZnS=3.68eV), r is the radius of the particle, εr is the dielectric constant and ε0 is the permittivity of free space. The first term indicates the confinement effect and the second term is the coulomb term. In the present case, the second term is small due to the strong confinement and can be neglected. The band gap values of the particles formed with various concentration of the capping Agent and the particle sizes estimated using the Eq. (1) are given in the Table(1). It is seen from the Table (1) that the sizes obtained from broadening of XRD peak using the Debye- Scherrer relation were found to agree fairly with those estimated from the absorption peaks by using Eq. (1). The value of band gap has been found to increase with decreasing of crystallite size which was blues shifted as compared to the bulk band gap value due to the effect of quantum confinement of nanoparticles.
Table 1. Optical band gap, blue shift and particle Size of the ZnS nanoparticles with various Concentrations of capping agent
| sample | S1 | S2 | S3 | ||
| Concentration (in mmol) | 0.001 | 0.1 | 0.7 | ||
| Band Gap Eg (In eV) | 3.96 | 4.42 | 4.76 | ||
| Absorption peak(nm) | 305 | 280 | 265 | ||
| Blue Shift ∆E(eV) | 0.36 | 0.82 | 1.16 | ||
| Particle Size from(nm) | XRD[1] | 4.65 | 3.00 | 2.10 | |
|
AEM[2]
|
4.56 | 2.92 | 2.30 | ||
| TEM[3] | 4.6 | 2.8 | 1.9 | ||
Density functional theory (DFT) is the most widely used first principles method for the calculation of the structural, electronic and optical properties of solids.At first the optical properties of ZnS was considered. The dielectric function ε(ω) can be used to describe the linear response of the system to electromagnetic radiation, which relates to the interaction of photons with electrons (Jian 2004). The complex nature (real and imaginary) of dielectric function in terms of incident photon frequency ω is:
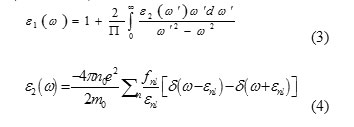
Where,dIm is the electric dipole matrix element, no is the Density of atoms in interaction with light, ω is Frequency of incident light and εmn = εm -εn is Frequency difference between two energy levels. Now the real and imaginary parts of dielectric constant can be obtained in other optical properties such as refractive index n (ω) and absorption coefficient α (ω) are given as follows:
The imaginary part of the dielectric constant is very important to obtain the optical properties. As equation (4) is determined to find the dielectric constant, polarization matrix elements and density of states and energy levels is needed. To determine these parameters, the density functional theory was used. Solving the Kohn-Sham Hamiltonian, special functions and special values of the system were obtained. Using the special functions, density of states and the polarization matrix calculated with these parameters, the dielectric constants and the absorption coefficient and other optical properties are obtained (Babazadeh 2005).
Optical Properties
For determining the optical constant of nanoparticle and bulk of ZnS, at first the Hamiltonian system must be solved, using density function theory (DFT). For this reason, a supercell was built and then a vacuum around its 3 dimensions was made. But it was one problem and it was dangling band issue, which it’s the result of making a vacuum around the nanoparticle. To remove the dangling band, Surface passivation was used (Li J. and Wang 2005). For solving the (kohn-sham) equations the semi-potential software ”PWscf” have been used. The cut wave function energy and the charge density were 30Ry and 140Ry respectively (Babazadeh 2005).Using the relation (5), the absorption coefficients of bulk and nanoparticles of ZnS calculated along [100] direction polarization are shown in Figure 4. It can be seen from the shapes of the absorption curves of ZnS bulk that absorption wavelength for visible light was almost 320 nm, which measured approximately 325 nm and is in good agreement with our experimental results.
 |
Figure4: Absorption spectra of ZnS nanoparticles and ZnS bulk a) ZnS bulk b) nano 1.9 nm c) nano 1.3 nm Click here to View figure |
The curve of absorption spectra of ZnS nanoparticles shows that, the wavelength of the light absorption was shifted toward the blue wavelengths of light with decrease in the size of nanoparticles, this phenomenon is known as the blue shift. It shows that decreasing size of Nano particles, coefficient absorption in the visible region does not occur and the particles act like transparent material .The absorption spectra were blue shifted was in agreement of our experimental results. This behavior is related to size quantization effect due to the small size of the particles. Blue shift is due to the imaginary part of dielectric particles with dimensions smaller particles will shift towards big power. It is the concept of reducing the size of the particles relative to the wavelength of visible transparent acts.This characteristics of nanomaterial makes them useful for various wavelengths production of the electro-optic devices.
Conclusion
The effect of quantum confinement and size on the blue shift of ZnS nanoparticles has been investigated experimentally and theoretically. ZnS nanoparticles were synthesized by the wet chemical method. The size of the quantum dots was determined using XRD and TEM. The absorption spectra of the nanoparticles were characterized by UV and the absorption spectrum blue shift was observed. To confirm the blue shift, the dielectric constant of ZnS particles have been calculated using density functional theory (DFT) and the absorption coefficient of the nanoparticles were obtained. The absorption spectra obtained from theoretical calculations confirmed the Blue shift. Experimental as well as theoretical calculations show that the absorption coefficient and band gap of the particles increases with decreasing the size of the nanoparticles. It’s seen that decreasing size of Nano particles, the absorption in the visible region does not occur and the particles act like a transparent material.
Acknowledgment
The authors would like to thank the Islamic Azad University, Mahshahr branch for support in this research.
References
- White, RJ., R.Luque, VL. Budarin and JH. Clark, DJ. Macquarrie, Chem Soc Rev ., 2009.,38:481– 494
- Hullavarad, NV., Hullavarad,SS. and. Karulkar, PC ..:. J Nanosci Technol., 2008.,8:3272– 3299
- Brus, L.E.. J Phys Chem ., 1986.90:2555–256
- Achermann .M., M. A Pertuska , S. Kos, D. L. Samith, D.D. koleske, and V.I. kimov Nature (London) 2004. 429, 642
- Huynh ,W. U., J. J .Dittmer and Alivisatos ,A. P. , Science 2002.295, 2425
- Klein, D. L., R .Roth, A. K. L. Lim ., Alivisatos, A.P and P. L, McEuen., . Nature (London) 1997.,389, 699
- Cheah, K. W., Xu. Ling, Xinfan. Huang,. Nanotechnology , 2002.,13, 238
- Kaelble, E. F., McGraw–Hill,.Handbook of X-Rays, New York, Usa, 1967
- Vatankhah ,Ch ., M. H .Yousefi, A. A Khosravi , .Eur. Phys. J. Appl. Phys. 2009., 48, 20601
- Jian, Sun., Hui.Tian Wang, Nai.Ben Ming. Julong He, Yongjun Tian, Appl. Phys. Lett . 2004.,84 4544
- Shen ,Y., Z .Zhou,. J. Appl. Phys. 2008., 103.,074113.
- Li, J and Wang.Lin ,. Phys.Rev. B, 2005., 72, 125325
- Babazadeh, A. , k.Tehrani , M. H. Akbarzadeh, 2007. 2nd. Congr. Nanosci. Nanotechnol,University of Kashan, kashan, I.R. Iran.


![]()


