Polyaniline/MnTiO3 Nanocomposites: Fabrication, Characterization and Optical band gap
Khanahmadzadehsalah*1, Enhessari Morteza2, Amniyattalabyasaman1 and Daghayesh Roya1
1Department of Chemistry, Mahabad Branch, Islamic Azad University, PO Box,443, Mahabad, Iran
2Department of Chemistry, Naragh Branch, Islamic Azad University, Naragh,Iran
DOI : http://dx.doi.org/10.13005/ojc/310274
Article Received on :
Article Accepted on :
Article Published : 03 May 2015
Polyaniline-manganesetitanatenanocomposites (NCs) with two contents loading of MnTiO3 were successfully synthesizedvia sol–gel process usingManganese acetyl acetonate, tetra-n-butyltitanate, stearic acid, potassium iodate and sulfuric acid. The prepared PANI/MnTiO3NCs were characterized by energy dispersive X-ray spectroscopy (EDX), scanning electron microscopy (SEM), UV-vis diffused reflectance spectra (DRS), Particle Size Distribution (PSD)and Zeta Potential. The results indicated that MnTiO3NPs with particle size between 22 and 30nm were distributed in PANI matrix. The value of direct band gap for MnTiO3 and the PANI/MnTiO3NCs with 10 and 20wt% of MnTiO3NPs loading using the Tauc model came out to be 1.15 Ev, 1.35 and 1.25. Band gap analysis indicates semiconducting behavior of the NCs.
KEYWORDS:nanocomposite; MnTiO3; Zeta Potential; EDX; PSD; DRS
Download this article as:| Copy the following to cite this article: Khanahmadzadehsalah, Morteza E, Amniyattalabyasaman, Roya D. Polyaniline/MnTiO3Nanocomposites: Fabrication, Characterization and Optical band gap. Orient J Chem 2015;31(2). |
| Copy the following to cite this URL: Khanahmadzadehsalah, Morteza E, Amniyattalabyasaman, Roya D. Polyaniline/MnTiO3Nanocomposites: Fabrication, Characterization and Optical band gap. Orient J Chem 2015;31(2). Available from: http://www.orientjchem.org/?p=8750 |
Introduction
PANI as a typical conducting polymer has recently received a great deal of attention. PANI is one of the most promising electrically conducting polymers due to its unique electrical and electrochemical properties, easy polymerization, high environmental stability and low cost of monomer1-3,and its wide applications in microelectronic devices, diodes, light weight batteries, sensors, super capacitors, microwave absorption, corrosion inhibition4-8, etc.The properties of PANI can be tailored by changing its oxidation states, dopants or through blending it with other organic, polymeric or inorganic nanosized semi conducting particles.To obtain materialswith synergetic advantage between PANI and inorganic NPs, various composites of PANI with inorganic NPs such as CeO2, TiO2, ZrO2, Fe2O3, and Fe3O4 are reported.The titanium-based oxides, such as barium titanate 9, cadmium titanate 10, bismuthtitanate 11, cobalt titanate 12 and lead titanate 13, can be referred to as a‘smart’familyowing to their excellent dielectric, piezoelectric, pyroelectric and photostrictiveproperties.Manganese ion in oxides is a well-known activator used mainly for producing tunablesolid-state laser media, holographic recording and optical data storage as well as thermoluminescentdetectors 14–16.Recently, manganese titanate (MnTiO3) has attracted muchattention for its strong absorption in the visible region which may be propitious to theutilisation of solar energy 17 and photocatalysis 18.Manganese titanate, pyrophanite MnTiO3, is a humidity sensing material with excellent sensitivity, good selectivity, low temperature coefficient near zero and goodstability.The pyrophanite MnTiO3 has also been studied for magnetic and photoelectrochemical properties 19–21.Physical properties (mechanical, thermal, etc.) of polymers can be improved by adding inorganic materials to polymer matrixes. In this study, PANI/MnTiO3NCs with two (10, 20wt%) contents loading of MnTiO3 were prepared,and the whole procedure and structural characterization of PANI/MnTiO3NCs phases have been investigated by SEM, EDX, DRS, and Zeta Potential.
Materials and Methods
Manganeseacetylacetonate, tetra-n-butyltitanate, stearic acid,potassiumiodateandsulfuric acid used in experimentswere all of analytical grade reagents.The composition of the sample was estimated using a model Oxford of Energy dispersive analysis of X-rays (EDX).The UV-vis diffused reflectance spectra (DRS) were obtained from UV-vis Scincom 4100 spectrometer. The SEM pictures were recorded with KYKY Model EM 3200 instrument at the accelerating voltage of 25 kV. Streaming zeta potential measurements were carried outon a ZetaCAD instrument (France).
Synthesis of MnTiO3 Nanoparticles
PANI/MnTiO3composites were prepared along a synthetic procedure. MnTiO3NPs were prepared through a modified wet-chemistry synthesismethod which is described in the literature 22. In this procedure, a fixed amount of manganeseacetylacetonate was added to the melted stearic acid and dissolved. Then, stoichiometric tetra-n-butyltitanate was added to the solution, stirred to form sol, naturally cooled down to room temperature, and was dried to obtain dried gel. Finally, the gel was calcined at 900°C in air to obtain MnTiO3NPs.
Synthesis of PANI/MnTiO3 Nanocomposite
In order to prepare ofPANI/MnTiO3NCs,the essential substances for preparation of PANI were initiallyadded. To prepare PANI, 1g potassium iodate was added to 100 ml of sulfuric acid (1 M) and then uniform solution was resulted by using magnetic mixer. After 30 min, the sufficient amount of ultrasonicated MnTiO3 NPs was added to solution to prepare 10 and 20 persent of PANI/ MnTiO3NCs and after 20 min, 1 ml fresh distilled aniline monomer was added to stirred aqueous solution. The reaction was carried out for 5h at room temperature. Then the obtained product was dried at temperature about 60°C in oven for 24h23.Finally after heat-treatment from 60°C to 300°C for 2h, the PANI/MnTiO3NCs were obtained.The whole procedure and structural characterization of PANI/MnTiO3NCs phases have been investigated by SEM, EDX, PSD, DRS, and Zeta Potential.
Results and Discussion
Drsstudy
The absorption coefficient and optical band gap of a material are two important parameters by which the optical characteristics and its practical applications in various fields are judged.Fig.1. shows the DRS patterns of pure MnTiO3 and the PANI/MnTiO3NCs with 10 and 20wt% of MnTiO3NPs loading. In fig.1a. a sharp absorption peak is observed around 325 nm, which indicates the optical band gap attributed to the O2-→Ti4+ charge-transferinteraction17. Also in the PANI/MnTiO3NCs with 10 and 20wt% of MnTiO3NPs loading a sharp absorption peak are observed around 345 and 350 nm. For direct b and gap determination, plot of versus is presented in Fig . 2. Band gap value was obtained by extrapolating the straight portion of the graph on h axis at =0, as indicated by the solid line in Fig.2.The value of direct band gap for MnTiO3and the PANI/MnTiO3NCs with 10 and 20wt% of MnTiO3NPs loading using the Taucmodelcame out to be 1.15 Ev, 1.35 and 1.25. Band gap analysis indicates semiconducting behavior of the NCs.
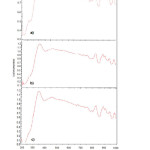 |
Figure1: DRS patterns of (a) MnTiO3 nanopowders (b) PANI/ MnTiO3 nanocomposite with MnTiO3 content of (10 wt%) and (c) (20 wt%) Click here to View figure |
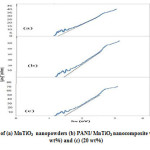 |
Figure2: Band gap patterns of (a) MnTiO3 nanopowders (b) PANI/ MnTiO3 nanocomposite with MnTiO3 content of (10 wt%) and (c) (20 wt%) Click here to View figure |
Morphology of samples
Fig.3. shows the scanning electron micrograph of pure MnTiO3 (Fig.3a.)) and the PANI/MnTiO3NCs with 10 and 20wt% of MnTiO3NPs loading, respectively (Fig.3(b–c).). The particles have agglomerated graining structure.In the scanning electron micrograph of the NCs, with the increase of MnTiO3 content, the agglomeration become more appreciable and display some connections in some regions. SEM images reveal a homogeneous dispersion of MnTiO3NPs in the PANI matrix.EDX patterns of pure MnTiO3 (Fig.4(a).) and the PANI/MnTiO3NCs with 10 and 20wt% of MnTiO3NPs loading, respectively are shown in Fig. 4b. EDX patterns of pure MnTiO3 (Fig .4(a).)shows separate peaks of Manganese(Mn), Titanium (Ti), and Oxygen, which compositional analysis by EDX confirms that the MnTiO3nanopowders were obtained. EDX pattern of PANI/MnTiO3NCs with 10 and 20wt% of MnTiO3NPs loading,are displayed in Fig.4b. which shows separate peaks of Manganese(Mn), Titanium (Ti), Oxygen, Carbon and Nitrogen (N), confirm that the sample is of desired composition having both the PANI and MnTiO3 nanoparticles. The results show that as the MnTiO3 content increases in 10 and 20 weight fractions, the intensity of MnTiO3 crystalline peaks gradually increases.
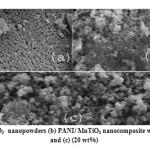 |
Figure3: SEM images of (a) MnTiO3 nanopowders (b) PANI/ MnTiO3 nanocomposite with MnTiO3 content of (10 wt%) and (c) (20 wt%) Click here to View figure |
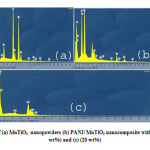 |
Figure4: EDX patterns of (a) MnTiO3 nanopowders (b) PANI/ MnTiO3 nanocomposite with MnTiO3 content of (10 wt%) and (c) (20 wt%) Click here to View figure |
Particle Size Distribution (PSD)
Particle size distribution analysis (PSD) is a measurement designed to determine information about the size and range of a set of particles in a representative material. Particle size was determined using dynamic light scattering measurements. Fig.5. shows the size distribution histogram of pure MnTiO3. The Zeta sizer software uses algorithms to extract the decay rates for a number of size classes to produce a size distribution. The X-axis shows a distribution of size classes, whereas the Y-axis shows the relative intensity of the scattered light. The particle size distribution of the pure MnTiO3 had a wide distribution (three peaks); therefore, its distribution is very heterogeneous. The particle size distribution of MnTiO3 for 88.2% of the particles were 85 nm, 6.4% were 250 nm, and 5.4% were 1088 nm.
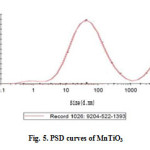 |
Figure5: PSD curves of MnTiO3 Click here to View figure |
Zeta Potential Measurements
Fig.6. shows the zeta potential measurements obtained for pure MnTiO3 (Fig.6(a).) and the PANI/ MnTiO3NCs with 10 and 20wt% of MnTiO3NPs loading. Initially, MnTiO3 had an average ζ of -9.75mV and the PANI/ MnTiO3NCs with 10 and 20wt% of MnTiO3NPs loading had an average ζ of -20 and -50.81 mV. With respect to Fig. 6.Zeta potential indicated that the fabricated PANI/MnTiO3NCs with 10 and 20wt% of MnTiO3NPs were increased with 34 and 67% efficiency respectively.
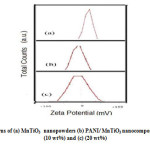 |
Figure6: Zeta potential patterns of (a) MnTiO3 nanopowders (b) PANI/ MnTiO3 nanocomposite with MnTiO3 content of (10 wt%) and (c) (20 wt%) Click here to View figure |
Conclusion
We have successfully synthesized PANI/MnTiO3NCs with two (10, 20wt%) contents loading of MnTiO3using wet chemical method. The whole procedure and structural characterization of PANI/MnTiO3NCs phases have been investigated by SEM, EDX, DRS, and Zeta Potential.The particle size distribution of MnTiO3 for 88.2% of the particles were 85 nm, 6.4% were 250nm, and 5.4% were 1088 nm. Zeta potential indicated that the fabricated PANI/MnTiO3NCs with 10 and 20wt% of MnTiO3NPs were increased with 34 and 67% efficiency respectively.
Acknowledgement
The authors express gratitude and thanks to Islamic Azad University and the Iranian Nanotechnology Initiative for supporting this study.
Refrences
- Majid, K.; Awasthi, S.; Singla, M.L. J. Sensor Actuators A. 2007, 135, 113-118.
- Ansari, R.;Keivani, M.B. E-J. Chem. 2006, 3, 202-217.
- Jiang, J.; Ai, L.;Li, L.-C. J. Mater. Sci. 2009, 44, 1024-1028.
- Nandi, M.; Gangopadhaya, R.;Bhaumik, A. Micropor. Mesopor. Mater. 2008, 109, 239-247.
- Zhao, C.; Xing, S.; Yu, Y.; Zhang, W.; Wang, C. Microelectron. J.2007,38, 316-320.
- Dalas, E.; Vitoratos, E.; Sakkopoulos, S.; Malkaj, P. J. Power Sources. 2004, 128, 319-325.
- Ryu, K.S.; Lee, Y.; Han, K.S.; Park, Y.J.; Kang, M.G.; Park, N.G.; Chang, S.H.Solid State Ionics.2004, 175, 765-768.
- Manigandan, S.; Jain, A.; Majumder, S.; Ganguly, S.; Kargupta, K.Sensor Actuators B. 2008,133, 187-194.
- Xu,H.;Gao,L. Mater. Lett.2002,57, 490–494.
- Wang,H.;Zhang,X.;Huang,A.; Xu,H.;Zhu,M.;Wang,B.;Yan,H.; Yoshimura,M. J. Cryst. Growth. 2002, 246, 150–154.
- Madeswaran,S.;Giridharan, N.V.;Jayavel,R. Mater. Chem. Phys. 2003, 80, 23–28.
- Enhessari,M.;Parviz,A.;Ozaee,K.;Karamali,E. J. Exp. Nanosci. 2010, 5(1),61–68.
- Ohno,T.;Fu,D.;Suzuki,H.;Miyazaki,H.;Ishikawa,K. J. Eur. Ceram. Soc. 2004, 24, 1669–1672.
- Gavrilovic,P.;Singh,S. US patent No.1994,5,280,534.
- Noginov, M. A.J. Opt. Soc. Am. BOpt. Phys.,1999,16(1),3–11.
- Zhydachevskii,Y.;Suchocki,A.;Berkowski,M.;Zakharko,Y. Radiat. Meas. 2007, 42(4–5), 625–627.
- Zhou,G.W.;Kang,Y.S. Mater. Sci. Eng.2004, 24, 71–74.
- Song,Z.Q.;Wang,S.B.;Yang, W.;Li,M.;Wang,H.;Yan, H. Mater. Sci. Eng., B.2004, 113, 121–124.
- Stickler,J.J.; Kern,S.;Wold,A.;Heller,G.S. Phys. Rev.1967,164, 765–767.
- Watanabe,H.;Yamauchi,H.;Takei,H. J. Magn. Magn. Mater. 1980,15–18, 549–550.
- de Haart,L.G.J.;de Vries,A.J.;Blasse,G. Mater. Res. Bull. 1984,19, 817–824.
- Enhessaria, M.;Parviz, A.; Karamali, E.; Ozae, K.J. Exp. Nanosci. 2012,7(3), 327-335.
- Mansour, M.S.; Ossman, M.E.;Farag, H.A. Desalination. 2011, 272, 301-305.

This work is licensed under a Creative Commons Attribution 4.0 International License.


