Histamnie and Chemical Composition of Canned and Frozen Green Pea (Pisum Sativum)
Akram Tahmasi1, Parisa Ziarati 2*
1Department of Food Science & Technology, Faculty of Advanced Sciences &Technology, Pharmaceutical Sciences Branch, Islamic Azad University, Tehran - Iran (IAUPS )
2Department of Medicinal Chemistry, Faculty of Pharmacy, Pharmaceutical Sciences Branch, Islamic Azad University, Tehran - Iran (IAUPS) Corresponding Author E-mail: ziarati.p@iaups.ac.ir
DOI : http://dx.doi.org/10.13005/ojc/310250
Article Received on :
Article Accepted on :
Article Published : 30 May 2015
The subject of heavy metals is receiving increasing scrutiny in food industry due to increasing incidents of contamination in agriculture and industrial sources. Metals like iron, copper, zinc, cobalt and manganese are essential metals since they play an important role in biological systems.Due to vast green pea consumption by people in this research the concentration of histamine ,some trace and essential mineral and also heavy metals has been determined in 120 samples of popular brands of canned and frozen green pea samples in 2014. These samples (60 of them were canned and the rest were frozen) were collected from different local markets of Tehran, Iran. For reliable, accurate and precise measurements, all canned and frozen samples had the same date of producing. Samples were randomly purchased for analysis and analyzed according to standardized international protocols by wet digestion method.Histamine content was determined by Capillary Electrophoresis while metals were determined by Atomic absorption spectrometer.The results obtained revealed that, the mean ranges of the elements analyzed in (mg kg-1) between the frozen and canned food are as follows: Fe (48.34 – 150.11), Zn (20.17 – 31.14), Cu (12.22 – 18.03), Ca (1899 –9524), Mg (1209 – 1544), Na (8114 – 18300), Sn (55.73- 328.5) respectively. Some of the measured values found, not only relatively high in canned compared to frozen food samples, but also exceeds the international tolerance levels. Histamine in 15% of samples was higher than permissible level. The monitoring of mineral and heavy metals in frozen and canned food samples is vital important challenge to control and improve the food industry strategies.
KEYWORDS:Green Pea; canned; Frozen; Histamine; mineral elements; chemical composition
Download this article as:| Copy the following to cite this article: Tahmasi A, Ziarati P. Histamnie and Chemical Composition of Canned and Frozen Green Pea (Pisum Sativum). Orient J Chem 2015;31(2). |
| Copy the following to cite this URL: Tahmasi A, Ziarati P. Histamnie and Chemical Composition of Canned and Frozen Green Pea (Pisum Sativum). Available from: http://www.orientjchem.org/?p=8907 |
Intorduction
A substantial amount of research literature has been published over the past 75 years reporting the effects of processing, storage and cooking on the nutritional quality of fruits and vegetables (1). Fresh seeds, are not convenient for storage and must be consumed quickly or processed and preserved (2). The level of mineral constituents depends, among other factors, on the species and cultivar (3, 4). Heavy metal content is also connected with the site of plant growth (5) and the content of metals in the soil (6). In view of their seasonal availability, leguminous vegetables are preserved using various methods, most frequently by canning in air tight containers and freezing. Unlike frozen products, canned vegetables are ready for consumption without any culinary preparation and may therefore be regarded as a convenience food. However, as shown by Kmiecik et al.(7) and Lisiewska et al. (8) ,even after preparation for consumption, frozen products preserve all chemical constituents, including mineral compounds, to a higher degree than canned food (9) .Minerals are essential nutrients, they are components of many enzymes and metabolism, and contribute also to the growth of the fish (10,11).The human body usually contains small amount of these minerals and the deficiency in these principal productivity and causes diseases (12). Ziarati and Ghaseminezhad on their investigation on oyster mushroom claimed that the mean content of essential elements in all samples would be decreased according to the microwaved cooking methods while frying method enhanced all of them. The reaction of Calcium content to microwaving was much higher than other elements (p< 0.001)(13).Ziarati et al. in other study on Agaricus Bisporus found out that the mean content of potassium in raw and heated samples has been changed according to the cooking methods respectively: Micro waved <Raw<Sliced<Fried<Cooked(14,15).The other major issue in vegetables and crops is vitamin C .
Vitamin C retention is an important indicator of vegetables qualitative changes during processing, storage and preparation for consumption.According to high consumption of vegetables in Iran and other countries as buoyed by increasing incomes in both Asia and Africa, demand for processed crops is set to increase in the medium term, doubling in Asia and Africa over the period 2000 to 2020(16). Therefore, nowadays the main challenges for research and development are to bridge the gap between actual and attainable yield by enhancing farmers’ access to quality inputs, improved technologies and information; and improve the competitiveness of pulse crops through domestic incentives related to production, marketing, processing, and prices in line with cereals and competing crops.
The aim of the work was to evaluate the effect of various technological and culinary processes on the retention of vitamin C in green pea seeds (Pisumsativum) in the forms of canned and frozen packaged commercially available in Iran market.The evaluation was carried out on raw seeds and on seeds after blanching, cooking, sterilizing and freezing. Frozen products were analyzed after preparation for consumption. The research included two frozen product types, obtained using traditional and a modified process (cooking before freezing). The last procedure results in a convenience product (ready-to-eat) requiring only thawing and heating in a microwave oven.
Material and Method
Food Sampling
The green pea (Pisumsativum) processed products were purchased at two different times in a month and continued for 6 months in 2014. These products were retained in their original containers to avoid contamination problems: frozen items were kept in a freezer until used. The concentration of mineral and toxic heavy metals has been determined in 120 samples of canned green pea and frozen sweet green pea, for comparison in 2014. These samples (60 of them were canned green pea and the rest were frozen) were collected from different local markets of Tehran, Iran.The frozen product which was cooked before freezing was defrosted and heated in a Samsung CE73JD Convection microwave oven. A 500 g sample was put in a heat-resistant covered vessel. 11 minutes taking time for defrosting and heating the product to a temperature of 75°C accordingly with Codex Alimentarius(17). After cooling in a stream of cold air to 20°C, the material was evaluated. At the same time canned samples were warmed to room temperature.
The cans were then opened and their contents placed on sieves. The material was analyzed after the fluid fraction had dripped off.
Ascorbic acid Determination
AL-ascorbic acid and vitamin C (as the total of L-ascorbic acid and L-dehydroascorbic acids) levels were determined by using a spectrophotometric method (18) .A dual-beam UV-visible spectrophotometer [Shimadzu, Japan] model UV cells, connected to a compatible computer was used. Bundled, UV software version 2.21 was used to process the absorption.
Histamine Determination by Capillary Electrophoresis
All chemicals were of analytical reagent grade. Deionized water was used throughout. The following compounds were used: 0.1 mol/l HCl; 1.0 mol/l NaOH; 1.2 mol/l H3PO 4 (dilute 12.2 ml of 85% acid in a 100ml flask); 1% solution of orthophtalate aldehyde; 1 mg/ml histamine solution (dissolve 167.4 mg of histamine hydrochloride and add 0.1 mol/l HCl in 100ml flask). The capillary electrophoresis instrument was programmed to run a voltage gradient of 5–30 kV over 13 min, with replenishment of the sodium citrate (20 mM, pH 2.5) buffer after every injection. The following rinses were used after each sample: water 1 min, aqueous NaOH (0.1M for paste extracts, 0.5M for fruit ex-tracts) 1 min, water 1 min, running buffer 1 min. Detection was at 212 nm and the operating temperature was set to 35°C. Samples and standards were injected hydrodynamically (50 mbar for 10 s) (19-21 ).
Zinc, Manganese, Copper, Nickel , Tin and Potassium Determination
For Zinc, Manganese, Copper, Nickel , Tin and Potassium concentration in canned and frozen green pea samples , powered samples were dried in oven for 36 hours at a temperature of 85°C. The samples were then ground and sieved through 0.5 mm sieve. The powdered samples then subjected to the acid digestion using concentrated nitric acid (65% Merck), Sulfuric acid (96.5% Merck) and per chloric acid (70% sigma). Analar grade hydrogen peroxide (about 30%) also was used for the digestion. Application of concentrated HNO3 along with thirty percent hydrogen peroxide H2O2 (Merck) for mineralization of samples to the complete digestion of samples (22-24 )following Environmental Protection Agency (EPA) Method 3052 was done.
Two gram of air-dried of each homogeneously green pea samples accurately weighed and 30.0 mL of the digestion mixture (4 parts by weight of nitric acid: 2 parts of Sulfuric acid & 3 parts by weight perchloric acid) and heated slowly by an oven and then rise the temperature. The remaining dry inorganic residues were dissolved in 30.0 mL of concentrated nitric acid and the solution used for the determination of trace and essential mineral elements. Blanks and samples were also processed and analyzed simultaneously. All the chemicals used were of analytical grade (AR). Standardized international protocols were followed for the preparation of material and analysis of heavy metals contents (19,25-29). The samples were analyzed by Flame Emission Spectrophotometer Model AA-6200 (Shimadzu, Japan) using an air-acetylene, flame temperature: 2800°C, acetylene pressure: 0.9–1.0 bar, air pressure: 4.5–5 bar, reading time: 1–10 sec (max 60 sec), flow time: 3-4 sec (max 10 sec), using at least five standard solutions for each metal and determination of potassium content was followed by FDA Elemental analysis (30) In order to verify of reliability of the measuring apparatus, periodic testing of standard solutions was performed . The accuracy was checked using quality control test for fungi and their substrate samples to show the degree of agreement between the standard values and measured values; the difference was less than 5%.
Iron Determination
The aliquot was passed through the atomic absorption spectrophotometer to read the iron concentration. Standards were prepared with a standard stock of 10 mg/L using ferrous ammonium sulphate where 3 – 60 ml of iron standard solution (10 mg /L) were placed in step wise volumes in 100 ml volumetric flasks. 2 ml of perchloric acid were added and then brought to the volume with distilled water. The concentration of iron in the aliquot was measured using the atomic absorption spectrophotometer in mg/L. The whole procedure was replicated three times (24,31).
Calcium, Sodium and Magnesium Determination
5 ml of the aliquot were placed in a titration flask using a pipette and diluted to 100 ml with distilled water and subsequently 15 ml of buffer solution, ten drops of Eriochrome black T indicator and 2 ml of triethanolamine were added. The mixture was titrated with Ethylene-Diamine-Tetra-Acetate (EDTA) solution from red to clear blue (32).
The most sensitive wavelengths for the determination by atomic absorption spectrophotometer of analyses were as follows: for K – 766.490 nm, Ca – 422.673 nm, Mg – 279.533 nm, Na – 589.592, Fe – 234.349 nm, Zn – 213.856 nm, , Cu – 224.700 nm, Ni – 232.003 nm.
Statistical Analysis
Values were expressed as the mean (μg/g) ± standard deviation (SD). Manufacturing differences on the basis of the type of green pea samples were determined by student t-test. Processing changes were calculated by one way ANOVA and for analysis of the role of multiple factors univariate analysis was used by SPSS 20 .Probability values of <0.05 were considered significant.
Results and Discussion
Results were determined as mean ± SD of dry weight from three replicates in each test. The samples were analyzed by wet digestion method and standardized international protocols were followed for the preparation of material and analysis of heavy metals contents and analyzed by Atomic Absorption Spectrophotometer in Research Laboratory in Pharmaceutical Sciences Branch, Islamic Azad University.
The mean values of mineral and heavy metals and histamine concentrations in canned and frozen green pea studied samples are given in Table 1.The obtained results show that, the highest concentration in canned food samples was for tin:328.5 ±12.28 and lowest 54.730± 3.64(μg.g-1 DW± SD).According to variance analyses of data, heavy metal concentration and histamine in canned green pea samples were significantly affected by company factory and time of storage.
Table1: Concentrations of histamine and heavy metals (μg.g-1 DW± SD) in canned and frozen green pea samples(Data represent the mean of three replicates).
| Minimum | Maximum | Mean | |
| Histamine | 12.78± 0.91 | 286.4±21.14 | 125.8±15.30 |
| Nickel | 0.31± 0.12 | 17.54 ± 1.11 | 14.78 ±1.48 |
| Calcium | 1899 ± 23 | 9524 ± 41 | 5231± 25 |
| Tin | 54.730± 3.64 | 328.5±12.28 | 156.21±15.88 |
| Zinc | 20.17±1.14 | 31.14±2.85 | 26.40 ±2.26 |
| Copper | 12.22 ±1.44 | 18.03± 3.41 | 16.78± 5.33 |
| Iron | 48.34± 6.54 | 150.11±11.18 | 78.88 ±9.82 |
| Magnesium | 1209 ± 32 | 1544± 45 | 1348 ± 36 |
| Sodium | 8114± 72 | 18300± 114 | 10570 ± 86 |
This research show a significant effect on Zinc, Nickel, Iron and Tin contents in green pea samples tested (p≤0.001) as these mean metal contents in canned green pea samples were significantly higher and even in canned samples especially tin, zinc, Nickel and iron concentrations were varied significantly (p < 0.03) after 3 months of storage. In figures 1, 2 and 3 the mean contents of Nickel, Iron and tin were illustrated in canned green pea samples after 3 months of the production date. Figures showed that even in canned green pea the differences of metal content are remarkably high according to manufacturers.
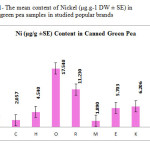 |
Figure1: The mean content of Nickel (μg.g-1 DW ± SE) in canned green pea samples in studied popular brands Click here to View figure |
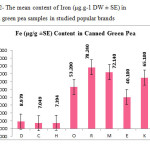 |
Figure2: The mean content of Iron (μg.g-1 DW ± SE) in canned green pea samples in studied popular brands Click here to View figure |
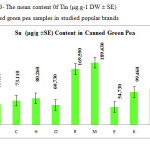 |
Figure3: The mean content 0f Tin (μg.g-1 DW ± SE) in canned green pea samples in studied popular brands Click here to View figure |
Canned and Frozen Green Pea
Canned and frozen green pea kernels are relatively popular food products and are an important part of the human diet especially nowadays. The major differences between canned and frozen peas are storage temperature and storage container. All items designated “canned” in this study were purchased in metal cans, whereas all frozen items were purchased in 450-500 g weight packaged. After these samples had reached ambient temperature conditions the liquid was drained off completely before weighing the drained sample for analysis. Results are summarized in Table 1 (on a dry basis) of the metal content of canned and frozen Legume seeds. Except for the higher value for tin, Ni and Fe in some brands( O,M and R), other metal and also vitamin C values for canned and frozen green pea were approximately similar, but in all mineral contents , the frozen samples have higher concentration but the differences are not significant (p >0.05).
Conclusions
The studied measured metals in processed and prepared green pea products are inherent in raw green pea in parts per million concentration range. These naturally occurring trace elements are concentrated mainly in the germ fraction of green pea. As might be expected, in the variety of unprocessed or processed green pea based foods analyzed metal content depended primarily on whether the germ was present in the finished product. By relating metal concentration values for the green pea foods selected to values established for whole kernel green pea. It was possible to indicate that minor additional quantities of these same metals may have been introduced into the products as a result of processing. In conclusion canned green pea products studied here contribute only minor quantities of histamine, Iron, Nickel and Tin to the diet when the total amount of food eaten daily is considered. Of special significance are the extremely low quantities of tin in all green pea products.
Acknowledgments
Supports from the Pharmaceutical sciences Branch, Islamic Azad University (IAUPS) are gratefully acknowledged.
References
- Rickman, C. J.; Barrett,D. M. ; Bruhn, C. M.Journal of the Science of Food and Agriculture.2007, 87,930–944 .
- Slupski, J. Acta Sci. Pol.Technol.Aliment. 2011, 10(2), 197-208.
- Moghanloo, Z.; ziarati, P.; asgarpanah, J. Oriental Journal of Chemistry. 2015, 31 (1),489—491.
- Moraghan, J.T.; Grafton, K. J. Agric. Food Chem.2001,81, 404-408.
- Ziarati, P.; Ziarati, N.N.; Nazeri, S.;Saber-Germi, M. Oriental Journal of Chemistry. 2015, 31(1), 317-326.
- Dąbkowska-Naskręt, H. Land Contam. Reclam. 2004, 12, 205-212.
- Kmiecik, W.;Lisiewska, Z.;Jaworska, G. J. Food Comp. Anal, 2000, 13, 905-914.
- Lisiewska, Z.;Kmiecik, W.;Gębczyński, P. Food Chem. 1999 ,67, 155-162.
- Ziarati, P.; Tosifi, S.International Journal of Plant, Animal and Environmental Sciences.2014, 4( 2), 519-528.
- Sarjubala–Devi,W. ;Sarojnalini, C.H.I.J.A.B.R., 2012, 2(4), 641-645.
- Glover, C. N.;Hogstrand, C. Journal of Experimental Biology. 2002, 205, 151-158.
- Mills, C.F. The mineral nutrition of livestock. E.J. Underwood, (Ed.) Common Wealth Agricultural Bureaux. 1980, 9.
- Ziarati, P. ;Ghasemynezhad-Shanderman, S.S. International Journal of Plant, Animal and Environmental Sciences.2014,4 (2), 496-502.
- Ziarati,P.; Rabizadeh, H. ;mousavi ,Z.; asgarpanah, J. ;Azariun, A.International Journal of Farming and Allied Sciences.2013,2(19), 728-733.
- ziarati, P.; Rabizadah, H.Journal of Novel applied Sciences.2013,2(2S ), 954-959.
- Parthasarathy, R. P.; Birthal, P.S.;Bhagavatula, S.;Bantilan, M.C.S . Patancheru,2010,502, 324, Andhra Pradesh, India: International Crops Research Institute for the Semi-Arid Tropics. Page 2.Available from: http://oar.icrisat.org/191/1/98_2010_BO49_CP_and_PP.pdf.
- Codex Alimentarius. 1993. Code of hygienic practice for precooked and cooked foods in mass catering. CAC/RCP 39.
- ISO/6557-2 1984. Fruits, vegetables and derived products – determination of ascorbic acid content. Part 2. Routine methods. Inter. Org. Stand. Geneva.
- Mirmohammad-Makki, F.; Ziarati , P. B.B.R.A.2014, 11(2), 537-544.
- LESZCZYŃSKA, J.;WIĘDŁOCHA, M.; PYTASZ, U. Czech J. Food Sci.2004, 22(3), 81–86 .
- ELEKBOLYGO, P.; COOPER, K.; MICHAELJESSOP, F JOURNAL OFA.O.A.C. INTERNATIONALVOL. 2000, 83 (1), 89-94.
- 22.Mohammadi, S.; Ziarati, P. Oriental Journal of chemistry.2015,31 (1), 409-416.
- Sattler, J.; Hafner, D.; Klotter, H.J.; Lorenz, W.; Wagner, P.K. Agents Actions. 1988 ,23, 361– 365.
- Available From: http://www.chilealimentos.com/medios/2008/servicios/infodemercado/prensaespecializada2006/Junio_2006/tomato_processing_Iran_2006_WPTC.pdf.
- 25. Silla-Santos, M.H. Int. J. Food Microbiol. 1996,29,213–231.
- 26. Bieganski,T.; Kusche, J.; Feussner, K.D.; Hesterberg, R.; Richter, H.; Lorenz, W. Agents Actions.1980, 10, 108–110.
- 27. Bieganski, T.; Kusche, J.; Feussner, K.D.; Hesterberg, R.; Richter, H.; Lorenz, W. Arch.Immunol.Ther. Exp. (Warsz).1980, 28, 901–906.
- Bieganski, T.; Kusche, J.;Lorenz, W.; Hesterberg, R.; Stahlknecht, C.D.; Feussner, K.D. Biochim.Biophys.Acta .1983, 756, 196–203.
- 29. Bieganski ,T. Acta. Physiol. Pol.1983, 34, 139–54.
- Sattler, J.; Hafner, D.; Klotter, H.J.; Lorenz, W.; Wagner, P.K. Agents Actions. 1988;23, 361– 365.
- Maintz, L.; Novak,N.American Society for Clinical Nutrition.2007.
- Abedi, S.; Peykani, G. R.; Kavoosi Kalashami,M. International Journal of Agricultural Management &Development (IJAMAD).2011, 1(4), 197-206.

This work is licensed under a Creative Commons Attribution 4.0 International License.
![]()
A New Edition of Web of Science
Journal Impact Factor
2022: 0.5
Five Year: 0.8
Journal is Indexed in

Cabells Whitelist
![]()


