Chemical Analysis of Rainwater and Study Effect of Vehicle Emissions on Human Health in Kurdistan Region
Bashdar Ismael Meena*, Karzan Abdulkareem Omar
Department of Chemistry, Faculty of Science and Health, Koya University, Daniel Mitterrand Boulevard, Koya KOY45 AB64, Kurdistan Region - Iraq.
DOI : http://dx.doi.org/10.13005/ojc/310210
Article Received on :
Article Accepted on :
Article Published : 30 Apr 2015
The pollution of air in the Kurdistan Region increases year by year due to industrialization, oil refining and vehicle emissions from burning fossil fuels as a source of energy which excretes nitrogen, sulphur and carbon into the atmosphere. The uncompleted combustion of them causes to increase the concentration of harmful oxides of nitrogen, oxides of sulphur and oxides of carbon. This study, carried out with uses of questionnaires and laboratory experiments. They were conducted on rainwater collected during first raining in October of 2014 and 2015 from each city to determine the level of acidity, pH, conductivity and dissolved substances of NO3-, SO42- and CO2 in them. The effect of those gases on the people’s health in the Kurdistan Region from the questionnaires was observed in the average of 7%, 13%, 6%, 9%, and 6% suffering from asthmatic attacks, sleeplessness, heavy eye, headache and cough respectively.
KEYWORDS:Chemical analysis; Vehicle emission; Rainwater; Illness; pH; Conductivity; Kurdistan Region; Survey
Download this article as:| Copy the following to cite this article: Meena B. I, Omar K. A. Chemical Analysis of Rainwater and Study Effect of Vehicle Emissions on Human Health in Kurdistan Region. Orient J Chem 2015;31(2). |
| Copy the following to cite this URL: Meena B. I, Omar K. A. Chemical Analysis of Rainwater and Study Effect of Vehicle Emissions on Human Health in Kurdistan Region. Orient J Chem 2015;31(2). Available from: http://www.orientjchem.org/?p=8668 |
Introduction
Fossil fuels are natural resources which are included gasoline and diesel fuel and natural gas. The burning of fossil fuel gives the power to our vehicles and provides the energy source to industries; also it uses to produce electricity. The Fossil fuels are the major energy source in the Kurdistan region, as a result of over consumption takes place lead to disastrous effect such as air pollution, Burning of fossil fuels releases (CO2) carbon dioxide, nitrogen oxide NO, Sulphur dioxide SO2, carbon monoxide CO 1. In the Last decades, rapid increase occurred in population and industrial oil in the Kurdistan region, also established many new factories such as a factory of refining oil, factory of cement, iron and station of production of electricity in spite that all of them are working with fossil fuel and emits huge amount of gases to air 2, 3. The pollution due to dramatically increasing numbers of vehicles in the Kurdistan region, indicating an increase in the volume of traffic by an amount of 10 times this reaches due to the emission of huge quantities of CO2 in comparison to the other pollutants only at the Erbil level of emission 2813 tons daily in 2011 4 as well as due to an increasing number of power generators which are worked by gasoline. The gases and soot excreting by generators contain toxic gases and substances such as lead (Pb) metal 5. The concentration of lead (Pb) in the Kurdistan region atmosphere and soil has been increased due to oil refining 6 and using large quantities of gasoline as a source of energy. Therefore, the industrialization and transportation’s role in decreasing urban air quality and increasing atmospheric greenhouse gases through vehicle and industrial emissions have been global concern 7.
According to the Environmental Protection Agency vehicle emissions represent a serious environmental health problem, which is expected to increase in significance as vehicle ownership increases globally. The United Nations estimates that over 600 million people worldwide are exposed to hazardous levels of traffic-generated pollutants, some of the worst pollutants and those that are closely monitored in the United States, which are nitrogen oxides, carbon monoxide, sulphur dioxide, lead, and particulate matter. The significant contributor to the poor air quality in urban areas 5, with large health effects 8. According to data from the U.S. Environmental Protection Agency (EPA), Vehicles was the single source category with the largest emissions of carbon monoxide (CO), nitrogen oxides (NOx), and volatile organic compounds 9. These compounds have led to the greenhouse effect, acid rain, photochemical smog, stratospheric ozone depletion, and the aforementioned global warming 10, 11.
Many studies have documented adverse health effects associated with high concentrations of Air pollution also numerous scientific studies have linked air pollution to a variety of health problems 12. The aggravation of respiratory and cardiovascular disease decreases lung function 13 and increase frequencies and severity of respiratory symptoms such as difficulty breathing and coughing, which are increasing susceptibility to respiratory infections 14, which is effected in the nervous system, including the brain, such as IQ loss and impacts on learning, memory, behavior cancer 15 and premature death. Some sensitive individuals appear to be at greater risk from air pollution-related health effects, for example, those with pre-existing heart and lung diseases (e.g., heart failure/ischemic heart disease, asthma, emphysema, and chronic bronchitis), diabetics, older adults, and children.
The effect of air pollution on public health depends on factors such as, chemical composition of a particular pollutant, level of concentration, the presence of other pollutants, the exististy health of individuals and period of exposure 16.
Nitrogen oxides and sulphur oxides, for example, are associated with immune system impairment, exacerbation of asthma and chronic respiratory diseases, reduced lung function, and cardiovascular disease 17. The exposure to carbon monoxide can result in fatigue, headaches, dizziness, loss of consciousness, and even death at very high concentrations 18. Also, lead (Pb) is the one of the most dangerous as poisoning causes irreversible neurobehavioral consequences, such as decreased IQ and attention deficits, and death at high levels of poisoning 19. In addition to these pollutants, vehicle emissions contain volatile organic compounds, which are a class of petroleum combustion by-products which includes many known and probable carcinogens and reproductive toxicants. The volatile organic compounds are also hazardous because they can react with sunlight to form ozone, which exacerbates asthma and has other adverse respiratory effects 20.
This research deals with the environmental issue of air pollution and the problems are causing serious health problems to the resident of the Kurdistan region, the pollution of air by those gases and increasing their concentration in the atmosphere lead to serious problems for the next decade, therefore, this problem should be taken in concern by finding a suitable way to solving it and providing a safe environment to peoples which are living in this area.
Study Area
The Kurdistan region is located in the west of Asia and it has borders with Iran in the east, Turkey in the north, and Syria in the west, along with the rest of Iraq in the south. It consists of three large cities of Duhok, Erbil and Slemani and it has a total land area of 41,710 square kilometers and 8.35 million populations and its people consist of three ethnic groups. Speaking two official languages which are Arabic and Kurdish, the Kurdish languages are divided into four dialect groups.
 |
Figure1: Map of Iraq showing Kurdistan Region Click here to View figure |
Mterial and Methods
Sampling Sites
Samples of rainwater were collected in the three different places (i.e Erbil, Slemani and Duhok) of the Kurdistan region. The rainwater samples were collected during first raining in October of each year; they were placed in clean plastic containers to prevent contact with any object which may effect on chemical analysis. In the laboratory the samples, analyze to determine the acidity level, concentrations of nitrate, sulphate, carbon dioxide, pH and conductivity of the samples. Also, we did survey in each city to indicate the effect of those gases on the human health in this area.
Acidity
3-4 drops of phenolphthalein indicator were added to 50ml of the sample in a conical flask over a white surface. The mixture is then titrated with standard 0.02M NaOH until the colour changed to the pink, which is the characteristic of pH of 8.3. The acidity level in rainwater is determined by the following formula which is shown how the acidity as mild as CaCO3 is calculated.

Where = A = ml of titrated sample, N = normality of NaOH and D = diluted factor (if any).
Nitrates
25ml of the sample was a pipette into 250ml beaker and 4ml of 0.25M NaOH added to the mixture and stirred gently, after a while12.5ml of reduction mixture (Hydrazine sulphate + copper sulphate) was added to the mixture was shaken vigorously and allowed to stand for 40 minutes, after that 6ml of 0.1M of HCl added to the mixture. It was then allowed to stand for 5miniutes after that 1ml sodium acetate was added to the mixture allowed to stand for 10miniutes.The absorbance of the mixture read on a spectrophotometer at 520mm; and the concentration of nitrate calculated in milligram per liter.
Sulphate
200 ml of the sample poured into 400 ml beaker, and add 5ml of diluted (2M) acid to the filtrate. The liquid temperature rises up to boiling point and adds 10 ml of 10% BaCl2 to it. After waiting for 30 minutes, the filtration carried out to the solution and precipitate washed with distilled water to remove the excess of barium chloride. The precipitate is then shed and weighed as BaSO4 and it calculated in milligram per liter of sulphate.
Carbon-Dioxide
10ml of the sample in the measuring cylinder transferred into conical a flask and 4-5 drops of phenolphthalein indicator added in to it. The colourless solution is then titrated with 0.045 M sodium carbonate solution during titration bits of sodium carbonate added into a conical flask and titration carried out until the faint pink colour observed and remains for at least 30 seconds. It indicates the presence of carbon-dioxide 21 and it calculated by following formula.

pH
The pH measurement carried out for collecting samples by using (pH 510 MUTECH pH meter) which was standardized with buffer solutions of pH 4, pH 7, and pH 9 at 25°C.
Conductivity
The conductivity measurement carried out for collecting samples by using (MUTECH conductivity meter Ecoscan Con 6 1180424) which was standardized with the standard solutions at 25°C.
Results and Discussion
The atmosphere of Kurdistan region is influenced by industrial and vehicle emission which results in increases level of harmful substances such as NO3–, SO42- and CO2 in its atmosphere which causes health problem to people in this region. Therefore, to estimate the concentration of them in the air we analyzed rainwater samples collected from three cities of Erbil, Slemani and Duhok, Kurdistan Region, Iraq.
The NOx in water droplet considered as the most important source of NO3– in rainwater which form HNO3 gaseous. The concentration of nitrate in the rainwater of Erbil, Slemani and Duhok been increased in compared to 2014 from 0.033 to 0.98, 0.026 to 0.8 and 0.028 to 1.65 mg/L, respectively, due to automobile exhaustion and it can be observed that the Erbil and Duhok cities contaminated with more NO3– as compared to the Slemnai city as shown in fig. 2.
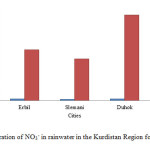 |
Figure2: Concentration of NO3– in rainwater in the Kurdistan Region for 2014 and 2015 Click here to View figure |
Also, the SO4-2 is formed by SO2 gas emission from automobile exhaust. It reacts with water droplets which is the main source of sulphate ions in rainwater. The concentration of sulphate ions increased in Erbil, Slemani and Duhok cities from 45 to 90, 34 to 75 and 65 to 120 mg/L, respectively in comparing to 2014 as shown in fig. 3.
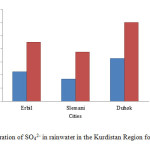 |
Figure3: Concentration of SO42- in rainwater in the Kurdistan Region for 2014 and 2015 Click here to View figure |
Fig. 4. Shows that the concentration of CO2 gas increases in both cities of Erbil and Duhok from 249 to 396 and 645 to 1500 mg/L, respectively, and in Duhok high concentration of CO2 gas observed in it rainwater which is caused by car exhausts, combustion of fossil fuels and factories which are using fossil fuels as a source of their energy mostly in those two cities. But the CO2 gas level in Slemani rainwater reduced from 447 to 150 mg/L in comparison to 2014.
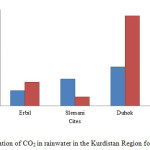 |
Figure4: Concentration of CO2 in rainwater in the Kurdistan Region for 2014 and 2015 Click here to View figure |
Fig. 5. Shows that there are increases in the acidity level from 10 to 26 and 26 to 86 mg/L in Erbil and Duhok rainwater in comparison to 2014, Also the acidity level of Duhok’s rainwater observed too high compare to 2014 due to increases of carbon dioxide gas concentration in it an atmosphere which is major cause of increases the acidity level of rainwater. But the acidity level in Slemani rainwater reduced from 18 to 16 mg/L in comparison to 2014.
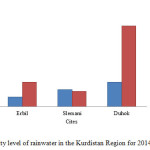 |
Figure5: Acidity level of rainwater in the Kurdistan Region for 2014 and 2015. Click here to View figure |
The relation between CO2 and acidity can be plotted as shown in fig. 6. It indicates a direct relationship between them as CO2 concentration increase the acidity level increases in rainwater and by decrease the CO2 concentration decreases the acidity as observed in Selmani’s rainwater.
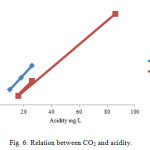 |
Figure6: Relation between CO2 and acidity. Click here to View figure |
Day by day the level of substances of NO3–, SO42- and CO2 are increasing in our atmosphere due to industrial factory using fossil oil as a source of energy and automobile emission are powered by diesel fuel and operate almost 10 hours per day excreting heavy soot and toxic gases into our atmosphere which are caused to several types of health problem to people live in this area and near from it for those reasons several questionnaires were administered to the Policeman, Traffic man, Market man, Street hawkers, Drivers, Traders, Residents. Indicate the effect of these substances on human health in the study area. The Asthmatic attacks were observed in all three areas, in Slemani were 7% , and in Erbil and Duhok were almost same percentage 8%. The sleeplessness can be linked to heavy eye were observed small percentage (sleeplessness %2 and heavy eye %3) in Duhok and high percentage (sleeplessness %9 and heavy eye %7) in Erbil and Slemani (sleeplessness 8% and heavy eye 9%) because of working people in this area for the greater part of their day and they are exposed to various types of gas emissions by vehicles, for this reason they are suffering from heavy eye which is the causes of sleeplessness. Also, the headache and cough were observed in different percentage (headache 10% and cough 8%) in Erbil, (headache 9% and cough 6%) in Slemani and (headache 8% and cough 4%) in Duhok due to using different types of vehicles such as big buses and cars which are may produces heavy emission and poisonous gases may results of uncompleted combustion of fuel and inhaled by people during the day while undergoing their business activities as shown in Fig. 7.
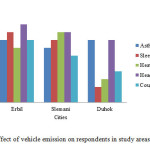 |
Figure7: Effect of vehicle emission on respondents in study areas in 2015 Click here to View figure |
The electrical conductivity of rain water effected by concentration of ionized substances such as chloride, nitrate, sulphate, and phosphate anions or sodium, magnesium,calcium, iron, and aluminium cations. The electrical conductivity of rainwater in Erbil increases from 0.175 to 0.52 mS/cm, in Slemani from 0.0224 to 0.419 mS/cm and in Duhok from 0.129 to 0.459 mS/cm as shown in Fig. 8. Since the measured electrical conductivity of rainwater for 2014 and 2015, it can be observed that the contamination of the Kurdistan region’s atmosphere by undesirable cations and anions increased in comparing to 2014.
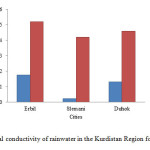 |
Figure8: Electrical conductivity of rainwater in the Kurdistan Region for 2014 and 2015 Click here to View figure |
The PH of rainwater is influenced by ion concentration of nitrates, sulphate and carbonate as the concentration of those gases increases in an atmosphere causes to decrease the pH of rainwater due to increase in quantity of nitric acid, sulphuric acid, Sulphurous acid and carbonic acid in the rain water. The acidic pH reveals the presence of strong acids while neutral or alkaline pH indicates neutralization of acids by carbonates, mineral dust or by ammonium. This may be due to the reaction of sulphuric and nitric acid absorbed in the aerosols with alkaline carbonates in the particulate matter 22, 23, 24. The measured pH of Erbil , Slemani and Duhok indicated that almost neutral in 2014 in comparison to 2015 as shown in fig. 9.
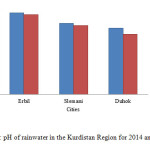 |
Figure9: pH of rainwater in the Kurdistan Region for 2014 and 2015 Click here to View figure |
Conclusions
The analyzed samples of rainwater which was collected from three different cities in the Kurdistan region during first raining in October of 2014 and 2015, shows that the concentration of NO3–, SO42- and CO2 are increasing in all three cities rainwater except CO2 and acidity decreased in Slemani in comparison to 2014. The electrical conductivity of Erbil, Duhok and Slemani rainwater increases, which indicated that the presence undesired of cations and anions in them. Also, the pH of their rainwater decreases in all three cities in comparison to 2014. The effect of vehicle emission which contains nitrogen, sulphur and carbon and their harmful oxides were observed by the people of the Kurdistan Region, which causes to them several health problems such as asthmatic attacks, sleeplessness, heavy eye, headache and cough.
Acknowledgement
The authors are grateful to Dr. Tara Fuad Tahir and Salam Ghafour Taher for their support and cooperation
References
- Yao, Z.; Di, S. Open Journal of Air Pollution. 2012, 1, 31-36. http://dx.doi.org/10.4236/ojap.2012.12004.
- European Conference of Ministers of Transport (ECMT). Managing Urban Traffic Congestion. Organisation for Economic Co-operation and Devellopment (OECD), Transport Research Center ISBN 978-92-821-0128-5, (2007)
- Schrank, D.; Lomax, T.; Turner, S. 2010 Urban Mobility Report. Texas Transportation Institute, College Station, TX, (2010)
- Hamed, M.; Yousif, A.; Fakhri, H. International Journal of Engineering Trends and Technology. 2013, 4, 3509- 3514
- Mohammed, S. M. ARO, the Scientific Journal of Koya University. 2014, 2, 6-11. http://dx.doi.org/10.14500/aro.10036
- Omar, K. A.; Omar, N. S. ARO, the Scientific Journal of Koya University. 2014, 2, 24-31. http://dx.doi.org/10.14500/aro.10047
- Fenger, J. Atmospheric Environment. 1999, 33, 4877–4900
- Vu, V. H.; Le, X. Q.; Pham, N. H.; Luc, H. Journal of Environmental Protection. 2013, 4, 1165-1172. http://dx.doi.org/10.4236/jep.2013.410133
- Jens, B.; David, B.; Bertil, F.; John, G.; Joachim, H.; Nicole, J.; Matti, J.; Edward, J.; Menno, K.; Alois, K.; Michal, K.; Birgit, K. D.; Giorgio, M.; Sylvia, M.; Isabelle, M.; Leonidas, N.; Zissis, S.; Eric, S.; Jürgen, S.; Per, E. S.; Radim, J. S.; Nikolaos, S.; Magnus, S.; Roel, V. A. Health effects of transport-related air pollution, WHO Regional Office for Europe. Copenhagen, Denmark, (2005)
- Giraldo, L.; Pirajan, M. C. J. Orient J Chem. 2014, 30, 451-461. http://dx.doi.org/10.13005/ojc/300207
- Latypov, V. M.; Anvarov, A. R.; Lutsyk, E. V.; Fedorov, P. A.; Latypova, T. Orient J Chem. 2015, 31, 401-408. http://dx.doi.org/10.13005/ojc/300201
- Groneberg, B.; Kraus, T.; Van, M. A.; Wagner, U.; Fischer, A. Journal of Occupational Medicine and Toxicology. 2006, 1, 6. http://dx.doi.org/10.1186/1745-6673-1-6
- Budinger, G. S.; McKell, J. L.; Urich, D.; Foiles, N.; Weiss, I.; Chiarella, S. E.; Mutlu, G. M. PLoS One. 2011, 6, e18525. http://dx.doi.org/10.1371/journal.pone.0018525
- Abbaspour, M.; Soltaninejad, A. International Journal of Environmental Science,Technology. 2004, 1, 27-38
- Yemaneberhan, H.; Bekele, Z.; Venn, A.; Lewis, S.; Parry, E.; Britton, J. The lancet. 1997, 350, 85-90
- Mahmoud, A. S. Air Pollution. 2015, 4, 1-6
- Marshall, J. D.; Riley, W. J.; McKone, T. E.; Nazarott, W. E. Atmospheric Environment. 2003, 37, 3455-3468
- Brauer, M.; Amann, M.; Burnett, R. T.; Cohen, A.; Dentener, F.; Ezzati, M.; Thurston, G. D. Environmental Science and Technology. 2012, 46, 652–660
- Stanek, L. W.; Sacks, J. D.; Dutton, S. J.; Dubois, J. B. Atmospheric Environment. 2011, 45, 5655-5663. http://dx.doi:10.1016/j.atmosenv.2011.07.023
- World Health Organization., Air quality guidelines for Europe. 2nd edition; WHO Regional Office for Europe. Copenhagen, Denmark, (2000)
- Ojolo, S. J.; Oke, S. A.; Dinrifo, R. R. journal of Rural and Tropical Public Health. 2007, 6, 16-23.
- Rao, S. P.; Momin, G. A.; Safai, P. D.; Pillai, A. G.; Khemani, L. T. Atmospheric Environment. 1995, 29, 2025-2029. http://dx.doi.org/10.1016/1352-2310(94)00294-U
- Tu, J.; Wang, H. S.; Zhang, Z. F.; Jin, X.; Li, W. Q. Atmospheric Research. 2005, 73, 283-298. http://dx.doi.org/10.1016/j.atmosres.2004.11.002
- Zhang, M.Y.; Wang, S. J.; Wu, F. C.; Yuan, X. H.; Zhang, Y. Atmospheric Research. 2007, 84, 311-322. http://dx.doi.org/10.1016/j.atmosres.2006.09.003

This work is licensed under a Creative Commons Attribution 4.0 International License.
![]()
A New Edition of Web of Science
Journal Impact Factor
2022: 0.5
Five Year: 0.8
Journal is Indexed in

Cabells Whitelist
![]()


