Characterization of Hexahydroxycyclotriphosphazene Salicylate; Epr, Nmr, Xrd Spectra
Atul Gupta, Govind Kumar Gupta and S. P. S. Jadon*
Department of Chemistry, S.V. College, Aligarh (U.P.) 202001 India Corresponding Author Email : sps_jadon@yahoo.co.in
DOI : http://dx.doi.org/10.13005/ojc/310222
Article Received on :
Article Accepted on :
Article Published : 18 Jun 2015
On the basis of the results of instrumental analysis, it may be predicted that the adduct is good conductor, paramagnetic in nature having triclinic geometrical packing of the molecule.
KEYWORDS:Characterization; geometrical; synthesized and reported
Download this article as:| Copy the following to cite this article: Gupta A, Gupta G. K, Jadon S. P. S. Characterization of Hexahydroxycyclotriphosphazene Salicylate; Epr, Nmr, Xrd Spectra. Orient J Chem 2015;31(2). |
| Copy the following to cite this URL: Gupta A, Gupta G. K, Jadon S. P. S. Characterization of Hexahydroxycyclotriphosphazene Salicylate; Epr, Nmr, Xrd Spectra. Available from: http://www.orientjchem.org/?p=9300 |
Introduction
A few of the adducts of [NP(OH)2]3 with organic acids have been synthesized and reported.1-6 U.V., E.P.R., 1HNMR and XRD investigations of hexahydroxycyclotriphos-phazene salicylate are being reported here with.
Experimental
[NP(OH)2]3 was prepared by the reaction of NaOH on (NPCl2)3 synthesized,7 in non aqueous solvent. The white mass formed was refluxed with salicylic acid in presence of 1 ml conc. H2SO4 in alcohol used as solvent. Perken Elmer 15 PC (200 nm – 800 mn), Varian’s X-E-4 band (RT), Bruker DRX-300 spectrometer (RT) were used to record subsequently for U.V., E.P.R. and 1HNMR spectra. For XRD PW – 1710, X-ray powder differectometer was used (l = 1.5418Å, CuKa as source of radiation) in the 2q range 0o – 80o.
Results and Discussion
Hexahydroxycyclotriphosphazene salicylate has been formulated as P3N3[(CO)3O6(C6H4)3], on the basis of its quantitative8 estimation, mass and I.R. spectrum as reported (loc. cite). The three bands at 210, 225, 305 nm have appeared in its U.V. spectrum. The band at 210 nm = 5.9 ev is due to the ionic environment or charge transfer transition, while the remaining bands are corresponding to π→π* transition9 due to the double bond in adduct. The low values of band gap energy, ΔEg = 0.1965, 0.723 ev and high value of number of conducting electrons, Nc = 2.1931 x 10⁵ and 4.3979 x 10⁵ indicate the good conductive nature of the adduct.
The hyper fine peaks in its E.P.R. spectrum10 suggests the paramagnetic character of the adducts. The two prominent peaks (fig. 1) of high intensity selected for calculations. The values of gz > 2 indicate the presence of covalent bonding along with the ionic bonding as referred by the low values of gx = gy < 2 as suggested by its the U.V. spectrum.
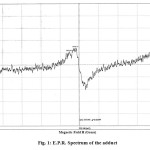 |
Figure1: E.P.R. Spectrum of the adduct |
The values of magnetic moment, meff 1.6944, 1.6587 B.M. and magnetic susceptibilities, xA = 1.1966 and 1.1467 x 10⁻³ e.s.u., also infer the paramagnetic character of the adduct, having one unpaired electron on its oxygen atom predicting that during the reaction H+ of [NP(OH)2]3 has reacted in presence of conc. H2SO4 and reacted with OH– of salicyclic acid with the elimination of H2O molecule and forming hexahydroxycyclotriphosphazene salicylate. The peaks have divided into three parts repeating successively, suggesting that three molecule of salicylic acid have reacted with one molecule of [NP(OH)2]3 as follows:
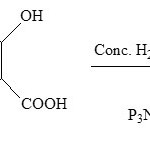 |
Scheme 1 |
1HNMR spectrum (fig. 2) of the adduct possess four sets of signals, out of which four signals, a set in the range of chemical shift, δ6.677 – δ8.103 ppm are due to two parallel P-N bands linked with other P-N band of the P3N3 ring showing the two signals at the chemical shift, δ8.636 and δ8.949 ppm. The
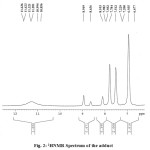 |
Figure2: 1HNMR Spectrum of the adduct
|
three signals in the range of chemical shift, δ2.184 – δ6.329 ppm are according to the H atoms of three C6H5 groups linked differently to P3N3 ring. Again a broad signal of low intensity at the chemical shift, δ10.856 to δ11.636 ppm is for the P-N ring. Thus from the 1HNMR spectrum, it is clear that three salicylic molecules have linked to one P3N3 ring through oxygen atoms differently as shown by its structure (fig. 3).
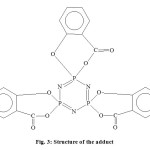 |
Figure3: Structure of the adduct |
The values of interplaner distance d, calculated11 (table -1) from its XRD are very much close to theoretical values. The values of sin2Φ, and milar index, hkl alongwith the axial ratios and axial angles were calculated. The values of axial ratios, a0 = 3.3128 Å, b0 = 1.5615 Å, c0 = 9.6938 Å and axial angles a = 108.44o, β = 153.44o and γ = 90.01o inferred the triclinic geometrical packing of the molecule in the adduct.
Table1: XRD Patter of the adduct
|
S. No. |
2q (degree) |
Sin2q |
q(h2 + k2 + l2) |
hkl |
d(Å) |
|
|
Obs. |
Theo. |
|||||
|
1. 2. 3. 4. 5. 6. 7. 8. 9. 10. 11. 12. |
7.67 15.33 21.67 23.00 25.83 30.33 32.00 36.83 42.50 47.83 50.67 64.00 |
0.00447 0.01779 0.03533 0.03974 0.04995 0.06843 0.07597 0.09979 0.13136 0.16220 0.18310 0.28081 |
0.00447 x (1) 0.00444 x (4) 0.00441 x (8) 0.00441 x (9) 0.00454 x (11) 0.00488 x (14) 0.00446 x (17) 0.00453 x (22) 0.00452 x (29) 0.00450 x (36) 0.00446 x (41) 0.00453 x (62) |
100 200 220 221 311 321 322 332 432 442 443 732 |
11.5317 5.7811 4.1016 3.8671 3.4492 2.9474 2.7971 2.4407 2.1272 1.9032 1.8015 1.4548 |
11.516 5.7748 4.0974 3.8635 3.4462 2.9443 2.7944 2.4382 2.1252 1.9000 1.8000 1.4535 |
qavg = 0.05415
a0 = 3.3128 Å, b0 = 1.5615 Å, c0 = 9.6938 Å, a = 108.44o, β = 153.44o, g = 90.01o
Acknowledgement
Authors are thankful to the Director C.D.R.I. Lucnow, Director SAIF, Punjab University, Chandigarh, Director SAIF, IIT Bombay, Director ACMS IIT Kanpur to provide instrumental facilities
References
- Rani, I.; Jadon, S.P.S. Asian J. Chem., 2008, 20(7), 5711-5716.
- Rani, I.; Jadon, S.P.S. Int. J. Chem. Sci., 2008, 6(2), 519-525.
- Gupta, A.; Jadon, S.P.S. Int. J. Chem. Sci., 2009, 7(4), 2867-2871.
- Gupta, A.; Jadon, S.P.S. Int. J. Chem. Sci., 2012, 10(1), 159-165.
- Gupta, A.; Jadon, S.P.S. RJPBCS, 2012, 3(4), 11-19.
- Gupta, A.; Jadon, S.P.S. Am. Int. J. Formal Appl. Sci., 2014, 7(1), 97-105.
- Jadon, S.P.S. Asian J. Chem., 2003, 15, 151; 2005, 17, 1312.
- Vogel, A.I. A Text Book of Quantitative Inorganic, Longman, London, 1961.
- Figgis, B.N. Introduction to Ligand Fields, Wiley Eastern Limited, New Delhi, 1976.
- Pake, G.E. The physical principles of electron paramagnetic resonances, W.A. Binjamin, Inc., 1973.
- Woolfson, M.M. An Introduction to X-ray Crystallography, Vikas Publishing House Pvt. Ltd., Cambridge University Press, 1978.

This work is licensed under a Creative Commons Attribution 4.0 International License.
About The Author
![]()
A New Edition of Web of Science
Journal Impact Factor
2022: 0.5
Five Year: 0.8
Journal is Indexed in

Cabells Whitelist
![]()


