Adsorption of 2-picoline and 3-Amino-2-picoline onto kaolin and organo-modified kaolin
Saeedeh Hashemian*, Yalda Parsaei
Islamic Azad University, Yazd Brunch, Chemistry Department, Yazd, Iran. Corresponding author; Sa_hashemian@yahoo.com
DOI : http://dx.doi.org/10.13005/ojc/310268
Article Received on :
Article Accepted on :
Article Published : 26 Jun 2015
The adsorption of 2-picoline (PC) and 3-Amino-2-picoline (APC) onto kaolin and organo-modified kaolin was investigated. Tetraethylamoniumiodide (TEAI) was used as modification reagent. The sorbent was characterized by FTIR, XRD, SEM and BET methods. The influence of various parameters like contact time, PH, adsorbent dose and initial concentration of PC and APC was studied. The adsorption kinetics, thermodynamic and isotherms were thoroughly examined. Results show that a pH value of more than 6 and contact time 60 min is favorable for adsorption. The dynamic data fit well with the pseudo- first-order kinetic model. Thermodynamic results revealed that the adsorption process is an endothermic and spontaneously process. The isothermal data could be well described by the Freundlich equation. The results indicate that kaolin/TEAI could be employed as low cost sorbent for removal of organic pollutant from water.
KEYWORDS:Adsorption; Kaolin; Organo–modified kaolin; 2-picoline; 3-Amino-2-picoline
Download this article as:| Copy the following to cite this article: Hashemian S, Parsaei Y. Adsorption of 2-picoline and 3-Amino-2-picoline onto kaolin and organo-modified kaolin. Orient J Chem 2015;31(2). |
| Copy the following to cite this URL: Hashemian S, Parsaei Y. Adsorption of 2-picoline and 3-Amino-2-picoline onto kaolin and organo-modified kaolin. Available from: http://www.orientjchem.org/?p=9531 |
Introduction
Natural clay minerals are well known compounds. The kinds of clays are largely used in industrial products such as ceramic, paint, coatings, water purification and drilling mud [1- 3].They are low cost, abundance in most continents of the word, high sorption properties and potential for ion exchange, therefore, clay materials are strong candidates as adsorbents [4, 5]. In recent years, there has been an increasing interest in utilizing clay minerals such as bentonite [6, 7] and kaolin [8, 9] to adsorb organic and inorganic molecules. The adsorption properties of clays can be improved by surface modification [10]. The replacement of inorganic exchange cations with quaternary alkylammonium derivatives makes clays mineral organophilic, with a high affinity for the adsorption of pollutant compounds from aqueous solutions [11, 12]. It was suggested that possible use of ammonium ions of the typeNH3R+, NH2R2, NHR3 and NR4+ throw more light on the mechanism of cation exchange in lay minerals. The R of alkyl hydrocarbon, occupy the exchange sites of clay and hence the surface area is increased [13].
2-picoline is a derivative of pyridine. 2-picoline is considered to be a hazardous chemical. Various industrial units manufacturing pyridine and its derivatives, pharmaceutical units, etc. discharge 2-picoline-bearing wastewaters [14]. Various physic-chemical and biological treatment techniques are suggested for the treatment of 2-picoline-bearing wastewaters.Adsorptionis relatively useful and economical for removal of pyridine derivative [15-17].
In this study, kaolin obtained from a local mine in IRAN (Yazd), was modified by tetra ethylamoniumiodide (TEAI). The 2-picoline (PC) and 3-Amino-2-picoline (APC) as models of pollutant adsorption properties were tested.
Experimental
Materials and methods
All the reagents used in the experiments were in analytical grade and were used without further purification. All the experiments were conducted at room temperature. The raw kaolin was obtained from local mine of Iran (tavansil. Co). Kaolin particle size fractions was180- 200 µm and it was crushed and dried at 150 ˚C in an oven for 5h prior to use.
The 2-picoline (PC), 3-Amino-2-picoline (APC) and tetra ethylamoniumiodide (TEAI) were purchased from Merck. The standard solutions of 1000 mg L-1 of PC and APC were prepared as stock solutions and subsequently whenever necessary, diluted.
The preparation process was carried out by dispersing of l0 g kaolin to a 100 mL of TEAI 1 mol L-1. The mixture was shacked for 3h at room temperature. The kaolin loaded with TEAI was filtered, washed repeatedly with copious amounts of distilled water, then dried in air and amend kaolin/TEAI (KT), stored for subsequent studies.
Adsorption studies were carried out in glass vessels with agitation provided by a shaker. The temperature was controlled at 25 °C by air bath. The suspensions containing 0.1 g sorbent and varying amounts of PC and APC were shaken on an orbital shaker at 150 rpm. For adsorption experiments, 50 mL PC and APC solution (7.5 mg L-1) and 0.1 g of KTsorbent were used. The effect of pH was studied by adjusting the pH of the solutions in the range of 2-12 with 0.1 N NaOH or HCl solutions. Samples for the kinetic study were taken at different time intervals. To evaluate the adsorption thermodynamic parameters, the effect of temperature on adsorption were carried out at 20-60 ºC. The amount of PC and APC adsorbed by sorbent was calculated by the following mass balance relationship:
% Adsorption =(C0 – Ce) / C0 × 100
Where, C0 and Ce are the initial and equilibrium solution concentrations of PC and APC (mg L-1).
Characterization method
IR measurements were performed by FT-IR tensor-27 of Burker Co., using the KBr pellet. UV-Vis spectrophotometer 160 A Shimadzu was used for determination of concentration of pyridine compounds contaminant. All pH measurements were carried out with an ISTEK- 720P pH meter. The specific BET surface area was measured at 77K by (Quanta chrome, Autosorb-1). The elemental analysis performed by an elemental Costech- ECS- 4010 apparatus. The powder X-ray diffraction studies were made on Philips PW3719 X-ray diffractometer by using Cu-Kα radiation of wave length 1.54060 Å.
Results and discussion
Characterization of KT sorbent
The FIIR Spectrum is generally used to identify some of the characteristic functional groups capable of absorbing organic. For comparison the FTIR spectra of kaolin and Kt samples are included. In order to obtain complementary evidence for the intercalation of quaternary alkyl ammoniumcations into the silicate lattice, FTIR spectra were recorded in the region 400-4000 cm-1.Fig. 1. Show the FTIR of kaolin and kaolin/TEAI (KT).
The absorption band at 3600-3700 cm-1 is due to stretching vibrations of structural OH groups. The band at 1119 and 797 cm-1are assignedto Si asymmetrical stretching. A pair of strong bands 2900 and 3004 cm-1 were observed only on the KT; they can be assigned to the symmetric and asymmetric stretching vibrations of methylen group νCH2[4]. This band is not observed in kaolin.
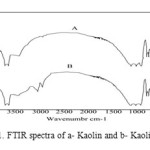 |
Figure1: FTIR spectra of a- Kaolin and b- Kaolin/TEAI |
The elemental analyses of kaolin and KT are presented in Table 1. The content of C, H and N in KT was increased by the modification of TEAI on the kaolin. In particular, the presence of carbon and nitrogen in the KT confirm the presence of TEAI onto kaolin.
Table1: Elemental analysis of kaolin, TEAI and KT
|
samples |
% C |
H % |
% N |
|
K |
0 (0) |
0.8 |
0 |
|
TEAI |
38.2 |
7.9 |
5.4 |
|
K-TEAI |
5.8 |
2.5 |
1.3 |
The XRD patterns of the kaolin and KT are shown in Fig. 2. XRD patterns indicated the presence of free quartz in kaolin. The kaolin and KT diffraction pattern show intense peak at 2 θ angle of 26.6˚ assigned to quartz (Si3O6). The XRD patterns of KT shows reflections characteristic for both kaolin and KT, but at lower intensity which clearly indicates the presence of TEAI, which has not been removed by washing. It is important the main phase of kaolin (quartz) has not any change after loading with TEAI. Results of XRF analysis are shown in Table 2.
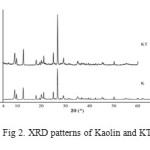 |
Figure2: XRD patterns of Kaolin and KT |
Table2: XRF analysis of kaolin and Modified Kaolin with TEAI
|
Compound Name |
Formula |
Modified Kaolin |
Kaolin |
|
Quartz |
SiO2 |
35.7 |
31 |
|
Pyrophyllite |
Al2Si4O10(OH)2 |
12.2 |
22 |
|
Muscovite |
KAl2Si4AlO10(OH)2 |
– |
20.5 |
|
Clinochlore |
Mg₅Al(Si,Al)₄O₁₀(OH)₈ |
10.3 |
– |
|
Kaolinite |
Al2Si2O5(OH)4 |
8.9 |
26.4 |
|
Illite-2 |
KAl₂(Si₃Al)O₁₀(OH)₂ |
32.9 |
– |
BET results of K and KT are shown in Table 3. The specific surface area of K and KT was 7.78 and 9.58 m2g-1 respectively. The surface area of kaolin increases with modification. The increase of the specific surface area indicated the innersurfaces and regions of the sorbentmay become more accessible for PC and APC. The increasing of surface area, is increased the sorption amount and increase the removal efficiency of PC and APC [12].
Table3: The BET results of Kaolin and modified Kaolin
|
Sample
|
Sample Wight(g) |
Mean Pore Diameter(nm) |
Total Pore Volume (Cm³gˉ¹) |
Area(m²gˉ¹) |
|
Kaolin |
0.1930 |
35.56 |
6.92 |
7.78 |
|
modified Kaolin |
0.2563 |
26.88 |
6.44 |
9.58 |
Effect of contact time
The effect of contact time on removal of PC and APA onto kaolin and KT is shown in Fig. 3.The adsorption of PC and APA occurred very quickly from the beginning of the experiments. This may be indicative of chemical adsorption. Maximum adsorption of PC and APC onto KT was observed at 60 min(70%); it can be said that beyond this there is almost no further increase in the adsorption and it is thus fixed as the equilibrium time. For adsorption onto kaolin maximum adsorption of PC and APC was attained at 80 min (35%). As can be seen from the figures, when the equilibrium time increased, the amount of adsorption was not dramatically increased.
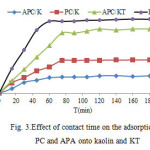 |
Figure3: Effect of contact time on the adsorption of PC and APA onto kaolin and KT |
Effect of pH
The pH is the most important factor affecting the adsorption process. To study the influence of pH on the adsorption of kaolin and KT, experiments were performed using various initial pHs varying from 2- 12. The uptake of PC and APC increased with increasing pH from 2-6. (see Fig. 4). It was observed that the adsorption is highly dependent on the pH of the solution, which affects the surface charge of the adsorbent and degree of ionization and speciation of the adsorbate. The high adsorption capacity is due to the strong electrostatic interaction between the PC and APC and sorbents. This could be explained by the fact that at low pH, more protons will be available to protonate the amine and NH groups of PC and APC, reducing the number of binding sites for Adsorption; therefore the adsorption of PC and APC is governed by electrostatic interaction [18].
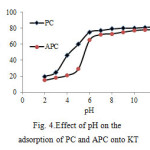 |
Figure4: Effect of pH on the adsorption of PC and APC onto KT |
Effect of initial concentration of PC and APC and amount of sorbent
The effect of initial concentration of PC and APC is shown in Fig. 5a. It is found that the PC and APC sorption increases with an increase in concentration to 8× 10⁻⁴ M. It is attributed to the increase in the mass transfer driving force on account of an increase in C0 [19]. Fig. 5b. Show the results of effect of sorbent dose on the sorption process. The experiments carried out using 30 mL of PC and APC. Removal efficiency increased up to 70%at 0.1 g KT and then, remained constant regardless of increasing in the adsorbent dose. Positive correlation between adsorbent dose and removal efficiency of PC and APC is related to increasing surface area of available exchangeable sites [8, 20]. At KT composite more than 0.1g, the incremental PC and APC removal is very small, because particle-particle interaction such as aggregation at higher mass of sorbent leads to a decrease in the availability of total surface area of the sorbent.
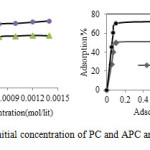 |
Figure5: Effect of a-initial concentration of PC and APC and b- amount of sorbent |
Kinetic of adsorption
In order to predict adsorption kinetic models of PC and APCsolutions, pseudo-first order and pseudo-second-order kinetic models were applied to the data.
The results of the kinetics experiments of sorption at 25 °C are shown in Fig. 6.
The rates of PC and APC sorption were determined by testing pseudo-first order and pseudo-second-order kinetic models.
The pseudo-first order model assumes that the rate of change of solute uptake with time is directly proportional to difference in saturation concentration and amount of solid uptake with time [21].
lnqt = k1 t –ln qe (1)
Where qe and qt are the amounts of PC and APC adsorbed per unite mass of the adsorbent (mg g-1) at equilibrium and time t, respectively and k1 is the rate constant of adsorption (min-1). When lnqt was plotted against time, a straight line should be obtained with a slope of k1, if the first order kinetics is valid.
The pseudo-second order model as developed by Ho and McKay [22] has the following form:
t/ qt = t/qe + 1/(k2qe2) (2)
Where qeand qt represent the amount of PC and APC adsorbed (mg g-1) at equilibrium and at any time. k2 in the rate constant of the pseudo-second order equation (g mg–1 min-1). A plot of t/q versus time (t) would yield a line with a slope of 1/ qe and an intercept of 1/ (k2qe2), if the second order model is a suitable expression. The kinetic model with a higher correlation coefficient r2 was selected as the most suitable one.
It was found that application of pseudo-first order kinetics provides better correlation coefficient of experimental data than the pseudo -second order model for adsorption of PC and APC onto KT composite. The good correlation coefficients were obtained by fitting the experimental data to Eq (1), indicating that the adsorption process of PC and APC onto KTis pseudo-first order. The rate constant of PC and APC are 2.04 × 10⁻² and 2.09 × 10⁻², respectively.
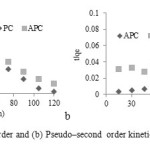 |
Figure6: (a) pseudo–first order and (b) Pseudo–second order kinetics for adsorption of IC on |
Thermodynamic studies
The thermodynamic parameters such as change in standard free energy (ΔG°), enthalpy (ΔH°) and entropy (ΔS°), were determined by using the following equations and are given in Table 4.
KC= CA / CS (3)
ΔG° = –RT ln KC (4)
Ln KC = ΔS°/R – ΔH° (5)
Where, KC is the equilibrium constant, CA is the amount of PC and APC (mg) adsorbed on the adsorbent per dm3 of solution at equilibrium, and CS is the equilibrium concentration (mg dm-3) of PC and APC in the solution. T is the solution temperature (K) and R is the gas constant. ΔH° and ΔS° were calculated from the slope and intercept of van ,t Hoff plots of ln KC vs 1/T. The results are listed in Table 4. The results are shown, when the temperature increased from 25 to 70 °C, ∆G0 is decreased. It is indicating the adsorption was spontaneous and favorable at high temperatures.
The positive values of the standard enthalpy change (ΔH°), which are 4.06 and 5.02 for PC and APC; indicate that the interaction of PC and APC molecules with clay is endothermic in nature. In addition, the standard enthalpy change is lower than 40 KJ mol-1, indicates that the adsorption is involving weak forces of attraction [13].
Table4: Thermodynamic parameters of PC and APC adsorption onto KT
|
∆S0 (J.mol-1.k-1) |
∆H0(KJ mol-1) (J.mol-1) |
∆G0(KJ mol-1) (KJ.mol-1 |
Kc |
T (K) |
|
|
27.61 |
4.06 |
-4.9× 10⁻² |
1.02 |
298 |
|
|
-1.7×10⁻¹ |
1.07 |
303 |
|||
|
-1.05 |
1.25 |
313 |
PC |
||
|
-1.09 |
1.5 |
323 |
|||
|
-1.73 |
1.87 |
333 |
|||
|
-2.61 |
2.5 |
343 |
|||
| 32.4 positive vvvv | 5.20 |
-0.65 |
1.3 |
298 |
|
|
-0.774 |
1.36 |
303 |
APC |
||
|
-0.966 |
1.45 |
313 |
|||
|
-1.27 |
1.63 |
323 |
|||
|
-1.78 |
1.9 |
333 |
|||
|
|
-2.48 |
2.2 |
343 |
Adsorption isotherm studies
Adsorption capacity and adsorption behavior of PC and APC on KT can be illustrated by adsorption isotherm. Data from the adsorption isotherms were modeled using the Langmuir and Freundlich isotherm models with the resulting isotherm constants presented in Table 5.
The Langmuir isotherm theory is based on the assumption of adsorption on a homogenous surface. The Langmuir equation can be written in the following form:
qe= qmKLCe/( 1+KLCe) (6)
The linearized form of Langmuir can be written as follows (Fig. 7):
Ce / qe= 1/ qm KL + Ce / qm Where qe is the
solid phase equilibrium concentration (mg g-1); Ce is the liquid equilibrium concentration of PC and APC in solution (mg L-1); KL is the equili1ium constant related to the affinity of binding sites (L mg-1); and qm is the maximum amount of the sorbate per unite weight of adsorbent for complete monolayer coverage.
The Freundlich isotherm describes adsorption where the adsorbent has a heterogeneous surface with adsorption sites that have different energies of adsorption. The energy of adsorption is varies as a function of the surface coverage (qe) and is represented by Freundlich constant KF (L g-1) in Eq. 8.
qe= KF Cem(8)
Where KF is roughly an indicator of the adsorption capacity and n is the heterogeneity factor which has a lower value for more heterogeneous surfaces.
In most references, Freundlich adsorption Equation (8) may also be expressed as Equation (9) (see Fig. 8):
lnqe = ln KF + 1/n ln Ce (9)
All the correlation coefficient, R2 value and the constants obtained for the models from Table 5 show that the Freundlich isotherm was suitable equation to describe the adsorption equilibrium of PC and APC onto KT.
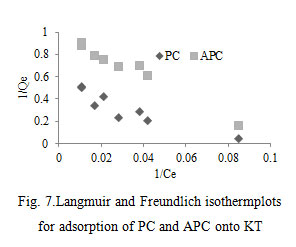 |
Figure7: Langmuir and Freundlich isothermplots for adsorption of PC and APC onto KT |
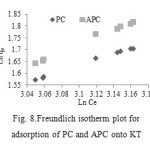 |
Figure8: Freundlich isotherm plot for adsorption of PC and APC onto KT |
Table5: Langmuir and Freundlich isotherm constants for adsorption of PC and APC onto KT
|
Sorbent(KT)
|
Langmuir model |
Freundlich model |
||||
|
qm (mg g-1) |
Kl (L mg-1) |
R2 |
KF (L/g) |
n |
R2 | |
|
PC |
1.984 |
0.085 |
0.826 |
0.735 |
0.833 |
0.997 |
|
APC |
1.522 |
0.072 |
0.89 |
0.724 |
0.824 | 0.988 |
Conclusion
The surface of raw kaolin is not more effective adsorbent for the removal of organic compounds from aqueous solution. However, kaolin may be modified with organic cations (TEAI) in a manner that significantly improves its capability of removing contaminants from water. The adsorption of PC and APC from aqueous solution using organo-kaolin was investigated. The results of present investigation indicate the kaolin modified by TEAI has suitable adsorption capacity for removal of PC ad APC from aqueous solution. Kinetic data of adsorption were fitted by the pseudo-first-order kinetic model. Thermodynamic constants were also evaluated using equilibrium constants changing with temperature. The negative value of ∆G0 indicated spontaneity and the positive values of ∆H0 showed the endothermic nature of adsorption, respectively. The Freundlich adsorption isotherm was found to have the best fit to the experimental data.
References
- Darvishi,Z.;Morsali, A,;Colloids Surf. A: Physicochem. Eng. Aspects, 2011, 377,15-19.
- Zhang, D.; Zhou. C. H.;Appl. Clay Sci.2010, 50, 1-11.
- Matuik, J.;Stodolak, E.; Bahranowaski, K.; Appl. Clay Sci.2011, 51, 102-109.
- Atta, A.Y.;Jbril, B. Y.; Appl. Clay Sci.2012, 61, 8-13.
- Resmi, G.; Thampi, S. G.;Chandrakaran, S.;Environ. Technol. 2012, 33 (1-3), 291-297.
- Hashemian, S.;Main group Chem.2007, 6 (2), 97-107.
- Hashemian, S.;African J. Biotechnol. 2010, 9 (50), 8667-8671.
- Hashemian, S.; Main Group Chem. 2011, 10, 105-114.
- Hmdikaraoglu, M.; Dogan, M. D.;Alkan, M.;Desalination,2010, 256, 154-165.
- Vidal, N.;Volzone, C.;Mater. Res.2012, 15 (6), 944-954.
- Lee, S. M.;Tiwari, D.; Appl. Clay Sci.2012,59-60, 84 -102.
- Ma, J.; Zhu, L.;J. Hazard. Mater. B. 2006, 136, 982-988.
- SafaOzcan, A.; Erdem, B.;Ozcan, A.;J. Colloid Inter. Sci. 2004, 280, 44-54.
- Srivastava, V. C.;Mall, I.D.; Mishra, I. M.; J. Hazard. Mater.2006,134(1-3), 257-267.
- Mohan, D.; Singh, K.P.;Ghosh, D.;Environ. Sci. Technol. 2005, 39 (13), 5076-5086.
- Lataye, D. H.; Mishra, I. M.; Mall, I. D.; Chem. Chem. Eng. J.2008, 138, 35-46.
- Hashemian, S.; Mirshamsi, M.; J. Indust. Eng. Chem.2012, 18,2010-2015.
- Li, G. Y.;Jiag, Y. R,;Colloid and Surfaces A: Physicochem. Eng. Aspects.2008, 320, 11-18.
- Hashemian, S.; Foroghimoqhadam,A.;Chem. Eng. J.2014, 235: 299-306.
- Hashemian, S.;Salimi, M.;Chem. Eng. J.2012, 188, 57-63.
- Lagergren, S.;Handlingar,1898,24, 1–39.
- Ho, Y.S.; McKay, G.; J. Chem. Eng,1998, 70, 115–124

This work is licensed under a Creative Commons Attribution 4.0 International License.
![]()
A New Edition of Web of Science
Journal Impact Factor
2022: 0.5
Five Year: 0.8
Journal is Indexed in

Cabells Whitelist
![]()


