Study of Potassium Hydrogen Tartrate Unseeded Batch Crystallization for Tracking Optimum Cooling Mode
1Department of industrial organic chemistry, USTO, POB 1505 El Mnaouar Oran, Algeria
2Department of physical chemistry, USTO, POB 1505 El Mnaouar Oran, Algeria
3Laboratory of modeling and optimization of industrial systems (LAMOSI), USTO, Algeria
4laboratory of environmental process and engineering, ISVV, Bordeaux, France.
DOI : http://dx.doi.org/10.13005/ojc/310127
Download this article as:
![]()
The crystallization of organic compounds from solutions is responsible for the majority of organic solid materials produced by the chemical industry. A great deal of research carried out up to now, focused on batch crystallization modeling, simulation, optimization and control. This work aims to obtain the optimal cooling temperature strategy of a batch crystallizer made in our laboratory. Experiments were achieved to find out under our crystallizer constraints the maximum of the total volume of cream tartar crystals and the best crystal size distribution from aqueous solution without seeding. In our present study, the potassium hydrogen tartrate (cream of tartar) subject of our study is recovered from wine tartar, a solid byproduct of wine making using several successive cooling crystallization operations with water as solvent. For the firsts crystallizations we principally interested by the maximization of the yield and the optimization of time and energy. We compared the results of some cooling strategy; optimum cooling mode corresponds to the case in which final temperature of the crystallizer is reached at much faster rate as compared to other cooling modes. The final temperature of 12 °C is reached within 30 minutes. This optimum mod shows a typical cooling curve found in industrial practice derived from a constant refrigeration of the cooling bath. The potassium bitaratrate particle size distribution was characterized by Malvern laser particle size analyzer. The crystal yield increased as the final crystallizer temperature decreased, however, only small differences in terms of crystal properties were observed.
KEYWORDS:Cooling batch crystallization; Temperature profile; Potassium hydrogen tartrate; Optimization
Introduction
Potassium hydrogen tartrate is commonly called as cream of tartar. It is an acid salt found as sediments (wine tartar) in the wine fermentation stage. This white odorless powder is an important byproduct of winemaking recovered is wine tartar considered as a solid waste. After wine tartar purification using crystallization process, cream of tartar yields a white crystalline powder mainly used in cooking and cleaning. Cream of Tartar powder is now available in any supermarket. The crystallization process plays an important role in many chemical processes. It is widely used as finishing stage, which means the separation and the purification of the final organic or inorganic product. As in the studies about adipic acid crystallization [1], KCl unseeded batch crystallization [2], crystallization of oxalic acid in batch cooling crystallizer [3], dihydroxystearic acid crystallization [4] and optimization of α-lactose monohydrate seeded batch cooling crystallization [5]. The crystallization process can generally be operated in continuous and batch operation modes. The batch process is preferred, if the production rate is low or the equipment may be used to produce several different products. Batch cooling crystallizers present the advantage of being simple, flexible, requiring less investment and involving less process development. However, compared to continuous process, the batch process yields poor quality product with smaller crystal size according to Bakir T. (2006) [6]. Also, final crystal products can change from batch to batch making this operation more complicated worth for to study. The crystallization can be represented as a transfer of the molecules from the continuous phase (solution) to the solid phase. This phenomenon is governed by the nucleation and growth rates (Crystallization kinetics). Some experimental and theoretical studies of cooling batch crystallization were widely used to investigate optimal cooling strategies [7-10] and their effect on the final particle size distribution (PSD) of the product [11, 12].
Research works on batch crystallizers, were mainly focused on the control of cooling. The behavior of the crystallizer includes some problems such as inconsistencies of batch-to-batch in terms of the size and number of crystals produced. The purity profile (residual impurities in crystals, or wrong polymorph or chiral purity). This can have a significant impact both on product quality and downstream process unit operations including filtration, drying, milling, and product formulation. Barret et al. [13] suggested that, these problems can be avoided by the use of in-situ crystallization characterization. Thus, several works are devoted and use the on-line control [14-16].
The cream of tartar crystals are marketed as a final product, that because crystal size distribution must be under control. In our present study the operation time and the final temperature are set in the same interval, for all types of the cooling strategies in order to compare the results of various cooling strategy. And at last, we find an optimal cooling strategy in terms of crystallizer cooling temperature for maximizing the total volume of crystal of cream of tartar from aqueous solution without seeding.
Experimental
Experiments were carried out in a 3 l. jacketed crystallizer made of glass, with jacket for cooling. The schematic diagram of the experimental set up is shown in fig. 1. The crystallizer has a diameter of 380 mm a height of 240 mm. The experimental set up consists of a cooling bath provided with a coil connected at a refrigerating plant in a closed system provision at cooling temperature 5°C. The crystallizer consists of filtration funnel (3 liters) (1) an agitator (2), a jacket fluid (3) and Rushton turbine having a diameter of 200 mm (4). The agitator is placed 20 mm from the bottom of the crystallizer. Two baffles of 100 mm were installed opposite to each other to avoid vortex formation and good mixing. Desired temperature in the crystallizer is achieved by setting appropriate temperature in the control unit of circulation bath. Temperature in the jacket and the crystallizer was tracked with a PT100 temperature sensor monitored by PC.
By referring to solubility data of Table.1 a saturated solution of cream of tartar was prepared with distilled water in the temperature range 85-100°C. After dissolving all the raw material (crushed tartar) or crystallized cream of tartar, the hot solution was filtered in a Buckner funnels under vacuum to remove insoluble impurities. The vacuum funnel filtration (3 liters) with the hot filtrate was introduced in the cooling water bath and fixed. The agitator was introduced in the funnel with the constant stirring speed 300 rpm.
The experiments started by cooling the solution at different cooling rates as required for the experiment without adding seeds. The total suspension was withdrawn at the end of the experiment and filtered in a Buckner funnel under vacuum.
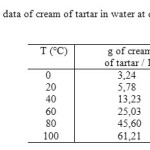 |
Table1: Solubility data of cream of tartar in water at different temperatures Click here to View table |
The product was dried in an air oven and its mass was obtained using an electronic balance. Then, its size distribution was measured by Malvern Mastersizer 2000 using saturated alcohol / tween-20 (1/6 vv) as the carrier fluid. The experiments were conducted by covering different temperature profiles as shown in fig. 2. The temperature data were scanned every 10 s during the batch. The parameters covered in the present study are detailed in Table 2.
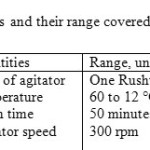 |
Table2: parameters and their range covered in the present study Click here to View table |
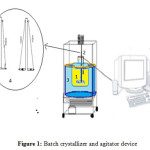 |
Figure1: Batch crystallizer and agitator device |
Results and Discussion
It is known that the crystal properties are affected by the crystallization temperature and the initial cooling rate. Controlled cooling crystallization requires very low supersaturation rate and hence very low cooling rate in the early stage of crystallization. But the first constraint in our experiments is the hot filtration to remove insoluble impurities after dissolving cream of tartar. The hot solution is rapidly filtered in a Buckner funnel under vacuum at laboratory temperature. During this difficult operation the temperature decreases from 80°C to 60 ° C and therefore crystals appear. In order to assess the crystallization characteristics of our crystallizer, experiments for producing cream of tartar crystals are carried out with the following simple cooling modes (Figure 2):
Mode A: Cooling at room temperature with stirring.
Mode B: Cooling with stirring at room temperature do 35°C then at 12°C in the cooling bath with continuous refrigeration.
Mode C: Cooling with stirring at room temperature do 50°C then at 12°C in the cooling bath with continuous refrigeration.
Mode E: Introducing directly the crystallizer in the cooling bath set at 17°C.
Mode F: Introducing directly the crystallizer in the cooling bath set at 12°C.
All crystallization modes of cream of tartar were conducted without seeding and the stirring rate was constant 300 rpm using a motor of 1.5 Kw / h with a reducer. The agitator is a simple Rushton turbine with two modular blades to allow insertion in the crystallizer (3 l. filtration funnel) (Figure 3). There was no significant breakage of the crystals.
For quality estimation, the obtained product was analyzed by pH-meter; some samples were titrated with aqueous solution of KOH (0,01N). Fig. 2 shows the titration curves of the filtrate in the cool filtration stage (1), the extracted cream of tartar (obtained crystals) (2) and the raw material (wine tartar) solution (1g/l) (3).
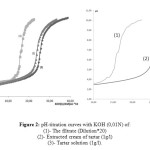 |
Figure2: pH-titration curves with KOH (0,01N) of: (1)- The filtrate (Dilution*20) (2)- Extracted cream of tartar (1g/l) (3)- Tartar solution (1g/l). Click here to View figure |
Owing to successive dissociations, the titration curve of the diprotic tartaric acid has two equivalence points with pKa1 = 3.306 and pKa2 = 4.366. As shown in figure 3 the first acid~base reaction of the tartaric acid is absent. In the extracted cream of tartar, all present tartaric acid in the sample is in the hydrogen tartrate form. However, the filtrate titration curve (1) clearly shows the traces of other wine acids. So, the successive cream of tartar crystallizations aid in the elimination of the majority of wine acids in their salts or free forms. On the other hand potassium bitartrate is more soluble than calcium tartrate in water at 85-100 °C.
As shown in fig. 3, to investigate the influence of the cooling profile on the product quality and the crystal distribution size, five different cooling modes were employed to cool down 3 l. of cream of tartar solution supposed saturated (180 g of cream of tartar in 3 liters of water) from 70 ◦C to 12 ◦C during 35 minutes. The choice of the final crystallizer temperature is based on the performance of the crystallizer and order time minimization. Unfortunately, the difference is not very significant in the temperature range (20 – 5 ° C), compared to solubility data (Table1). The curve cooling mode E corresponds to the case in which final temperature of the crystallizer is reached at much faster rate as compared to other cooling modes. The final temperature of 12 °C is reached within 30 min. this mod shows a typical cooling curve found in industrial practice derived from a constant refrigeration of the cooling bath. The linear and controlled cooling strategies can be calculated using the equation derived by Nyvlt [17]. The cooling strategy can be obtained by alternatively switching off the refrigerating plant. The controlled cooling mode corresponds to slower cooling rate during the initial stages and faster cooling in the later stages. The cooling modes B and C are tend to approach the ideal controlled cooling mode. But in our case is it requires more care in the hot filtration step.
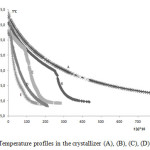 |
Figure3: Temperature profiles in the crystallizer (A), (B), (C), (D) and (E). Click here to View figure |
Thus, this ideal cooling is impossible to implement because we have neither the necessary control hardware nor the necessary high cooling capacity required. However the linear cooling mode which corresponds to constant rate of cooling from the beginning to the end can be achieved using our crystallizer and the cooling mod D is closer to linear cooling profile.
Fig.4 compares the crystal size distribution of all the above different cooling modes. The crystal size distribution was measured by Malvern Mastersizer 2000 using saturated alcohol / tween-20 (1/6 vv) as the carrier fluid. It can be observed, that a narrow crystal size distribution and higher mean size can be obtained for cooling mode E as compared to the other cooling modes.
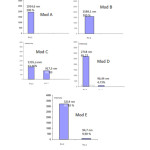 |
Figure4: Particle size distribution using different temperature profiles cooling temperature
|
Owing to the imposed agitation rate and the geometry of the crystallizer we think that several particles families are generated by secondary nucleation due to higher supersaturation in the early stages of the process, resulting in a product with a wide crystal size distribution and a large number of fines. Whilst, the fine particles generated by rapid cooling stick to the first crystal nucleation generated during the hot filtration as shown in Figure 5-a. Then when a supersaturated solution is in contact with particles of the crystallizing compound, secondary nucleation occurs. Particles collide with the stirrer blades, with the crystallizer walls and with each other; very characteristic for cream of tartar crystallization.
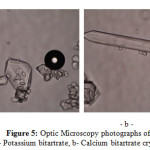 |
Figure5: Optic Microscopy photographs of: a- Potassium bitartrate, b- Calcium bitartrate crystal Click here to View figure |
The fig. 5-b represents a microscopic photograph (*40) showing the calcium tartrate crystal form. It is easily detectable by its brilliant eagle form. We notice very small amount of calcium tartrate in the all cream of tartar samples obtained by the different cooling modes implemented in our work. Analysis of products with optic microscopy was performed to give information about the crystal purity also the possibility of crystal particle size distribution calculation. Table 3 present the crystallizer performance according to the different cooling modes. Cooling mod E gives the maximum yield where the final crystallizer temperature (12°C) is reached during minimum batch time (30 min). This also minimizes the dissipated energy for cooling and stirring.
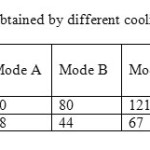 |
Table3: Total crystal mass obtained by different cooling modes in 30 min batch time. Click here to View table |
Conclusion
The study of batch cooling crystallization of cream of tartar using our home-made laboratory crystallizer was carried out covering different possible cooling modes under some constraints. The proposed experiments were easily implemented using simple tools. The cooling mod E gives the maximum yield where the final crystallizer temperature (12°C) is reached during minimum batch time (30 min). This optimum cooling mode corresponds to the final temperature of the crystallizer reached at much faster rate as compared to other cooling modes. It gives the maximum yield without seeding. This mod shows a typical cooling curve found in industrial practice derived from a constant refrigeration of the cooling bath. The performance of our 3 l. glass crystallizer operating under different cooling modes may be remarkably improved by varying the stirrer form and the agitation rate.
References
- Costa C. B.; Filho R. M. Chem. Eng. Process. 2005, 44, 737-754
- Mohameed H. A.; Abu-Jdayil B.; Al Khateeb M. Chem. Eng. Process. 2002, 41, 297–302.
- Srinivasakannan C.; Vasanthakumar R.; Iyappan K.; Rao P. G. Chem. Biochem. Eng. Q. 2002, 16, 125–129
- Abidin S. Z.; Feng Ling G. K.; Abdullah L. C.; Ahmad S., Yunus R.; Choong T. S. Y. Eur. J. of Sc. Res. 2009, 33, 471-479
- Linh T. T. Vu; Durham R. J.; Hourigan J. A.; Sleigh R. W., European Symposium on Computer Aided Process Engineering – 15 , Barcelona, Spain, mai 2004.
- Bakir T. Thèse de doctorat de l’Université de Claude Bernard, Lyon 1, 2006.
- Miller S.M.; Rawings J.B. AIChEJ, 1994, 40, 1312-1323
- Lang Y.; Cervantes A.M.; Biegler L.T. Ind. Eng. Chem. Res. 1999, 38, 1469-1485
- Zhang G.P.; Rohani S. Chem. Eng. Sci. 2003, 58, 1887-1899
- Aziz N.; Hussain M.A.; Mujtaba I. M. Comp. Chem. Eng. 2000, 24, 1069-1085
- Shi D.; EI-Farra N.H.; Li M.; Mhaskar P.; Christofides P.D. Chem. Eng. Sci. 2006, 61, 268-276
- Hojjati V.; Rohani S. Chem. Eng. and Proc. 2005, 44, 949–957
- Barrett P.; Smith B.; Worlitschek J.; Bracken V.; O’Sullivan B.; O’Grady D. Proc. Org. Proc. Res. & Dev. 2005, 9, 348-355
- Zhang G.P.; Rohani S. Chem. Eng. Sci. 2003, 58, 1887-1899
- Arpornwichanop A.; Kittisupakorn P.; Mujtaba I. M. Chem. Eng. Process. 2005, 44, 101-122
- Moscosa-Santillan M.; Bals O.; Fauduet H.; Porte C.; Delacroix A. Chem. Eng. Sci. 2000, 55, 3759– 3770.
- Nyvlt J. Collect. Czech. Chem. Commun. 1976, 41, 342– 349


![]()


