Synthesize and characterization of sawdust/MnFe2O4 nano composite for removal of indigo carmine from aqueous solutions
Saeedeh Hashemian*, Motaharah Hidarian
Islamic Azad University, Yazd Brunch, Chemistry Department, Yazd, Iran
DOI : http://dx.doi.org/10.13005/ojc/300434
Article Received on :
Article Accepted on :
Article Published : 31 Dec 2014
Sawdust/MnFe2O4 nano composite was prepared and characterized by FTIR, XRD, SEM and BET. The sawdust, MnFe2O4 nano particles and sawdust/MnFe2O4 nano composite were used for removal of indigo carmine (IC). The maximum percentage of adsorption of IC was found at contact time of 15 min and pH 2. The adsorption of IC followed by pseudo second order kinetic model. The experimental data of sorption isotherms analyzed with Langmuir and Freundlich isotherm. The adsorption of IC was best described by the Freundlich isotherm model. Thermodynamic results indicated that adsorption of IC is endothermic and spontaneous process. The reused sorbent can be regenerated and employed after 5 cycle with good efficiency.
KEYWORDS:Adsorption; Indigo carmine (IC); MnFe2O4 nano particle; Sawdust; Sawdust/MnFe2O4
Download this article as:| Copy the following to cite this article: Hashemian S, Hidarian M. Synthesize and characterization of sawdust/MnFe2O4 nano composite for removal of indigo carmine from aqueous solutions. Orient J Chem 2014;30(4). |
| Copy the following to cite this URL: Hashemian S, Hidarian M. Synthesize and characterization of sawdust/MnFe2O4 nano composite for removal of indigo carmine from aqueous solutions. Available from: http://www.orientjchem.org/?p=6400 |
Introduction
The indigo carmine (IC) is generated as a highly toxic dye, which may lead to tumors at the site of application. IC is an anionic dye and usually used in the textile, food and cosmetic industries. IC is also used for medical diagnostic purposes. Various attempts were done for removal of IC from water and wastewater. There are several methods for the reclamation of dyeing wastewaters. Various treatment techniques such as oxidation by ozone [1], Fenton [2], coagulation [3], electrochemical [4, 5], enzymes [6] and adsorption [7] were investigated. Adsorption can be a perfect treatment technique, because it has cost effective, high stability and no sludge residue. Therefore, sorption technique currently has proven to be an effective and attractive way for wastewater treatment. Also, this method would be inexpensive, because adsorbent materials are cheap and do not require any expensive additional pre-treatment step [8]. Agri–solid wastes such as oil palm fiber [9], banana stalk [10], hazelnut shells [11], tea waste [12-14] and peat [15] generally exhibit excellent adsorption characteristic for organic and inorganic pollutant. Sawdust is one of the most appealing materials among agricultural waste materials and it was used for removing pollutants such as, dyes, salts and heavy metals from water and wastewater. The sawdust consists of lignin, cellulose and hemicellulose, with polyphenolic groups playing important role for binding dyes through different mechanisms. Generally the adsorption takes place by complexation, ion exchange and hydrogen bonding [16-20]. Some of studies were shown that sawdust and modified sawdust have a sorption capacity for removal of most kinds of dyes from aqueous solution [21-24].
Magnetic adsorbents also can be used to adsorb dyes and contaminants from aqueous effluents. This is because magnetic particles possess not only strong adsorption activities, but also the property of being easily separated and collected [25-30].
In this study, sawdust, MnFe2O4 nano particles and sawdust/MnFe2O4 nano composite was prepared and characterized. Adsorption behavior of indigo carmine (IC) dye on sawdust/MnFe2O4 nano composite was studied. Optimum conditions for adsorption of IC were determined.
Experimental
Materials and Methods
The sawdust was collected from sawmill in Yazd (Eucalyptus tree), Iran. Sawdust was washed several times to remove stick dirt, rinsed carefully with distilled water and finally dried at 80 ˚C for 12 h.
Indigo carmine (IC) dye was purchased from Merck and was used without further purification. IC has C16H8N2Na2O8S2 formula. Chemical structure of IC is shown in Fig. 1. It has a molecular weight of 466.36 g mol-1. The solution of IC 1000 mg L-1 was prepared as stock solution and subsequently whenever necessary, diluted. The experiments have been carried out by agitation of known amount of sorbents in 30 mL of IC solution with an initial concentration 25 mg L-1 on rotary shaker at a constant speed of 150 rpm at room temperature (25 ˚C). IR measurements were performed by FTIR tensor-27 of Burker Co., using the KBr pellet. Samples were withdrawn at appropriate time intervals and centrifuged at 1000 rpm for 10 min. The absorbance of the IC was measured using a UV-Vis spectrophotometer 160 A Shimadzu. The effect of pH was studied by adjusting the pH of dye solutions in the range of 2–11 with 0.1 M NaOH or HCl solutions. To evaluate the adsorption thermodynamic parameters, the effect of temperature on adsorption were carried out at 20–50 ºC. All pH measurements were carried out with an ISTEK- 720P pH meter. Scanning electron microscopy was performed using a Philips SEM model XL30 electron microscope. The powder X-ray diffraction studies were made on Philips PW3719 X-ray diffractometer by using Cu-Kα radiation of wave length 1.54060 Å. Elemental analysis by atomic absorption spectrophotometry (AAS) was performed on a Shimadzu AA-6800. The specific surface area was measured by N2 adsorption–desorption isotherm and was obtained with an ASAP-2010 instrument (Micromeritics).
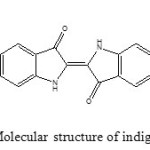 |
Fig1: Molecular structure of indigo carmine Click here to View figure |
Preparation of Mnfe2o4 and Sawdust/Mnfe2o4 Nano Composite
The MnFe2O4 nano particles were prepared by chemical co-precipitation method. 2 mmol of manganese (II) chloride and 4 mmol ferric chloride were dissolved in the distilled water and then under vigorous magnetic-stirring at 70 ˚C, NH3 solution (10 %) was added drop wise to raise the suspension pH to around 10 and the stirring was continued for 1 h. After being cooled, the prepared MnFe2O4 was repeatedly washed with distilled water and dried in an oven at 105 ˚C for 2h. Sawdust/MnFe2O4 nano composite was prepared as the same method. The amount of sawdust was adjusted to obtain sawdust/MnFe2O4 mass ratios of 1:10. The sawdust was added into a 50 mL solution containing manganese (II) chloride (2mmol) and ferric chloride (4 mmol) at 70 ˚C. Under vigorous magnetic–stirring and at 70 ˚C, NH3 solution (10%) was added drop wise to raise the suspension pH to around 10 and the stirring was continued for 1 h. After being cooled, the prepared magnetic composite was repeatedly washed with distilled water and dried in an oven at 105 °C [25, 28].
Results and Discussion
Characterization of Sorbents
Powder XRD patterns of sawdust, MnFe2O4 and sawdust/MnFe2O4 nano composite are shown in Fig. 2(a-c). Sawdust has amorphous structure, but the characteristic peaks were shown at 2θ of 16˚, 22˚ and 35˚. The characteristic peaks of MnFe2O4 were occurred at 2θ 31.8˚, 36˚, 45.5˚, 56.5˚, 75˚ and 84˚. This reveals that that the magnetic particles are pure MnFe2O4 with a spinel structure [28, 29]. The diffraction peaks sawdust/MnFe2O4 show the same characteristic peaks of both Sawdust and MnFe2O4 (16˚, 22.5˚, 31.8˚, 36˚, 45.5˚ and 56˚). This indicates that the sawdust joined with MnFe2O4 to form a nano composite particle and does not cause a phase change in the magnetic particles. From the peak width of MnFe2O4/Sawdust, a particle diameter of 10-15 nm was obtained according to the scherrer formula, which is consisted with the result from SEM (Fig. 4).
 |
Fig2: Powder XRD pattern of a- MnFe2O4, b- Sawdust, c- sawdust/MnFe2O4 nano composite
|
The FTIR spectra of Sawdust, MnFe2O4 and sawdust/MnFe2O4 nano composite are shown in Fig. 3. From Fig. 3-a, the broad band 3413cm-1 indicates the presence of both free and hydrogen bonded OH groups on the sawdust surface. The bands 2921 and 623 cm-1 are assigned to C=C Stretching frequencies. The peak around 1641 is attributed to hydrogen bending vibrations of water. From Fig.3-c, bands around 415 and 691 cm-1 show the presence of MnFe2O4 onto SD [31]. Therefore, FTIR of sawdust/MnFe2O4 indicated the presence of the same peaks appear in the Sawdust and MnFe2O4,which point to that the presence of MnFe2O4 on the surface of sawdust did not change its structure.
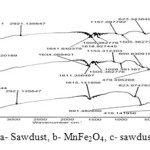 |
Fig3: FTIR a- Sawdust, b- MnFe2O4, c- sawdust/MnFe2O4
|
The surface structure of sorbents was analyzed by scanning electronic microscopy (SEM) Fig. 4a-c). The micrographs reveal clearly the porous nature of Sawdust and semi spherical structures of MnFe2O4. The SEM of sawdust/MnFe2O4 nano composite shows presence of MnFe2O4 pellet on the sawdust particles and formed the particle sized of 100 nm.
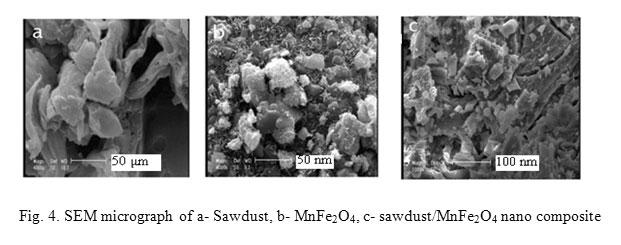 |
Fig4: SEM micrograph of a- Sawdust, b- MnFe2O4,c- sawdust/MnFe2O4 nano composite
|
EDX study of the sawdust shows the elemental composition of the adsorbent, which shows that sawdust has a high percentage of carbon (52.70%) and oxygen (48.58%). Based on the particle morphology, the material is suitable to be used as adsorbent. A variety of parameters for the characterization of sawdust, MnFe2O4 and sawdust/MnFe2O4 are presented at Table 1.
The EDX of sawdust/MnFe2O4 also showed the presence of Mn and Fe on the surface of sawdust.
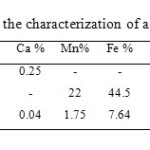 |
Table1: Various parameters for the characterization of adsorbent Click here to View table |
Effect of Contact Time
Effect of contact time on the removal of IC at 25 ºC is shown in Fig. 5. Rapid adsorption of IC during the initial period of 15 min is observed. The adsorption rate decreased substantially with time further than 15 min. The adsorption of IC by sawdust/MnFe2O4 is thus almost instantaneous (93. %). The residual of IC concentration is removed 3 % after 2 h and 2.2 after 5h. The Fig. 5 also is shown the IC removal with sawdust and MnFe2O4 magnetic ferrite was about 17% and 42%, respectively. The sawdust/MnFe2O4 nano composite even after 15 min, sorption efficiency was closed to 93%, which shows MnFe2O4 composite, exhibit outstanding adsorbent/catalyst. Similar results were obtained for other dyes such as acid cyanine, red B and acid orange [25, 32, 33]. More importantly, simple and rapid separation of IC-loaded MnFe2O4/sawdust adsorbent from treated water can be achieved via an external magnetic field.
To investigate the adsorption of IC (25 mg L¯) onto MnFe2O4/Sawdust composite as a function of time, the visible spectra of IC was studied. Spectrum around 215 and 295 nm are due to the aromatic system of IC dye. It can be seen from Fig. 6, that there is one major absorbance peak at 615 nm in the visible spectra of IC. This absorbance peak decreased in concentration as the treatment time increased, and after treatment for 120 min, this peak almost totally disappeared, which indicates the dye make smaller after adsorption.
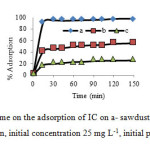 |
Fig5: Effect of contact time on the adsorption of IC on a- sawdust/MnFe2O4 , b-MnFe2O4, c- Sawdust (30 mL IC solution, initial concentration 25 mg L-1, initial pH 2.0 and 0.1 g adsorbent) Click here to View figure |
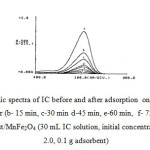 |
Fig6: UV-Vis electronic spectra of IC before and after adsorption onto MnFe2O4/Sawdust at different time: a-IC, after (b- 15 min, c-30 min d-45 min, e-60 min, f- 75 min g-90 min, h 120 )of contact time with sawdust/MnFe2O4 (30 mL IC solution, initial concentration 25 mg L-1, initial pH 2.0, 0.1 g adsorbent) Click here to View figure |
Effect of PH
The adsorption of a dye depends highly on the pH value of dye solution [34]. Sorption of IC as a function of pH is shown in Fig. 7. This was studied by varying the pH of aqueous solution of sorbents suspension from pH 2–11 at 25 °C. Maximum sorption yield was observed at pH 2. At low pH of solution, protonation of IC functional groups (N–H, O–H) cause the attraction between dyes and surface of sorbent. The results also suggest that to some extent carboxyl groups (-COOH) are responsible for the binding of dye. It has been reported that the ionization constant for a number of carboxylic acids range between 4 and 5.30 At lower pH, the carboxyl groups retain their protons reducing the probability of their binding to any positively charged ions. Whereas at higher pH (above 4.0), the carboxyl groups are deprotonated and as such are negatively charged. These negatively charged carboxylate (-COO-) attract the positively charged IC and binding occurs. Thus, IC binding to the sorbent is in essence an ion-exchange mechanism, which involves electrostatic interaction between the negatively charged groups in the cell walls and dye. However, in Fig. 7 it is observed that the sawdust binds IC even at pH below 7.0. This suggests that besides carboxyl groups, other groups may also be involved in dye binding. The reduction of IC removal in higher pH may be due to the increase of repulsive force between the functional groups on the surface of sawdust and anionic dye IC, and thus reduces the sorption of IC onto the surface of the sawdust and sawdust/MnFe2O4 nano composite [25].
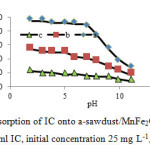 |
Fig7: Effect of pH on the adsorption of IC onto a-sawdust/MnFe2O4 nano composite, b-MnFe2O4, c- sawdust(30 ml IC, initial concentration 25 mg L-1, 0.1 g adsorbent) Click here to View figure |
Effect of Amount of Sorbent
The effect of mass of sorbent (0.05-1g) on the uptake of IC is shown in Fig. 8. The experiments carried out using 30 mL of dye with initial dye concentration 25 mg L-1 and initial pH 2.0. The IC removal was increased with increasing mass of sawdust/MnFe2O4 nano composite up to about 0.1-0.2g, and then IC removal remains almost unaffected by the MnFe2O4/Sawdust nano composite. The increasing in the adsorption is attributed to the availability of more adsorption sites and greater surface area for contact [35]. For higher mass of sorbent, the incremental of IC removal is very small and come to equilibrium [25, 36].
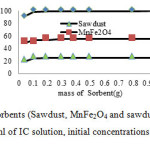 |
Fig8: Effect of amount of sorbents (Sawdust, MnFe2O4 and sawdust/MnFe2O4 nano composite on the sorption of IC (30 ml of IC solution, initial concentrations 25 mg L-1, initial pH 2.0) Click here to View figure |
Kinetic of Adsorption
The kinetic data of the adsorption of IC onto sawdust/MnFe2O4 was evaluated using pseudo-first order and pseudo-second-order kinetic models. The pseudo-first order model assumes that the rate of change of solute uptake with time is directly proportional to difference in saturation concentration and amount of solid uptake with time [15].
ln (qe – qt) = ln qe – k1t (1)
Where qe and qt are the amounts of dye adsorbed per unite mass of the adsorbent (mg g-1) at equilibrium time and any time t, respectively and k1 is the rate constant of adsorption (min-1). When ln (qe – qt) was plotted against time, a straight line should be obtained with a slope of k1, if the first order kinetics is valid.
The pseudo-second order model as developed by Ho and McKay [15, 36] has the following form:
t/ qt = t/qe + 1/(k2qe2) (2)
Where qe and qt represent the amount of dye adsorbed (mg g-1) at equilibrium time and at any time, respectively. k2 in the rate constant of the pseudo-second order equation (g mg-1 min-1). A plot of t/q versus time (t) would yield a line with a slope of 1/ qe and an intercept of 1/ (k2 qe2), if the second order model is a suitable expression.
The plot between ln (qe – qt) versus time t shows the pseudo first order model and the plot of t /q versus time t shows the pseudo second order model (Fig. 9 a, b). respectively. The kinetic model with a higher correlation coefficient r2 was selected as the most suitable one.
It was found that application of pseudo-second order kinetics provides better correlation coefficient of experimental data than the first-second order model for adsorption of IC onto sawdust/MnFe2O4 composite. The good correlation coefficients were obtained by fitting the experimental data to Eq (2), indicating that the adsorption process of IC onto sawdust/MnFe2O4 is pseudo-second order.
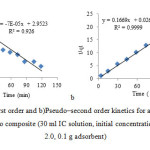 |
Fig9(a): pseudo–first order and b)Pseudo–second order kinetics for adsorption of IC on sawdust/MnFe2O4 nano composite (30 ml IC solution, initial concentration 25 mg L-1, initial pH 2.0, 0.1 g adsorbent)
|
Thermodynamic Parameters
Values of thermodynamic parameters are the actual indicators for practical application of a process. The values of ΔHº and ΔS°were calculated from the slope and intercept of the linear variation of ln Kd with the reciprocal of the temperature, 1/T, by using the relation [23, 37]:
ΔG°= -RT ln Kd (3)
ln Kd = – ΔG°/ RT = -( ΔH° / RT) +( ΔS°/ R) (4)
Where Kd is the equilibrium constant. ΔH° and ΔS° were calculated the slope and intercept of van, t Hoff plots of ln Kd versus 1/T. The results of thermodynamic parameters of IC adsorption onto sawdust/MnFe2O4 are given in Table. 2.
The positive value of the standard enthalpy change indicates that the adsorption is endothermic; the reason may be due to a stronger interaction between pre adsorbed water and the adsorbent than the interaction between IC and the adsorbent. The positive value of ΔS°, suggesting the process results is an increase in entropy. In the solid–liquid adsorption system, adsorption of solute onto the adsorbent and desorption of solvent from the adsorbent both exist; the former one is an entropy reduction process, and the latter is a contrary process. The entropy change of the adsorption is the sum of two processes. The negative value of ΔG° for adsorption of IC onto composite is due to both enthalpy effect and entropy effect. The overall standard free energy change during the adsorption process was negative for the experimental range of temperature 20–70 ˚C, corresponding to a spontaneous process [36].
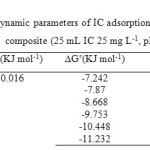 |
Table2: Thermodynamic parameters of IC adsorption onto sawdust/MnFe2O4 nano composite (25 mL IC 25 mg L-1, pH 2) Click here to View table |
Adsorption isotherm of IC
The equilibrium adsorption isotherm is of importance in the design of adsorption system. The adsorption isotherm indicates how the adsorption molecules distribute between the liquid phase and the solid phase when the adsorption process reaches an equilibrium state. Several isotherm equations are available and two important isotherms are selected in this study, the Langmuir and Freundlich isotherms.
The Langmuir adsorption model is given as
qe=qm KL Ce / (1+ KL Ce) (5)
The linearized form of Langmuir can be written as follows:
1/ qe = 1/ (Ce qm KL) + 1 /qm (6)
Where qe is the solid phase equilibrium concentration (mg g-1); Ce is the liquid equilibrium concentration of dye in solution (mg L-1); KL is the equilibrium adsorption constant related to the affinity of binding sites (L mg-1); and qm is the maximum amount of dye per unit weight of adsorbent for complete monolayer coverage (mg g-1).
The Freundlich adsorption isotherm model, which is an empirical equation used to describe heterogeneous adsorption systems, can be represented as follows: qe= KFCe1/n (7)
Where qe and Ce are defined as above, KF is the Freundlich constant representing the adsorption capacity (mg g-1), and n is the heterogeneity factor depicting the adsorption intensity. In most references, Freundlich adsorption may also be expressed as the following equation:
ln qe = ln KF + 1/n ln Ce (8)
The adsorption of IC was performed by shaking 0.1 g of sorbent in 30 mL IC at 30 ˚C and pH 2. Figs. 10 and 11 show the adsorption equilibrium data fitted to Langmuir and Freundlich isotherm expression, respectively. It is evident from Figs. 11 and 12 that the equilibrium data were better represented by Freundlich isotherm equation than done by the Langmuir equation.
The isotherm parameters of Langmuir and Freundlich for sawdust/MnFe2O4 nano composite are shown in Table. 3.
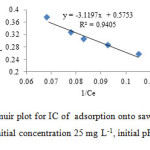 |
Fig10: Langmuir plot for IC of adsorption onto sawdust/MnFe2O4 (30 ml IC solution, initial concentration 25 mg L-1, initial pH 2.0, 0.1 g adsorbent) Click here to View figure |
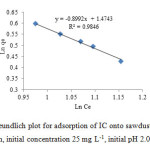 |
Fig11: Freundlich plot for adsorption of IC onto sawdust/MnFe2O4(30 ml IC solution, initial concentration 25 mg L-1, initial pH 2.0, 0.1 g adsorbent)
|
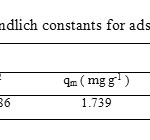 |
Table3: Langmuir and Freundlich constants for adsorption of IC onto sawdust/MnFe2O4 Click here to View table |
Desorption and Regeneration
Regeneration of an adsorbent is very important for industrial applications. At this juncture in study, the used adsorbent was regenerated following the process mentioned above. The sawdust/MnFe2O4 nano composite is simple to thermally regenerate and regeneration temperature is commonly at or beyond 200 °C (Fig. 12). Fig.12 shows the IC, IC adsorbed onto the composite and heated IC adsorbed onto the composite at 100 and 200 °C.
Fig.12-c and d show the degradation process of IC adsorbed on the composite. At above 100 ˚C obvious change had occurred in the spectra.
The adsorption capacity of the sawdust/MnFe2O4 nano composite for IC after its regeneration has also been studied. The regenerated samples of sawdust/MnFe2O4 composite were again saturated with IC with the same initial concentration of 25 mg L-1, determining their new adsorption capacity. Generally, the adsorption capacity of sawdust/MnFe2O4 nano composite was decreased as the number of regeneration cycle increase. These adsorption regeneration cycles were carried out to 3 times. The value of cycle 0 corresponds to the adsorption capacity of the original composite. The results obtained are represented in Fig. 13. The reduction was relatively obvious and after the 3 cycle, the adsorption capacity was reduce (about 3-5%) [25, 34].
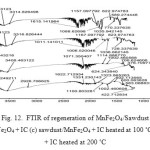 |
Fig12: FTIR of regeneration of MnFe2O4/Sawdust(a) IC (b) sawdust/MnFe2O4 + IC (c) sawdust/MnFe2O4 + IC heated at 100 ˚C (d) sawdust/MnFe2O4 + IC heated at 200 ˚C Click here to View figure |
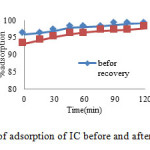 |
Fig13: % of adsorption of IC before and after of recovery Click here to View figure |
Conclusion
MnFe2O4 and sawdust/MnFe2O4 nano composite were successfully prepared. The present study indicates that the sawdust, MnFe2O4 and sawdust/MnFe2O4 nano composite were used for adsorption of IC from aqueous solution. The sorbents were characterized using XRD, FTIR, SEM and BET. The presence of manganese ferrite on the surface of the sawdust did not significantly change on surface of the sawdust. The amount of sorbated dye was found to vary with initial pH, and adsorbent dose. The amount of dye removal was found to increase with decreasing pH (pH 2). The results indicated the sorption of IC data was found to follow pseudo second order kinetic model. The Freundlich adsorption model was used to express the sorption process of IC. The thermodynamic constants of adsorption were also evaluated. The negative value of ΔG° confirms the spontaneous nature of adsorption process.
References
- Muthukumar, M.; Selvakumar, N.; J. Dyes Pigments, 2004, 62, 221-228.
- Chen, J.; Zhu, L.; Catalytic degradiation of orange II by UV-Fenton with hydroxyl-Fe-pillared bentonite in water, Chemosphere 2006, 65, 1249-1255.
- Guibal, E.; Roussy J, J. React. Funct. Pol. 2007, 67, 33-42.
- Gupta, V. K.; Jain R, Varshney S, J. Coll. Inter. Sci. 2007, 312 (2) , 292-296.
- Gomes, L.; Miwa DW, Malpass GRP, Motheo AJ, J. Braz. Chem. Soc. 2011, 22(7) , 223-229.
- Chulhwan, P.; Lee, Y.; Kim, T. H.; Lee, B.; Lee, J.; Kim, S.; J. Microbiol. Biotechnol. 2004, 14(6), 1190–1195.
- Purkait MK, Maity A, J. Hazard. Mater. 2007, 145, 287-295.
- Crini, G.; Biore. Technol. 2006, 97, 1061–1085.
- Foo, KY.; Hameed, B. H.; Chem. Eng. J. 2011, 66, 792-795.
- Salman, J. M.; Njoku, V.O.; Hameed, B. H.; Chem. Eng. J, 2011, 174, 41-48.
- Ferrero, F. J.; Colloid. Interf. Sci. 2007, 142, 144–152.
- Nasuha, N.; Hameed, B. H.; Chem. Eng. J. 2011, 166, 783-786.
- Amarasinghe, B.M.W.P.K.; Williams, R. A.; Chem. Eng. J. 2007, 132 (1-3), 299-309.
- Nasuha, N.; Hameed, B.H.; Azam, T.; Din, M.; J. Hazard. Mater. 2010, 175, 126–132.
- Ho, Y.S.; McKay, G;, J. Chem. Eng, 1998, 70, 115–124.
- Garg, V. K.; Gupta, R.; Yadav, A. B.; Kumar, R.; Biores. Technol. 2003, 89 (2) , 121-124.
- Abdel Latif, M. M.; Ibrahim, A. M.; Desalin .Water Treat. 2010; 20 (1-3): 102-113.
- Piyawan, L.; Woranan, N.; Paitip, T. J.; Environ. Manag. 2009, 90, 912–920.
- Argun, M. E.; Dursun, S.; Ozdemir, C.; Karatas, M.; J. Hazard. Mater. 2007, 141, 77–85.
- Ofomaja, A. F.; Chem. Eng. J. 2008, 143, 85-95.
- Hashemian S, Asian. J. Chem. 2009, 4 (21) , 3622-3630.
- Mahmut Ö, Ayhan Sİ, J. Proc. Biochem. 2005, 40, 565-572.
- S. Hashemian, M. Mirshamsi, J. Indust. Eng. Chem. 2012, 18, 2010-2015.
- Acar, F. N.; Eren, Z.; J. Hazard. Mater. 2006, 137, 909–914.
- Hashemian, S.; Salimi, M.; Chem. Eng. J. 2012, 188, 57-63.
- Yuan, P.; Liu, D.; Fan, M.; yang, D.; Zhu, R.; Ge, F.; Zhu, J.; He, H.; J. Hazard. Mater. 2010, 173, 614-621.
- Liu, H.; Qing, B.; Ye, X.; Li, Q.; Lee, K.; Wu, Z.; Chem. Eng. J. 2009, 151, 235-240.
- Hashemian, S.; Main Group Chem. 2011, 10, 105-114.
- Hashemian, S.; African J. Biotechnol. 2010, 9 (50) , 8667-8671.
- Ozmen, M.; Can, K.; Arslan, G.; Tor A.; Mustafa, Y.C.; Deasalination 2010, 254(1-3) , 162-169.
- Montanher, S. F.; Oliveira, E.A.; Rollemberg, M. C.; J. Hazard. Mater. B 2005; 117: 207–211
- Rongcheng, W.; Jiuhum, Q.; Hong, H.; Yunbo, Y.; J. Appli. Cata. B: Enviro, 2004, 48, 46-56.
- Zhang, G.; Qu, J.; Liu, H.; Cooper, A. T.; Wu, R.; Chemosphere, 2007, 68, 1058-1066.
- Chen, C.; Zhang, M.; Guan Q.; Li, W.; Chem. Eng. J. 2012,183, 60-67.
- Namasivayam, C.; Kavitha, D.; Dyes Pigments, 2002, 54, 47–58.
- Lataye, D. H.; Mishra, I. M.; Mall, I. D.; Chem. Eng. J. 2008, 138, 35-46.
- Bulut, Y.; Aydin, H. A.; Desalination, 2006, 194, 259-267.

This work is licensed under a Creative Commons Attribution 4.0 International License.
![]()
A New Edition of Web of Science
Journal Impact Factor
2022: 0.5
Five Year: 0.8
Journal is Indexed in

Cabells Whitelist
![]()


