Synthesis and characterization of ZnO nanoparticles
DOI : http://dx.doi.org/10.13005/ojc/300427
Download this article as:
![]()
Zinc oxide (ZnO) nanoparticles (NPs) has been synthesized by precipitation method using ammonia as precipitating agent and ZnCl2. 4 H2O as starting material. Syntsesised nanoparticles (NPs) have been characterized by using XRD (X-ray diffraction), TGA/DTA (Thermo Gravimetric Analysis), IR (Infrared Spectroscopy), magnetic measurement, surface area measurement, SEM(Scanning electron microscopy) and TEM Transmission electron microscopy). XRD studies show that zinc oxide was formed as ZnO and it has hexagonal structure. Magnetic measurements showed diamagnetic nature of synthesized zinc oxide NPs. Surface area of NPs zinc oxide was 4.3737 m2/g. The particle size of the synthesized zinc oxide was determined by TEM. TEM images show that the size of particles of ZnO varied from 27nm to 82nm with average crystallite size 50 nm.
KEYWORDS:Nanaomaterial; zinc oxide; TEM; metal oxides; XRD analysis
Introduction
Transition metal oxides have many applications as catalyst (Xu et al. 2003; Wei-zhong Lv et al. 2008; Lu et al. 2008; Altincekic et al. 2008; Bennici et al. 2003), sensors [Yang et al. 2011; Wei et al. 2010; Guimin et al. 2008; Sharma et al. 1999), superconductors (Pillai et al. 1995,; Rongcheng et al 2011) and adsorbents (Zou et al. 2006; Runping et al 2009). Metal-oxides constitute an important class of materials that are involved in environmental science, electrochemistry, biology, chemical sensors, magnetism and other fields. Metal oxides such as NiO and ZnO are of particular interest as they are regarded as safe materials for human beings and animals. The use of zinc oxide has been seen as a viable solution for environmental protection. Nanotechnology have emerged as the forefront of science and technologies. The intersecting fields of study that creates this domain of advancement of nanotechnology. Nanotechnology is forecasted as the second industrial revolution in the world. The novel properties have attracted global interst across disciplines. ZnO nanoparticles exhibit bright stable photoluminisence in colloidal dispersion (Xiong et al. 2009). ZnO is a versatile semiconductor material (Xu et al. 2004). ZnO has band gap energy of 3.37 eV and it has very large excitation binding energy (60 meV) at room temperature . It is wurtzite type semiconductor [Look D C 2001; -22, Gao et al. 2002]. Recently ZnO has been attracting attention because of its demand for its thermal stability, flexibility to form different nanostructures, commercial demand for optoelectronic devices. ZnO can form different nanostructures (Nawalage et al. 1999). ZnO has wide application in field emission (Gao et al. 2005), gas sensors (Hung et al. 2001), ceramics (Rodriguez et al. 2000) , solar cells (Moghaddam et al. 2009), nanogenrators (Rajendran et al. 2010) , biosensors (Wang et al. 2006), varistors (Wang et al. 2007), electrodeposition (Chang et al. 2010) , antimicrobial textiles (Xu et al. 2010) , catalysis , environmental protection , biotechnology, piezoelectric behaviours (Huang et al. 2001). Nano-ZnO on reduced graphite oxide (rGO) composite has been synthesized via a microwave-assisted route and its use as a potential sorbent to adsorb hydrogen sulfide (H2S) at ambient conditions has been studied (Song et al. 2013). Nano-sized zinc oxide was synthesized and deposited onto cellulosic fibers using the sol–gel process at ambient temperature. The prepared materials photoactivity was studied upon measuring the photodegradation of methylene blue and eosin yellowish under UV–Vis irradiation (Sánchez-Muñoz et al. 2013). Radio-frequency thermal plasma synthesis of nano- sized indium zinc tin oxide – powders with reduced indium content has been done and characterized (Lee et al. 2012). Polyvinylidene fluoride (PVDF) microfiltration (MF) membranes have been modified by addition of nano ZnO particles via fabrication of the phase inversion method. The detailed structure and properties of these composite membranes were characterized by inspection of SEM, AFM, DSC, and contact angle, rejection of BSA aqueous solution, reclaimed water treatment and membrane resistances analysis (Hong et al. 2012). An efficient protocol for synthesis of nanosize zinc oxide without calcinations was developed by sonochemical method. Prepared nanosize zinc oxide was well characterized with the help of TEM, XRD and EDAX. The analysis result showed that zinc oxide is found to be at nano scale, with uniform morphology and well crystalline nature (Kushal et al. 2012). Nano sized large surface area Zinc Oxide (ZnO) was synthesized by gel combustion method and used as an adsorbent to remove lead (II) (Pb2+) from aqueous solution(Venkatesham et al. 2013). Ultrafine, equiaxed and monodisperse oxide particles of iron oxide, zinc oxide and nickel oxide with an average grain diameter in the range of 1–10 nm have been prepared by a two-step chemical approach: the chemical reduction of metallic salts by activated sodium hydride in tetrahydrofuran solvent, followed by oxidation of the metallic species with small amounts of O2–N2 gas (Illy-Cherrey et al. 2002). Multi-walled ZnO nanotubes were synthesized of nanowire-rod like ZnO powders without use of any catalysts, plate or substrates (Ipeksaç et al. 2013). ZnO nano-particles were synthesized during carbon dioxide (CO2) decomposition using a DC plasma jet. The oxygen molecules obtained from CO2 decomposition and micro-sized Zn powders were used as raw materials (Park et al. 2010). In the present manuscript, synthesis of ZnO nanoparticles has been reported by simple aqueous precipitation method using aqueous ammonia as precipitating agent and ZnCl2 as the precursor. This method involves a simple, cheap and one step process for synthesis of very fine ZnO nanaoparticles as compared to other methods of synthesis like ultrasonic radiation, sol-gel approach, colloid mill, mechanical milling etc. The obtained particles of ZnO have size from 27-82 nm. The synthesized NPs were characterized by XRD, TGA/DTA, IR, surface area measurements, SEM and TEM studies.
Methods and Materials
Chemicals
All chemicals used in the experiment are analytic reagent grade. Zinc chloride, ZnCl2. 4 H2O was purchased from Merck, India. Ammonium hydroxide (liquor ammonia) was purchased from SRL. Deionized water was used throughout the experiment.
Synthesis of Zinc Oxide NPs
500 ml of 0.1M solution of ZnCl2. 4 H2O was taken and aqueous ammonia was added drop wise with constant stirring until the pH of the solution reached to 10. The precipitates thus obtained were filtered by Buckner funnel and was washed several times with distilled water. The precipitates were dried in oven at 70°C for 24 hrs and were calcined at 500°C in a muffle furnace for 5 hrs. Obtained material was ground and sieved through 100 mesh size sieve.
Characterization Techniques
The microstructure of the NPs was characterized by X-ray diffraction (XRD), Philips PW 11/90 diffractometer using nickel filtered CuKα (l = 1.5405 Å) radiations. The average diameter (D) of the zinc oxide nanocrystals has been calculated from the broadening of the XRD peak intensity after Kα2 corrections using the Debye-scherrer equation. Transmission electron microscopy (TEM) measurements of the sample were taken on Hitachi H7500 with a 70 kV accelerating voltage. The dispersions of nanoparticles in water were placed on carbon-coated 400 mesh copper grids, allowed to dry at room temperature before taking measurement. The obtained micrographs were then examined for particle size and shape. The magnetic property of the solid was measured at 300K using a Vibrating Sample Magnetometer (Model 155, Princeton Applied Research). TGA/DTA studies were carried out using Perkin Elmer Pyris Diamond. The BET surface area of the samples was measured by nitrogen adsorption isotherms on micromeritics ASAP 2010 (UK). The infrared spectra of adsorbents, adsorbates and adsorption adducts were recorded in KBr discs on a Perkin Elmer FTIR spectrophotometer (Model Perkin Elmer-1600 Series).
Results and Discussions
X-ray Studies
X-ray diffraction of synthesized oxide NPs is shown in Figure (1). X-ray diffraction pattern of pure zinc oxide indicated that zinc oxide in the form of ZnO [Fig- 1]. The X-ray diffraction plot, shown in Fig. 1, shows peaks only due to ZnO and no peak is detected due to any other material or phase indicating a high degree of purity of the as-synthesized sample. The broadening of the X-ray diffraction lines, as seen in the Fgure (1) reflects the nano-particle nature of the sample. In X-ray diffraction, some prominent peaks were considered and corresponding d-values were compared with the standard [JCPDS file No. 80-0075] [Table-1]. X-ray diffraction shows that metal oxide is pure ZnO having hexagonal structure.
t = Kλ / B cos Φ
Table1: X-ray diffraction data for zinc oxide (ZnO)
|
S.N. |
d=λ/2Sinθ (Observed) |
d=λ/2Sinθ (Reported) |
I/I0 ×100% (Observed) |
I/I0 ×100% (Reported) |
|
1. |
2.4779 |
2.4786 |
100 |
100 |
|
2. |
2.81675 |
2.8179 |
59.38 |
57.8 |
|
3. |
2.60485 |
2.6049 |
83.33 |
44.2 |
|
4. |
1.62572 |
1.6269 |
24.40 |
32.4 |
|
5. |
1.47777 |
1.4784 |
23.31 |
27.6 |
|
6. |
1.37912 |
1.3799 |
16.62 |
24.3 |
|
7. |
1.91202 |
1.9128 |
20.77 |
22.9 |
|
8. |
1.35934 |
1.3601 |
7.55 |
11.4 |
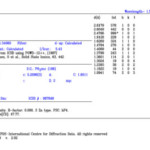 |
Figure 1 Click here to View figure |
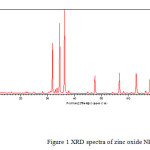 |
Figure1: XRD spectra of zinc oxide NPs Click here to View figure |
Sharpness of the peaks shows good crystal growth of the oxide particles. Average particle size (t) of the particles have been calculated using from high intensity peak using the Debye-Scherrer equation
Where t is the average crystallite size of the phase under investigation, K is the Scherrer constant (0.89), λ is the wave length of X – ray beam used, B is the fullwidth half maximum (FWHM) of diffraction (in radians) and θ is the Bragg’s angle
The average crystallite size calculated is 50 nm which is in close agreement with the TEM results.
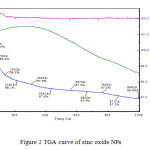 |
Figure2: TGA curve of zinc oxide NPs Click here to View figure |
Magnetic Measurements and IR Studies
The magnetic susceptibility measurement of the synthesized metal oxide NPs was carried out on Vibrating Sample Magnetometer (Model 155, Princeton Applied Research). Magnetic moment for metal oxides was calculated using the formula

Where, μeff = Magnetic moment (BM)
R = Observed magnetic moment(e.m.u.)
H = Applied magnetic field (gause)
W = Weight of sample subjected to analysis
n = number of unpaired electrons present in complexesμ
Table 2 Magnetic susceptibility data of zinc oxide
|
Metal Oxide |
meff (cal) (B.M.) |
meff (obs) (B.M.) |
|
Zinc oxide |
0.0 |
0.410 |
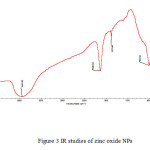 |
Figure3: IR studies of zinc oxide NPs Click here to View figure |
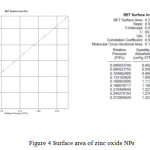 |
Figure4: Surface area of zinc oxide NPs Click here to View figure |
Magnetic moment was used to calculate the number of unpaired electrons present in respective metal oxide. The values of (cal) were obtained by the formula . Number of unpaired electrons, n, and hence magnetic properties of the samples were determined. The magnetic moment for zinc oxide NPs was carried out at room temperature and was observed as 0.410 B.M. This value of magnetic moment supports the fact that the synthesized zinc oxide is in the form of ZnO with actual magnetic moment 0.00 B.M. This indicates that zinc oxide contain no unpaired electrons in ZnO and hence diamagnetic in nature [Table 2]. IR spectra of synthesized zinc oxide shows peak due to M-O (Zn-O) stretching at 504.54 cm-1. Peaks at 3443.83 cm-1 and 1638.63 cm-1 may be due to presence of moisture and carbon dioxide present in atmosphere [Fig.2].
TGA/DTA and Studies Surface Area Measurement
TGA/DTA transition shows a loss of 2.4 % up to 4340 C [Fig.3]. No considerable loss is observed after this up to 10000 C. It simply indicates that when Zn (OH) 2 is heated, it converts into ZnO and that is stable above 4340 C. So, for the formation of zinc oxide temperature above 4340C is required.
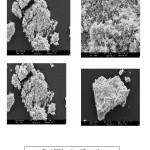 |
Fig5: SEM studies of Zinc oxide Click here to View figure |
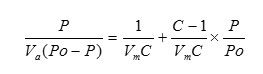
The BET surface area of the samples was measured by nitrogen adsorption isotherms. The specific surface area of metal oxides was determined using BET method. The method involved physical adsorption of N2 at its boiling temperature. The basic equation for finding out surface area by BET method is as follows:
Where
P = Adsorption equilibrium pressure
PO = Saturated vapor pressure of adsorbate
Va = Volume of adsorbate corresponding to pressure P
Vm = Volume of adsorbate required for a mono layer coverage
C = A constant relating to the heat of adsorption
According to the BET method, a plot of P/Va (Po-P) against P/Po yields a straight line when P/Po < 0.3. From the slope and intercept of the straight line Vm can be calculated by the following equation.
Where
Vm = Monolayer volume in ml at STP
N = Avogadro number
W = Weight of the powdered sample(g)
Am = Cross Sectional area of adsorbate molecule
(0.162 nm2 for N2)
Surface area of the metal oxide NPs was 4.3737 m2/g. Samples were activated at 473 K for 4 h prior to the measurement [Fig.4].
SEM and TEM Studies
SEM studies were carried out to find out the surface morphology of synthesized zinc oxide. SEM micrographs of the zinc oxide NPs have been represented in Fig. 5. SEM studies shows zinc oxide is in pure form and particles are beautiful white colored nanoparticles. TEM studies were carried out to find out exact particle size of synthesized ZnO. Figure 6 shows the TEM image of the synthesized ZnO nanoparticles. TEM images show that ZnO nanoparticles are having particle size in the range of 27nm – 82 nm [Fig. 6]. The size distribution histograms for nanoparticles provided their respective sizes as 45.9 ± 18.9 nm [Fig. 6a], 61.7 ± 19.8 nm [Fig. 6b], 57.2 ± 19 nm [Fig. 6c] respectively.
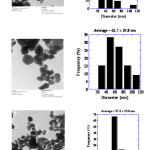 |
Fig6: TEM studies of Zinc oxide NPs Click here to View figure |
Conclusion
ZnO NPs with hexagonal structure are synthesized successfully by aqueous precipitation method using ammonia as precipitating agent. XRD studies show that zinc oxide was formed as pure ZnO. Surface area of the zinc oxide NPs is 4.3737 m2/g. From TEM study, it is found that NPs are with average size of 27-82 nm are formed. Magnetic measurements show that ZnO is diamagnetic in nature.
Acknowledgement
Acknowledgements are to Kunash instruments private limited for their help in surface area measurement
Refrencess
- Xu J. Z.; Zhu J. J.; Wang H.; Chen H. Y.; Anal. Lett. 2003, 36(13): 2723-2733.
- Wei-zhong Lv.; Liu Bo; Luo; Zhong-kuan; Ren; Xiang-zhong; Zhang, Pei-xin, Jr. of Alloys and Compounds., 2008, 465, 1-2: 261-264.
- Hsin-Chun Lu; Jo-Ling Lu; Chun-Lung Chu; Chi-You Lai; 2nd international conference 2008 2nd IEEE International Nanoelectronics Conference, 2008, 485-488.
- Altincekic T. G.; Boz I.; Aktürk S. J.; Nanosci nanotechnol. 2008, 8(2): 874-877.
- Bennici S.; Gervasini A.; Ragaini V.; 2003, 10:2, 61-64.
- Yang M.; He J.; Hu X.; Yan C.; Cheng Z.; Zhao Y.; Zuo G., Surface and interface physics papers A, 2011, 155, 2 : 692-698.
- Wei H.; Sun H.; Wang S.; Chen G.; Hou Y.; Guo H.; Ma X.; Jr. of Natural Gas Chemistry, 2010, 393-396.
- Guimin An.; Yang Z.; Li-Zhimin; Zhenhang M.; Buxing H.; Shidding M.; Jianping Li.; 2008, nanotechnology, 19 : 101-103.
- Sharma S. S.; Nomura K.; Jihira Y. U.; Journal of material science, 1999, 26: 4104-4109.
- Pillai V.; Kumar P.; Hou M. J.; Ayyub P.; Shah D.O.; Advance in colloid and Interface Science, 1995, 55 : 241-269.
- Rongcheng Wu.;s Jiuhui Qu; Hong He.; Yunbo Yu, Journal of Beijing University of chemical technology (Natural science edition), 2003, 48: 2311-2316.
- Zou W. R.; Han Z.; Zhang J.; Shi, Hangmin Li., 2006, Jr. of Chemical and Engineering data, 51 : 534-541.
- Runping H.; Lina Z.; Xin Z.; Yanfang X.; Feng X.; Yinli L.; Wang Y.; Jr. of Chemical Engineering, 2009, 149, 1: 123-131.
- Xiong H.M.; Shchukin D. G.; Mohwald H.; Xu Y.; Xia Y. Y.; Angewandte Chemie International Edition, 2009, 15: 2727-2731.
- Look, D. C., Mater.Sci. Eng.B, 2001, 80(1-3): 383 – 387.
- Zhang Y.; Suenaga K.; Collies C.; Iijima S., Science, 1998, 281, 5379: 973-975.
- Vayssieres L.; Advanced Materials, 2003, 15, 5: 464–466.
- Pan Z W.; Dai Z. R; Wang Z L.; 2001, Science 292: 1947-1949.
- Schin W C.; Wu M. S.; J.Cryst. Growth, 1994, 137: 3-4, 319 – 325,
- Xu C. X.; Sun X. W.; Dong Z. L.; Yu M. B.; Appl. Phys. Lett : 2004, 498–504.
- R Paneva.; Gotchev D.; Sens.Actuat.A : Phys. 1999, 72 : 79-87.
- Gao L.; Li Q.; Luan W. L.; J.Am. Ceram.Soc. 2002, 85, 4: 1016 – 1018.
- Nawalage, C.; Katsumi, K.; Atsushi F.; Daisuke O.; Masao S.; Mineo O.; Osamu Y.; Japanese Journal of Applied Physics, 1999, 38,11 : 6213.
- Gao P X.; Ding Y.; Mai W.; Huges W. L.; Lao C. S.; Wang, Z. L., Science 2005, 9, 309, 5741 : 1700-1704,
- Hung N T, Quang N D, Bernik S., J. Mater. Res., 2001, 16 (10): 2817-2823.
- Rodriguez J. A.; Jirsak T.; Dvorak J.; Sambasivan S.; Fisher D J.; J.Phys. Chem. B, 2000, 104: 319 – 328.
- Moghaddam A. B.; Nazari T.; Badraghi J.; Kazemzad M.; Int.J. Electochem. Sci., 2009, 4: 247-257.
- Rajendran R.; Balakumar C.; Ahammed H. A. M.; Jayakumar S.; Vaideki K.; Rajesh E. M. Int. J. of Engineering Science and Technology, 2010, 2(1) :202-208.
- Wang Z. L.; Song J.; Science, 2006, 312: 242-246.
- Wang X.; Song J.; Liu J.; Zhong L. W.; Science, 2007, 316 : 102-105.
- Chang C.; Tran V. H.; Wang J.; Fuh Y. K.; Lin L.; 2010, Nanoletters , 2 :726-731.
- Xu S.; Quin Y.; Xu C.; Wei Y. R.; Wang Z. L.; Nature Nanotechnology, 2010, 5, 5 : 366-373.
- Huang H M.; Mao S.; Fecik H.; Yan H.; Wu Y.; Kind H.; Weber E.; Russo R.; Yang P. D.; Science, 2001, 292, 5523 : 1897-1899.
- Song H. S.; Park M G.; Kwon S. J.; Yi K. B.; Croiset E.; Chen Z.; Nam S. C., Applied Surface Science, 2013, 276 : 646-652.
- Sánchez-Muñoz S, Pérez-Quintanilla D, Gómez-Ruiz S Materials Research Bulletin, 2013, 48, 2 : 250-255.
- Lee M.; Kim J S.; Seo J H.; Thin Solid Films, 2012, 521 : 60-64.
- Hong J.; He Y.; Desalination, 2012, 302 : 71-79.
- Kushal D., Bhatte, Dinesh N.; Sawant, Dipak V.; Pinjari.; Aniruddha B.; Pandit, Bhalchandra M. Bhanage.; Materials Letters : 2012, 77, 93-95.
- Venkatesham V.; Madhu G. M.; Satyanarayana S. V.; Preetham H.S., .Procedia Engineering, 2013, 51: 308-313.
- S Illy-Cherrey; Tillement O.; Dubois J. M.; Massicot; F.; Fort Y.; Ghanbaja J.; Bégin-Colin,S., Materials Science and Engineering: A, 2002, 338, 1–2, 15 : 70-75.
- Ipeksaç.; T, Kaya F.; Kaya C.; Materials Letters, 2013, 100, 1: 11–14.
- Park J. S.; Park D.W.; Surface and Coatings Technology, 2010, 205, 1, 25:S79-S83.


ISSN Online: 2231-5039

![]()


