Studies of Some Novel Chromium Pyridine Dicarboxylate Complexes
1Department of Chemistry, C.U.SHAH Science College, Nr. Gujarat University, Ashram Road, Ahmedabad. Gujarat, India
2Department of Biochemistry, C.U.SHAH Science College, Nr. Gujarat University, Ashram Road, Ahmedabad. Gujarat, India
DOI : http://dx.doi.org/10.13005/ojc/300435
Download this article as:
![]()
Chromium pyridine di-carboxylate complexes are synthesized from Chromium (III) with pyridine 2, 6- dicarboxylic acid, pyridine 2, 3 and 2, 5- dicarboxylic acids. Chromium forms colored complexes. Chromium (III) forms a violate complex with pyridine 2, 6- dicarboxylic acid and purple violate complex with pyridine 2, 3 and 2, 5- dicarboxylic acids. The job’s method indicates metal ligand ratio to be 1:2. The interpretation of UV-VIS spectra indicates octahedral geometry and IR spectra give clue about the presence of Metal – Nitrogen and Metal- Oxygen bond. We have also made an effort to compare the spectrum of all the three complexes.
KEYWORDS:Chromium (III) Complex; pyridine dicarboxylic acids; Job;s method; spectra
Introduction
There are mainly six isomers of pyridine dicarboxylic acid. They are pyridine 2, 3-, 2, 4-, 2, 5-, 2, 6-, 3, 4- and 3, 5- dicarboxylic acid. They show different modes of co-ordination with metal ions. Pyridine 2, 6- dicarboxylic acid which is known as dipicolinic acid is a well known N, O chelator in coordination chemistry due to its diverse co-ordination modes1-5.
Dipicolinic acid is found to be present in natural compounds that show various biological functions and potential pharmacological activities. Pyridine 2, 3- dicarboxylic acid is known as quinolinic acid. Quinolinic acid is a product of Kynurenine path way, which metabolizes the amino acid tryptophan. It acts as an NMDA receptor agonist6. (N-methyl-d-aspartate receptor).
The quinolinic acid which is derived from the amino acid tryptophan can be neurotoxin at high levels. Quinolinic acid can over stimulate nerve cells, causing the cells to die. Brain toxicity due to this acid has been implicated in Alzheimer’s disease, autism, Huntington’s disease, stroke, dementia, depression, HIV – associated dementia and schizophrenia. Fe (II) is reported to form a coordination compound with quinolinic acid 7.
Pyridine 2, 5- dicarboxylic acid is known as isocinchomeronic acid. Metal pyridinedicarboxylates have interesting properties in biological systems and their presence seems to be related with metal transport and cell membrane protection in some microorganisms.
We know that chromium activate enzymes. It is known to maintain protein stability and it speed up carbohydrate metabolism. It is reported that organic chromium (III) sources have shown to enhance the availability of chromium8.
A number of Cr- (dipic) 2 complexes have been prepared and reported in these years 9.
The chromium (III) – quinolinato complexes [Cr(QuinH)3)+3, [Cr(QuinH)2(H2O)2]+ and [Cr (quinH)(H2O)4]2+ have been obtained and characterized in solution 10.
We have developed a method for the spectrophotometric determination of Mn (II) by pyridine2, 6 dicarboxylic acid11.Synthesis characterizations and spectrophotometric determination of Ni(II) by pyridine2,3 and 2,5 dicarboxylic acid has also been studied12,13 .Synthesis, characterization, antimicrobial studies and spectrophotometric determination of Mn(II) by pyridine2,3 dicarboxylic acid has been done14 . In continuation of this work, we have synthesized a complex of chromium (III) with pyridine 2, 6 dicarboxylic acids in aqueous medium. We have carried out its solution studies and characterization by UV-VIS and FTIR spectroscopy. We have also prepared a complex of Cr (III) with pyridine 2, 3dicarboxylic acid as per the method reported and carried out its solution studies. The electronic spectra of complex [Cr (dipic) 2] +1 are in agreement with the spectrum of the complex reported15.Similarly, we have synthesized a complex of Cr (III) with pyridine2, 5dicarboxylic acid and carried out its solution studies and characterization by UV-VIS and FTIR spectroscopy. We have also made an effort to compare the spectrum of all the three complexes.
Experimental
An UV-VIS Spectrometer – 108 equipped with 1 cm quartz cell was used for spectrophotometric measurement. The pH measurements were made with an Eli co LI- 120 pH meter. The FTIR spectra were recorded in Vaibhav Analytical Laboratories. The Jobs method of continuous variation was used to determine the metal ligand ratio.
The reagents used were pyridine 2, 6 dicarboxylic acid, pyridine 2, 3 and pyridine 2, 5 dicarboxylic acids. These substances were dissolved in minimum amount of NaOH and its sodium salt solution was used.
Cr (III) solution: – A 0.01 M stock solution of CrCl3.6H2O prepared by dissolving in distilled water and was made acidic by adding dil HCl. The pH was maintained by adding dil. NaOH and dil. HCl.
Procedure
In each set of different 50 ml standard flask, various volumes of Cr (III) and reagent solution were taken, the pH was maintained to 5.0 to 5.5 for Cr (III) – 2, 6 PDC complex, 4.0 to 6.0 for Cr (III) – 2, 3 PDC complex, 3.5 to 4.5 for Cr (III)-2,5 PDC complex and absorbance was measured at 560 nm, 505 nm and 515 nm respectively.
Synthesis of the Complex
Synthesis of Cr (III) – 2, 6 PDC Complexes.
10 ml of 0.01 M Cr (III) solution was taken in a container. To this solution 20 ml of 0.01 M dipicolinate (Sodium salt) was added. A pink violate colored complex is obtained in five minutes of time. The pH of the mixed solution was maintained in between 5.0 to 5.5. The complex precipitate out in the pH range 3.0 to 3.5. The complex easily separates out if both the reagent solutions are concentrated. The pink colored precipitates obtained in the solution were filtered, washed and dried and FTIR study was carried out.
Synthesis of Cr (III) – 2, 3 PDC Complexes
1 gm of CrCl3.6H2O was taken in a container and dissolved in distilled water. 2 grams quinolinic acid was dissolved in minimum amount of sodium hydroxide soln. The quinolinate solution was mixed with Cr (III) solution and pH was maintained in between 4. 0 to 6.0. The pH was maintained around 3.0 and solution was kept for 12 hours. A red pink colored complex was obtained. The complex precipitates in the pH range 2.5 to 3.5. The solution was stirred for complete precipitation, filtered and dried. FTIR spectra were recorded.
Synthesis of Cr (III) – 2, 5 PDC Complex
10 ml of 0.01 M Cr (III) solution was taken in a container. To this solution 20 ml of 0.01 M isocinchomeric acid solution, prepared by dissolving the acid in minimum amount of NaOH was added. A Reddish pink color is obtained in the pH range 3.5 to 4.5. Now the solution is made acidic i.e. pH is maintained in between 2.0 to 3.5. The solution is stirred for about 1 hr and kept for 24 hrs. Pink colored precipitates are obtained. They are washed with distilled water and dried. The FTIR was recorded.
Results and Discussions
Determination of of the Complexes
(a) The absorption spectra of colored complex solution were recorded in the wave length region of 340 – 700 nm. It was observed that the complex of Cr (III) – 2, 6 PDC showed the maximum absorbance at 560 nm. The pink colored complex of Cr (III) – 2, 3 PDC showed the maximum absorbance at 505 nm (pH= 4 to 6) where as the pink colored complex of Cr (III) – 2, 5 PDC showed maximum absorption at 515 nm. Refer to the Fig –1, Fig-2 and Fig-3.
Job’s Method
The composition of the complexes was determined by Job’s method. The following ratio of the complex was determined.
(a) The Cr (III) – 2, 6 PDC complex ratio was found to be 1: 2 Fig – 4.
(b) The Cr (III) – 2, 3 PDC complex ratio was found to be 1:2 Fig – 5.
(c) The Cr (III) – 2, 5 PDC ratio was found to be 1: 2 Fig – 6.
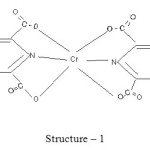
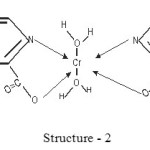
The proposed structures of Cr (III) complexes of pyridine 2, 6 dicarboxylate, pyridine 2, 3 dicarboxylate and pyridine 2, 5 dicarboxylate may be presented as
 |
Scheme 1 Click here to View scheme |
 |
Scheme 2 Click here to View scheme |
 |
Scheme 3 Click here to View scheme |
Interpretation of the Electronic Spectra of Chromium (III) Complexes
Most of the chromium complexes are octahedral or distorted octahedral. The octahedral d3 systems are stable. Most text books describe in generals the expected electronic transitions by orgel diagrams or Tanabe – Sugano diagrams 16-25. We have used orgel diagrams to describe the high spin octahedral configurations. We observe 2 or 3 peaks in the electronic spectra of d3 high spin octahedral (and also d2, d7 and d8) complexes which further can be explained by electron – electron interactions.
By using the Russell – Saunders (LS) coupling scheme, these free ion configurations give rise to F ground states which in octahedral and tetrahedral fields are split into terms designated by the symbols A2(g), T2(g) and T1(g). We have used the orgel diagram for the interpretation of spectra.
Orgel Diagrams
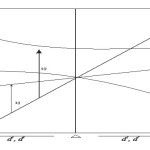 |
Figure 1A Click here to View figure |
An orgel diagram showing the splitting of an F State is shown above. The lines showing the A2 and T2 terms are linear and depend only on ∆. The lines for the two T1 terms are curved to obey the non-crossing rule. The left hand side is for d3 d8 octahedral complexes and the right hand side is for d2 d7 octahedral complexes. For a d3 octahedral system, 3 peaks are predicted which results due to the follows transitions.
- 4 T2 g← 4A2 g.
- 4T1 g(F) ← 4A2 g
- 4T1 g(p) ← 4A2 g
The following table illustrates the peak positions obtained from the absorption spectra of some octahedral Cr (III) complexes (in cm-1) 26.
| COMPLEX | v1(in cm-1) | v2(in cm-1) | v3(in cm-1) |
| [Cr (C2O4)3]3- | 17544 | 23866 | Obscured |
| [Cr (NCS)6]3- | 17800 | 23800 | Obscured |
| [Cr (acac)3]3- | 17860 | 23800 | Obscured |
| [Cr (NH3)6]3+ | 21550 | 28500 | Obscured |
| [Cr (en)3]3+ | 21600 | 28500 | Obscured |
| Cr (CN)6]3- | 26700 | 32200 | Obscured |
Electronic Spectra of Cr(III) – Pyridine Dicarboxylates
Cr(III) – Pyridine 2, 6 dicarboxylate complex
Looking at the d3 octahedral case, three peaks can be predicted which would correrpond to the following transitions.
- 4T2g ← 4A2g
- 4T1g(F) ← 4A2g
- 4T1g (P) ← 4A2g
In the visible region the maximum absorption occurs at 560 nm (fig 1) which corresponds to 17857 cm-1. This is due to 4T2g ← 4A2g (V1) this corresponds to ∆0 (The frequency of the lowest energy transition provides the value of ∆ 0 )The second peak occurs at 420 nm (i.e. 23800 cm-). This is due to 4Tig (F)← 4A2g. The third peak is obscured by very intense charge transfer band.
Vibration Studies
The patterns of IR spectrum show vibrations due to dipicolinate ligands the V (O – H) vibrations belonging to the H3O+ fragments are not observed as bands in the region 3599, 3558, 3474 and 3423 cm-1. Therefore the cation H3O+ is absent. The stretching frequencies due to the aromatic rings at 3000 to 3100 cm-1 are found. In the IR spectrum of the complex, all the bands involving O – H vibrations of the carboxyl ate are absent, namely the O – H stretching of the COOH groups, the C – OH in plane bonding and out of plane O-H deformation mode, hence showing deprotonation of the COOH group and coordination to the metal27. The absorption bands in the region 650 – 780 cm-1 are attributed to the vibrations of the co-ordinate pyridine molecules.
The absence of IR bands around 1700 cm-1 indicates that al the COOH – carboxylic groups are deprotonated.
The frequency at 1600, and 1651 cm-1 indicates the carbonyl frequency of the carboxyl group which is attached with the metal as -c||o→ M. The metal – nitrogen (M – N) and metal – Oxygen (M – O) bonds were further confirmed by the presence of the band around 472 cm-1 and 542 cm-1. 28-29
Cr (III) – Pyridine 2, 3 Dicarboxylate Complex
Looking at the d3 octahedral case, three peaks can be predicted which would corresponds to the following transitions.
- 4T2g ← 4A2g
- 4T1g (F) ← 4A2g
- 4T1g (P) ← 4A2g
In the visible region the maximum absorption occurs at 505 nm (fig 2) which corresponds to 20,200 cm-1. This is due to 4T2g ← 4A2g (V1) this corresponds to ∆0 .The frequency of the lowest energy transition provides the value of ∆ 0. The second peak occurs at 415nm (i.e. 25937 cm-). This is due to 4Tig (F) ← 4A2g. The third peak is obscured by very intense charge transfer band.
Vibration Studies
The spectra was recorded in the range 4000 – 400 cm-1.The IR spectra contained several indicative peaks such as an absorption band at 1400-1600 Cm-1 which refers to the stretching vibrations of C=0 bond. The stretching frequencies due to the aromatic rings are found at 3000-3100 cm-1. The frequencies around 1600-1630 cm-1 regions are due to HOH bending. The presence of COO– group is revealed by IR spectrum which shows absorption bands at 1653 and 1400 cm-1 corresponding to as (COO–) and s (COO–) vibrations.
Predominant vibrations of isocinchomeric acid associated with O – H are 2800 cm-1 {(O-H)}, 1417 Cm-1{(O-H)} and 927 cm-1 {(OH)}, which are absent indicating the deprotonation of –COOH group and coordination with the Cr(III). The absorption bands in the region 657-750 cm-1 are attributed to the vibrations of the coordinated pyridine molecules. The presence of IR bands around 1700cm-1 indicates that all the COOH – carboxylic groups are not deprotonated.
The frequency at 1665, and 1610 cm-1 indicates the carbonyl frequency of the carboxyl group which is attached with the metal as -c||o→ M. The metal – nitrogen (M – N) and metal – Oxygen (M – O) bonds were further confirmed by the presence of the band around 650 – 450 cm-1 and (570 – 400) cm-1. 28-29
Cr (III) – Pyridine 2, 5 Dicarboxylate Complex
Looking at the d3 octahedral case, three peaks can be predicted which would corresponds
to the following transitions.
- 4T2g ← 4A2g
- 4T1g(F) ← 4A2g
- 4T1g (P) ← 4A2g
In the visible region the maximum absorption occurs at 515 nm (fig 3) which corresponds to 20,600 cm-1. This is due to 4T2g ← 4A2g (V1) this corresponds to ∆0. (The frequency of the lowest energy transition provides the value of ∆ 0. The second peak occurs at 420nm (i.e. 23800 cm-). This is due to 4Tig (F)← 4A2g. The third peak is obscured by very intense charge transfer band.
Vibration Studies
The spectra was recorded in the range 4000 – 400 cm-1.The IR spectra contained several indicative peaks such as an absorption band at 1400-1600 Cm-1 which refers to the stretching vibrations of C=0 bond. The stretching frequencies due to the aromatic rings are found around 3000-3100 cm-1. The frequencies around 1590-1650 cm-1 regions are due to HOH bending. The presence of COO– group is revealed by IR spectrum which shows absorption bands at 1660 and 1450 cm-1 corresponding to vas (COO–) and vs (COO–) vibrations.
Predominant vibrations of isocinchomeric acid associated with O – H are 2800 cm-1 {(O-H)}, 1417 Cm-1{(O-H)} and 927 cm-1 {(OH)}, which are absent indicating the deprotonation of –COOH group and coordination with the Cr(III). The absorption bands in the region 657-750 cm-1 are attributed to the vibrations of the coordinated pyridine molecules. The presence of IR bands around 1700cm-1 indicates that all the COOH – carboxylic groups are not deprotonated.
The frequency at 1663, and 1610 cm-1 indicates the carbonyl frequency of the carboxyl group which is attached with the metal as -c||o→ M.
The metal – nitrogen (M – N) and metal – Oxygen (M – O) bonds were further confirmed by the presence of the band around 650 – 450 cm-1 and (570 – 400) cm-1 28-29.
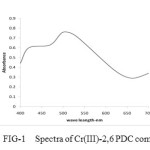 |
fig1: Spectra of Cr(III)-2,6 PDC complex Click here to View figure |
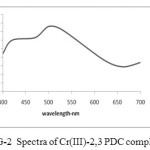 |
fig2: Spectra of Cr(III)-2,3 PDC complex Click here to View figure |
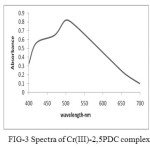 |
fig3: Spectra of Cr(III)-2,5PDC complex Click here to View figure |
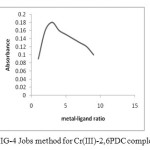 |
fig4: Jobs method for Cr(III)-2,6PDC complex Click here to View figure |
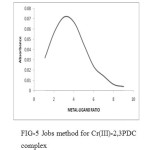 |
fig5: Jobs method for Cr(III)-2,3PDC complex Click here to View figure |
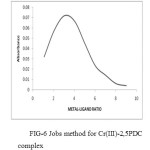 |
fig6: Jobs method for Cr(III)-2,5PDC complex Click here to View figure |
Conclusion
Pyridine dicarboxylic acids are peculiar ligands.They shows different co-ordination modes. Therefore they may react differently with metals in different conditions. This has aroused a considerable interest in their studies. Different ways of synthesis of the complexes are also possible. Due to this reason we have made an effort to interpret the spectra of the chromium complexes. Interpretation of electronic spectra of chromium- pyridinedicarboxylate complexes indicates that they have either octahedral or distorted octahedral geometries.
Acknowledgement
The authors are thankful to C. U. Shah Science College for providing laboratory facilities.
References
- M A Sharif, H Aghabozorg, A shokrollahi, M Shamsipur, A Moghimi and GK Ckelbick polish, J.Chem, 2006; 80: 847-863.
- Z Aghajani, MA Sharif, H Aghabozorg, and A Nader pour, Acta Crystallogr 2006; 62: 830–832.
- M Chatterjee, M Maji, S Ghosh, TCW- Mak K Studies of V (111) complexes,. Chem. Soc., Dalton Trans. 1998; 21, 3641-3645.
- LC Nathan, TD Mai. J. Chem. Cryst. 2000; 30: 509 – 518.
- LC Nathan. Trends Inorg. Chem. 1993; 3: 415 – 435.
- Misztal M, Frankiewicz, Parsons CG, DanyszW. January 1996, Eur. J.Pharmacol, 296(1);1-8 Doi: 10.1016/0014-2999(95)00682-6. PMID 8720470
- A.K. Majumdar,S.P. Bag, Analytica Chemica Acta, ,1959, 21; 324-330
- Ranjbar,M.; Aghabozorg,H.; Moghimi,A.;Yanovsky,A.Z. Kristallogr. New Cryst.Struct. 2001, 216, 626.
- Khaled Ghasemi, Ali Reza Rezvani, Bull. Korean Chem.Soc., 2013, 34(10),3093
- Ewa Kita and Karin Golembiewska Department of Chemistry, N. Copernicus University, 87-100 Toruri, Poland. Transition metal chemistry 2007 32-56-63 Doi : 10.1007S11243-006-01288
- Chauhan Jayprakash S, Pandya Ajit V; International Journal of Engineering and Science Invention, 2013, 2(2) (36-43),
- Chauhan J. S., Pandya A. V. International Research Journal of Pharmaceutical and Applied Sciences 2013; 3(5) 31-36
- Chauhan Jayprakash S, Pandya Ajit V; World Journal of Pharmaceutical Research,2014; 3(2) 2527-2541
- Chauhan J. S, Pandya A. V.Asian Resonance; 1, Issue-V, Jan-2013
- Gonzalez-Baro,A.C.; Pis-Diez,R.; E.Piro,O.E.; Parajon-Costa, B.S. Polyhedron-2008 , 27,502
- Basic Inorganic chemistry, F.A.Cotton, G.Wilkison and P.I.Gaus, 3rd edition, John Wiley and Sons, Inc.New York, 1995.
- Physical Inorganic Chemistry, S.F.A.Kettle, Oxford University Press, New York, 1998.
- Complexes and First Raw Transition Elements, D.Nicholls, Macmillan Press Ltd, London1971.
- The Chemistry of the Elements, N.N.Greenwood and A.Earnshaw, Pergamon, Press, Oxford, 1984.
- Concepts and Models of Inorganic Chemistry, B.E.Douglas, D.H.McDaniel and J.J.Alexender, 2nd edition, John Wiley& Sons, New York, 1983.
- Inorganic Chemistry, J.A.Huheey, 3rd edition, Harper Row, New York, 1983.
- Inorganic Chemistry, G.L.Meissler and.A.Tarr, 2nd edition, Prentice Hall, New Gercy, 1998.
- Inorganic Chemistry, D.F.Shriver and P.W.Atkins, 3rd edition, W.H.Freeman, New York, 1999.
- Basic Principles of Ligand Field Theory, H.L.Schlafer and G.Gilemann, Wiley-Interscience, New York, 1969.
- Y.Tanabe and S.Sugano, J.Phys.Soc.Japan, 1954; 9, ,753 and766.
- Prof.Robert John Lancashire, Department of Chemistry, University of West Indies, Mona Campus, Kingston 7, Jamaica.
- , Lin-Vien, D.; Colthup, N.B.; Fately W.G.; Grassell, J.G., Infrared and Raman Characteristic Frequencies of Organic Molecules; Academic Press; Boston, 1991.
- Krishan, B,; Prakash, O,; El-Mossalamy, E.H,; Orient. J.Chem. 2013, 29(1), 381-388.
- Rrington, J.E. Microbial, Rev. 1993, 57, 1-33
- Murkami, K. I Tnemura, y.i Yoshino, M. J. Nutr. Brioche. 2003, 14, 99-103.


ISSN Online: 2231-5039

![]()


