Solid-surface fluorescence of hydrophilic dyes on different polysaccharide matrices
Svetlana M. Rogacheva1*, Anna V. Strashko1, Tamara I. Gubina1, Anna B. Shipovskaya1,2, Elena V. Volkova1, Natalia A. Shilova1, Andrey G. Melnikov1
1Yury Gagarin State Technical University, 77 Polytechnicheskaya St., Saratov, Russia 410054
2Chernyshevsky Saratov State University, 83 Astrakhanskaya St., Saratov, Russia 410012
DOI : http://dx.doi.org/10.13005/ojc/300414
Article Received on :
Article Accepted on :
Article Published : 11 Dec 2014
Cellulose diacetate (CDA) fibers and films, fibers of chitosan (CTS) of polycationic and polybasic forms were examined as matrices for solid-surface fluorescence (SSF) of hydrophilic fluorescent dyes¾eosin Y and trypaflavine. CDA film and fiber ability to absorb trypaflavine was proved. The extraction degree and SSF signal of trypaflavine was higher for CDA film than fiber. The polybasic CTS was shown to have the highest sorption capacity (R = 95.5%) relative to eosin Y and to be the best matrix for its SSF signal. The obtained results can be used in the design of chemical sensors based on SSF measurement.
KEYWORDS:solid-surface; fluorescence; polysaccharide matrices; cellulose diacetate; chitosan; eosin Y; trypaflavine
Download this article as:| Copy the following to cite this article: Rogacheva S. M, Strashko A. V, Gubina T. I, Shipovskaya A. B, Volkova E. V, Shilova N. A, Melnikov A. G. Synthesis, Solid-surface fluorescence of hydrophilic dyes on different polysaccharide matrices. Orient J Chem 2014;30(4). |
| Copy the following to cite this URL: Rogacheva S. M, Strashko A. V, Gubina T. I, Shipovskaya A. B, Volkova E. V, Shilova N. A, Melnikov A. G. Synthesis, Solid-surface fluorescence of hydrophilic dyes on different polysaccharide matrices. Available from: http://www.orientjchem.org/?p=5718 |
Introduction
Solid-surface fluorescence (1,2) (SSF) is a modern method which combines solid phase extraction as a way of preconcentration and separation with high sensitivity luminescence determination in solid-sorbent phase. The method is successfully applied for trace quantification of various organic and inorganic compounds such as polycyclic aromatic hydrocarbons (PAH) (3-5), medicines (6,7) and metals (8,9) in different media.
There are many solid materials with various properties which are suitable for SSF applications among which silica gel (8), zeolite (7), foamed polyurethane (4), cellulose (5,8,9), etc. Polysaccharide materials of plant and animal origin – cellulose diacetate (10) (CDA) and chitosan (11) (CTS) are promising matrices for SSF as well.
Polymeric materials based on CDA (10) are well known as sorbents and membranes for the purification and preconcentration of different substances. Materials on the basis of CTS also exhibit high sorption capacity and serve effective sorbents of dyes, surfactants (11) and heavy metals (12). CDA and CTS materials can be prepared in various morphological forms such as films or fibers with different surface characteristics. So, these materials may have different properties valuable for analysis purposes. Earlier we have shown that CDA fibers and films modified with surfactants may be used for SSF analysis of PAH (13).
Hydrophilic dyes are utilized as fluorescent probes in biochemical research, quality control of medicines, in determination of toxicants in food and environment samples (14,15). Two hydrophilic fluorescent dyes of different families, namely, trypaflavine (acriflavine chloride) and eosin Y, were chosen for our experiments. Trypaflavine is an acridine dye, it is applied as an intercalating dye, as antiseptic and for analysis of cellular DNA and proteins. On the basis of the dyes of similar structure fluorescent molecular sensors for halide ions (except F–) have been designed (15). Eosin Y is a dye of the xanthene family, very sensitive to pH and used as a pH fluorescent probe (14).
The purpose of present research is to determine the possibility of sorption and fluorescence of hydrophilic fluorescent dyes – trypaflavine and eosin Y – on CDA and CTS surface for their further application in SSF measurements.
Material and Methods
There were used CDA with a viscosity-average molecular weight of 77 kDa, an acetylation degree of 55%, a 3% moisture, applied for the production of acetate filaments of textile purposes (Technofilter Ltd., Russian Federation, Vladimir); CTS with a viscosity-average molecular weight of 200 kDa, a deacetylation degree of 82 mol.%, and a 9% moisture (JSC “Bioprogress”, Russian Federation, Shchelkovo).
CDA films were prepared using 2 wt % CDA solutions in an acetone–water (95:5; analytical grade) mixture. Films were formed under standard conditions by casting of the solution followed by solvent evaporation. The solution was applied with a round glass spinneret to flat mirror glasses that had been degreased with ethyl alcohol and acetone. The completeness of solvent removal was monitored by weight changes. The film thickness was 45 ± 5 μm (dry state) and 55 ± 5 μm (wet state).
CDA and CTS fibers were prepared from polymer solutions in 70% acetic acid (reagent grade) by electrospinning at Educational & Research Institute of nanostructures and biosystems (Chernyshevsky Saratov State University, Russia). CTS in these fibers existed in two chemical forms, namely, polycationic (C) or polybasic (B). To convert CTS from polycationic to polybasic form, the samples were incubated in 1 N NaOH solution for an hour. Then they were washed with distilled water until pH 7 and dried at 20°C for a day.
Eosin Y, trypaflavine (Sigma, USA) of the Purum brand were used as fluorescent probes. The main component content in all probes was 96%. 2.96×10⁻⁶ M aqueous solutions of eosin Y (pH = 5.3), 1.21×10⁻⁶ M aqueous solution of trypaflavine (pH = 7.4) were used in the experiments.
Surface morphology of matrices was evaluated using MIRA \\ LMU electron scanning microscope (Tescan, Czech Republic) at a voltage of 8 kV and a conductive current of 60 pA. A gold layer of 5 nm thickness was sprayed onto the samples with a K 450 X carbon coater device (Germany); the spraying current was 20 mA, the spraying duration 1 min.
The surface potential (ε, mV) of matrices was measured with a surface potential sensor (Nima KSV, Finland).
The sorption of fluorescent probes was performed in dynamic mode. For this purpose, the solutions (V = 10 ml) were passed through the material five times, using a disposable sterile syringe Master UNI “PharmLine Limited” (Corwall Buildings, Great Britain, Birmingham) with a sorbent holder and a receiving reservoir. The matrices were then dried at room temperature until constant weight reached.
The fluorescence spectra of dyes in solution and in an adsorbed state on solid matrices were recorded using LS 55 fluorescent spectrometer from Perkin-Elmer (Perkin Elmer Life And Analytical Sciences, Inc., USA). A xenon lamp operating in pulse mode with a frequency of 50 Hz served as a source of radiation. The Monk–Gillieson monochromators were employed. The fluorescence of solutions was measured in a standard quartz cuvette with l = 1 cm, whilst a holder for solid samples was used for solid matrices.
The fluorescence of trypaflavine, eosin Y was measured within the spectral range 475–575, 520–580 nm, respectively, the wavelength setting accuracy was 1 nm. The excitation radiation wavelength for trypaflavine, eosin Y was 460 and 500 nm, respectively. The scanning rate was 200 nm/min.
The extraction degree (R, %) of the probes was determined as described in the paper5:
where I’max and I”max are the maximum values of fluorescence intensity (IFl) of the substance in the initial solution and in the solution after sorption on a matrix.
Results and Discussion
The morphology and surface-energy characteristics of film and fibrous materials based on CDA and CTS were examined. It has been presented (13) that the CDA films have the structure of a continuous “lacy” polymer network with pore sizes of ~100–500 nm, CDA fiber material has the highly ordered stacking of fibers with diameter 300–3000 nm.
The material made of the polycationic CTS is characterized by the weakly ordered stacking of fibers with diameter 150–400 nm (Fig. 1 a). The material made of the polybasic CTS has a cellular structure (Fig. 1 b). Chemical transformation of the CTS C-form into the B-form leads to deformation of the fibers, increasing their diameter, reducing pores size of the material.
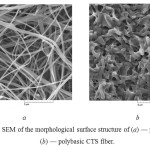 |
Fig1: The SEM of the morphological surface structure of (a) — polycationic, (b) — polybasic CTS fiber. Click here to View table |
The surface potential ε of the materials at the interface with air was estimated (Table 1), the surface water was taken into account.
Table 1: Surface potential of the polysaccharide matrices
|
Matrices |
ε (mV) |
| CDA film | –32.0±2.0 |
| CDA fiber | +419.0±1.0 |
| CTS (B-form) fiber | –192.5±0.5 |
| CTS (C-form) fiber | +116.5±1.5 |
It has been determined that the CDA fibrous material has the positive surface potential with the maximal value (+419.0±1.0 mV), the potential of the CDA film surface is negative with the minimal value (–32.0±2.0 mV). The absolute value of ε of the fibrous material of the both chemical forms of CTS varies slightly. The charge depends on the chemical form of CTS: the C-form has a positive charge (+116.5±1.5 mV) and B-form the negative one (–192.5± 0.5 mV).
Thus, the polysaccharide materials have different structural and energetic characteristics, which can affect their interaction with the dyes.
Trypaflavine and eosin Y fluorescence was studied in aqueous solutions before and after their dynamic sorption on polysaccharide matrices and in an adsorbed state. Using their spectral characteristics in aqueous solution and in solid phase there were calculated the extraction degree (R, %) of the probes (Table 2).
Table 2: The extraction degree of dyes by polysaccharide matrices
|
Matrices |
R, % |
|
|
trypaflavine |
eosin Y |
|
| СDA film | 70.0 | 20.5 |
| CDA fiber | 24.2 | 3.3 |
| CTS (B-form) fiber | 18.2 | 40.9 |
| CTS (C-form) fiber | 15.9 | 13.6 |
In Fig. 2 there are presented fluorescence spectra of trypaflavine in aqueous solutions before and after sorption and in solid phase of different polysaccharide matrices.
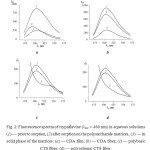 |
Fig2: Fluorescence spectra of trypaflavine (λexc = 460 nm) in aqueous solutions (1) — prior to sorption, (2) after sorption on the polysaccharide matrices, (3) — in solid phase of the matrices: (a) — CDA film; (b) — CDA fiber; (c) — polybasic CTS fiber; (d) — polycationic CTS fiber. Click here to View figure |
We can see that the spectra of trypaflavine in water solution have one fluorescence maximum (Imax) at wavelength of 505 nm. The intensity of fluorescence of tripaflavine in solution after sorption process is reduced in any case, but when using CDA film rather more. It indicates the ability of CDA and CTS matrices to absorb trypaflavine. The extraction degree of trypaflavine is calculated to be 70% for CDA film and 24.2% for CDA fiber (Table 2). We note trypaflavine is poorly sorbed by the CTS fiber.
Trypaflavine concentration on the surface of CDA matrices is supported by the appearance of SSF signal. The SSF signal of the dye on CDA film has a shift to 490 nm (Fig. 2 a), that indicates the increasing of the polarity of trypaflavine microenvironment on the matrix surface in comparison with water solution. It may be explained by the dissolution of trypaflavine cations in the subsurface water layer formed near the film with the total negative charge(–32.0±2.0).
The SSF intensity in the case of CDA fiber (Fig. 2 b) somewhat exceeds the value by which IFl has decreased due to sorption. The CDA fiber surface is hydrophobic and has a total positive charge +419.0 ± 1.0 mV while acriflavinium chloride in a neutral medium (pH = 7.4) exists in a dissociated state. Chloride ions possibly recharge the fiber surface, and trypaflavine cations partially retain on the surface of the matrix by electrostatic attractions.
When using CTS matrices for solid phase extraction of tripaflavin we register mostly fluorescence of fibers than of the dye, that is why in the wavelength region of less than 520 nm we observe the scattered light on the fibers of chitosan (Fig. 2 c,d). Thus, CTS matrices are not suitable for SSF measurement of tripaflavin and probably other acridine dyes.
The spectra of eosin Y (Fig. 3) have one fluorescence maximum at the wavelength 537 nm, in both aqueous phase and sorbent phase. The polycationic CTS fiber is an exception, which is found to shift the eosin Y to λ = 543 nm. There is no SSF signal of eosin Y on the CDA matrices (Fig. 3 a,b).
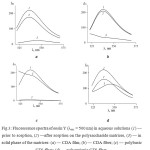 |
Fig3: Fluorescence spectra of eosin Y (λexc = 500 nm) in aqueous solutions (1) — prior to sorption, (2) —after sorption on the polysaccharide matrices, (3) — in solid phase of the matrices: (a) — CDA film; (b) — CDA fiber; (c) — polybasic CTS fiber; (d) — polycationic CTS fiber. Click here to View figure |
Table 2 shows that the extraction degree of eosin Y on the CDA film and fiber is 20.5 and 3.3%, respectively. The CTS fibers show higher affinity for eosin Y than CDA matrices: the extraction degree of eosin Y by the polybasic and polycationic CTS fibers is 95.5 and 31.8%, respectively.
There is registered SSF signal of eosin Y on the both CTS matrices. We note that the polybasic CTS fiber absorbs eosin Y three times more than the polycationic CTS fiber, but the SSF signal is increased by 1.5 times only. It may be explained by preferred concentration of eosin Y, existing as a dianion in aqueous solution with pH > 5, at the surface of the matrix (C-form CTS) with a total positive charge. In the case of the B-form CTS eosin Y may distribute inside the bulk of the sorbent, promoted by the cellular structure of this material. In the wavelength region of less than 520 nm we observe the scattered light on the fibers of chitosan, as in the previous measurements.
The porous structure of chitosan fibers can be useful for the design of hydrophilic fluorescent probe matrices for optical sensors. For example, porous silica films doped with small molecule fluorophoric metalloporphyrins are examples of high-sensitivity sensors of explosives (16).
Thus, the obtained results can be used in the design of sensors based on SSF analysis.
Conclusion
- CDA film and fiber ability to absorb trypaflavine was shown. Trypaflavine SSF signal on the film was higher than on the fiber but had a shift to 490 nm, indicating the increase of the polarity of trypaflavine microenvironment on the matrix surface in comparison with water solution.
- The CTS fibers showed high affinity for eosin Y, the extraction degree of eosin Y on the polybasic CTS fibers was 95.5 %. SSF signal of eosin Y was obtained on the both CTS matrices, but in the wavelength region of less than 520 nm the scattered light on the CTS fibers was observed.
- The polysaccharide matrices made of CDA films and fibers and CTS fibers may be used in the design of chemical sensors based on SSF analysis.
Acknowledgments
The results of this work were obtained in the framework of the state task No 4.1299.2014/K of the Russian Ministry of Education and Science.
References
- Miller, J.N. Pure Appl. Chem. 1985, 57, 3, 515–522
- Hurtubise, R.J. Analytica Chimica Acta. 1997, 351, 1-3, 1–22
- Fernandez-Sanchez, J.F.; Carretero, A.S.; Cruces-Blanco, C.; Fernandez-Gutierrez, A. Talanta. 2003, 60, 287–293
- Dmitrienko, S.G.; Gurariy, E.Y.; Nosov, R.E.; Zolotov, Yu.A. Anal. Lett. 2001, 34, 3, 425–438
- Dyachuk, O.A.; Gubina, T.I.; Mel’nikov, G.V. J. Anal. Chem. 2009, 64, 1, 7−11
- Escandar, G.M.; Gómez, D.G.; Mansilla, A.E.; de la Peña A.M.; Goicoechea, H.C. Analytica Chimica Acta. 2004, 506, 2, 161–170
- Beltyukova, S.; Teslyuk, O.; Egorova A.; Tselik E. J. Fluoresc. 2002, 12, 2, 269–272
- Parashchenko, I.I.; Smirnova, T.D.; Shtykov, S.N.; Kochubei, V.I.; Zhukova, N.N. J. Anal. Chem. 2013, 68, 2, 112–116
- Amelin, V.G.; Aleshin, N.S.; Abramenkova, O.I.; Nikolaev, Yu.N.; Lomonosov, I.A. J. Anal. Chem. 2011, 66, 8, 709–713
- Fischer, S.; Thümmler, K.; Volkert, B.; Hettrich, K.; Schmidt, I.; Fischer, K. Macromolecular Symposia. 2008, 262, 89−96
- Rinaudo, M. Prog. Polym. Sci. 2006, 31, 7, 603–632
- Gerente, C.; Lee, V.K.C.; le Cloirec, P.; Mckay, G. Critical Reviews in Environmental Science and Technology, 2007, 37, 41–127
- Straško A.V.; Gubina T.I.; Shipovskaya A.B.; Mel’nikov A.G.; Malinkina O.N. Orient. J. Chem. 2014, 30, 3, 1013-1019
- McDonagh, C.; Burke, C.S.; MacCraith, B.D. Chem. Rev. 2008, 108, 400–422
- Valeur, B., Eds., Molecular Fluorescence: Principles and Applications; Wiley-VCH Verlag GmbH, (2001)
- Germain, M. E.; Knapp, M. J. Chem. Soc. Rev. 2009, 38, 2543–2555

This work is licensed under a Creative Commons Attribution 4.0 International License.
![]()
A New Edition of Web of Science
Journal Impact Factor
2022: 0.5
Five Year: 0.8
Journal is Indexed in

Cabells Whitelist
![]()


