Preparation of carbon monoliths from orange peel for NOx retention
Liliana Giraldo1,Marlon Bastidas-Barranco2, Juan Carlos Moreno-Pirajan3*
1Facultad de Ciencias, Departamento de Química, Universidad Nacional de Colombia, Bogotá, Colombia, Carrera 30 No 43-00, Ciudad Universitaria 2Facultad de Ingeniería, Departamento de Ingeniería Mecánica, Universidad de la Guajira, Colombia 3Facultad de Ciencias, Departamento de Química, Grupo de Investigación en Sólidos Porosos y Calorimetría, Universidad de los Andes, Bogotá, Colombia, Carrera 1 No 18 A 10, Edificio Q,
DOI : http://dx.doi.org/10.13005/ojc/300409
Article Received on :
Article Accepted on :
Article Published : 18 Nov 2014
A series of monoliths are prepared from orange peels and chemically activated with H3PO4, KOH, ZnCl2, and water vapor without a binder. The monoliths were characterized by N2 adsorption-desorption isotherms at 77 K, Boehm titrations and XPS. Thereafter, monoliths were tested for their ability to establish NOx retention. The results show that the retention capacities of NOx were a function of the textural properties and chemistries. The carbons synthesized with ZnCl2 and KOH retained similar amounts of NOx.
KEYWORDS:monoliths; NOx; isotherms; adsorption; orange peel
Download this article as:| Copy the following to cite this article: Giraldo L, Bastidas-Barranco M, Moreno-Pirajan J. C. Preparation of carbon monoliths from orange peel for NOx retention. Orient J Chem 2014;30(4). |
| Copy the following to cite this URL: Giraldo L, Bastidas-Barranco M, Moreno-Pirajan J. C. Preparation of carbon monoliths from orange peel for NOx retention. Available from: http://www.orientjchem.org/?p=5443 |
INTRODUCTION
NOx production is mainly associated with human activities. Nitrogen oxides are emitted from major stationary sources that use fossil fuels, but the levels of NOx vary with the mixture of these fuels. The total annual emissions in the world are on the order of 22 Tg N/yr. Nitrogen oxides are also emitted to a great degree by mobile sources of petroleum derivatives. There are estimates that suggest, for example, that NOx emissions from aircraft may also be relevant. There are other less important sources of N2O that may have an impact on NOx emission, such as natural soils, cultivated soils, biomass burning, fossil fuel combustion, wastewater treatment, oceans, land use changes, industries, aquifers, garbage, animal waste and other minor sources.
Gas separation technologies have been used to perform various studies on gases, including CO2 capture in pre-combustion and post-combustion scenarios, such as amine-based absorption, membrane-based separation, adsorption and cryogenic separation [1]. In this context, adsorption may be a potentially attractive alternative to capturing CO2 from stationary sources and offshore applications. Various adsorbents have been investigated for such purposes, such as zeolites, activated carbons, metal-organic frameworks (MOFs) and amine-grafted silicas [2-8]. Furthermore, adsorbents modified with amines have been investigated as potential materials for CO2 capture above room temperature (typically 348 K) and at low partial pressures of CO2 [9-11]. These are the conditions often found in flue gas, which also contains water vapor and other contaminants (NOx, SOx). This is a challenging scenario with technological solutions yet to be found [3,7,9].
The NOx pollutants are materials, which must be removed of environment in order to reduce its concentration. To achieve a reduction in NOx emissions, several techniques are available which use different adsorbent materials such as zeolites, metal oxides (SiO2, Al2O3, TiO2), molecular sieves, carbon fibers, nano-structured materials, activated carbon cloth and activated carbon. These latter materials can be prepared from different precursors including minerals and lignocellulosic wastes. In practice, in the treatment of large volumes of gas, using a conventional bed of adsorbent materials has several disadvantages such as pressure drops, diffusional resistance and clogging of the catalyst by deposits of particulate matter [12-14]. Such problems can be solved with the use of honeycomb-type monoliths obtained from activated carbon (ACH; activated carbon honeycomb), which are characterized, by a large number of parallel channels according to the mold press used in the preparation, which may mimic a honeycomb pattern throughout the structure. The monoliths combine the very interesting properties of activated carbons (e.g. stability in acidic and basic media, high surface area, large pore size distribution, etc.) and the advantages of cell structures (e.g., low draw down pressure, high geometric surface area, short diffusion length, etc.), which are highly attractive for applications in adsorption, catalysis and separation [3, 6]. It has been reported in the literature that monoliths can be impregnated with metals of different physicochemical characteristics, especially those that present catalytic activity; this may affect the column operating temperature and the time of gasification. In our laboratory, we have shown that it is possible to add use activated carbon as a support for certain metals in catalytic reactions, which increases the adsorption capacity [15]. The aim of the present research was to study the adsorption of NOx on honeycomb-like monoliths obtained from orange peel by chemical activation and to study the catalytic effect of copper on these materials.
METHODS AND EXPERIMENTAL
Preparation of activated carbon honeycomb monoliths
The preparation of monolith structures usually requires additional binding components to assure better particle adhesion during pressure agglomeration for higher mechanical resistance. However, the binding components can produce a significant decrease in the porosity in the resulting material. For this reason, the preparation of carbon monoliths in this work was carried out without any binder material [16].
The usual procedure for preparing monolith adsorbents without binding materials is based on the use of an activating agent that can interact with the lignocellulosic precursor, producing dehydration reactions as well as degradation and condensation of the bio polymer molecules. These substances then become able to induce the agglomeration of particles during pressure treatment of the solid [17].
The starting materials were cleaned with water and dried at 110°C for 48 h. The dried samples were crushed in a blender and sieved to a size smaller than 100 μm. The elemental compositions and proximate analysis of the raw materials (orange peel, OP) used in this study were analyzed. It was found to be 56.4, 8.34, 1.22, 33.4 and 0.66% for C, H, N, O and ash content on a dry basis, respectively. The activated carbon monoliths from orange peel were prepared by chemical activation. The samples of dried orange peel were subjected to impregnation with H3PO4 (40% wt/wt), KOH (40% wt/wt) and ZnCl2 (40% wt/wt) solutions at 80°C for 72 h for to ensure complete and effective wetting. After of this, the samples were dried in an oven at 110°C for 24 h. Then, samples were washed until a constant pH and chloride end.
Then impregnation method was used to introduce copper using Cu(NO3)2.8H2O, before the activation of the samples. Samples were carried to a uniaxial press, and a pressure of 4000 psi was applied at a controlled temperature of 150°C. Thus, monoliths were obtained with 3% Cu and brought to the oven for activation.
An additional sample was prepared by the pyrolysis of orange peel at 950°C for 3 h in nitrogen and activated with water vapor at 850°C for 6 hours. The samples were designated OPP-Cu (activated with H3PO4), OPK-Cu (activated with KOH), OPZ-Cu and (activated with ZnCl2). A final sample of activated carbon monolith was prepared from previously carbonized orange peel, but activation was performed with steam at 900°C for 6 hours. This sample was designated OPW-Cu (activated with vapor water).
Textural characterization of activated carbon monoliths
To determine the surface area and pore structure of activated carbon samples, the nitrogen adsorption–desorption isotherms at 77 K were measured by an automated adsorption instrument, Quanta chrome (Boynton Beach, FL, USA), IQ2 with ± 0.15% accuracy. The surface area, pore volume and pore size distribution were determined from nitrogen adsorption data by using Quantachrome software. Adsorption data were obtained over the relative pressure, P/Po, range from 10-5 to 1. The sample was degassed at 250 °C under vacuum for 4 h. The apparent surface area of nitrogen was calculated by using the BET (Brunauer–Emmett–Teller) equation within the 0.01–0.3 relative pressure range. The micropore volume was determined according to the DR (Dubinin–Radushkevich) method [18-20]. The amount of N2 adsorbed at relative pressures near unity (≈ 0.99) corresponds to the total amount adsorbed in both the micropores and the mesopores; consequently the subtraction of the micropore volume from the total amount will provide the volume of the mesopores. Pore size distribution was obtained applying the DFT (Density Functional Theory) method to the nitrogen adsorption isotherm by using the software supplied by IQ2 [21].
Determination of oxygenated groups by Boehm titration
Oxygenated surface groups on the activated carbon monoliths were quantified using the methodology proposed by Boehm [22,23]. In this method, carboxylate groups were estimated using NaHCO3, lactones were estimated from the difference in acidity assessed by NaHCO3 and Na2CO3, and phenolic and carbonyl groups were estimated from the difference in acidity assessed by NaOH and Na2CO3 [22,23]. Finally, the total basicity of the material was estimated using hydrochloric acid. 0.100 g of activated carbon monoliths were placed in a 50 mL glass vessel with a hermetic lid, containing 25 mL of 0.1 M NaOH, Na2CO3, NaHCO3 or HCl solution, as appropriate. The resulting solution was manually stirred twice a day for 48 hours. Then, a 10 mL aliquot was titrated with previously standardized acid and base solutions to determine the difference in μmol g-1.
XPS analysis
XPS analyses were carried out after the adsorption process had run for 3 h using an Escalab 250 Xi spectrophotometer (Themo Scientific, USA) with MgKα radiation at 1253.6 eV. For analysis of the high-resolution spectra of XPS, the C1s peak position was set at 284.5 eV and used as a reference for positioning the other peaks in the spectrum. High-resolution spectral deconvolution was performed using Gaussian-Lorentzian curves. The low resolution spectrum identified elements corresponding to each of the peaks obtained from high resolution spectra or peaks of each element (C, N, O and Cu), which may be oxidation states of the different elements in the sample, as well as information on the type of bond that forms with other elements present on the surface.
Retention of NOx by activated carbon honeycomb monoliths
The NOx/carbon reactions were carried out in a fixed bed reactor. The reactor was a 1-cm ID stainless steel tube and the prepared carbon catalyst with a sample weight of 1 g was placed on a wire mesh in the tube. A stream of gaseous mixture representing the flue gas, e.g. NO (500 ppm), O2 (10%), and N2 as the balance, was passed through the prepared catalyst. The feed flow through the reactor was controlled at 150 mL/min governed by a Brooks mass flow controller. The reaction temperature of this process was preset to a temperature of 200°C. The inlet and outlet concentration of NOx was measured using a portable flue gas analyzer (IMR 2800 P). Three replicate measurements and an average of these readings were made for each reaction.
RESULTS
Porous structure
The N2 adsorption-desorption isotherms of the synthesized samples at -196°C are shown in Figure 1. According to the IUPAC guidelines, type I isotherms indicate the characteristics of microporous materials, where micropore filling may take place by primary filling at a very low relative pressure (p/po), but in this case, a plateau was not reached, clearly indicating the widening of pores. This isotherm exhibits a type H4 hysteresis loop, characteristic of slit-shaped pores. Using different treatments in sample preparation, the carbons showed a combination of type I and type II isotherms, indicative of the simultaneous presence of micro and mesopores. Baquero et al. [24] also observed evolution from a type I to a type II isotherm, where the low pressure is concave relative to the axis of the relative pressure (P/Po), which then increases linearly and tends to become convex. The loop shape corresponding to the characteristics mesoporous solids, called hysteresis, is formed by the filling of these and is governed by the capillary condensation phenomenon and properties of the solid percolatives.
also observed evolution from a type I to a type II isotherm, where the low pressure is concave relative to the axis of the relative pressure (p/po), which then increases linearly and tends to become convex. The loop shape corresponding to the characteristics mesoporous solids, called hysteresis, is formed by the filling of these and is governed by the capillary condensation phenomenon and properties of the solid percolatives.
The isotherms differed due to the different treatments used to obtain the activated carbon monoliths used in this investigation, although the amount of copper remained constant in all the samples. The effect of activation with the use of different methods of chemical activation during the preparation monoliths on the BET surface area, micropore volume, and pore volume are given in Table 1. The overall pore volume, Vtotal, was calculated from the nitrogen adsorption data as the volume of liquid nitrogen at a relative pressure of 0.985. The micropore volume, Vmicro, was determined to by the DFT method, and the mesopore volume, Vmeso, was obtained by substracting the micropore volume from the overall pore volume.
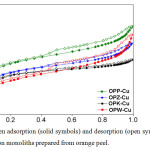 |
Fig1: Nitrogen adsorption (solid symbols) and desorption (open symbols) isotherms of activated carbon monoliths prepared from orange peel. Click here to View figure |
The structural heterogeneity of porous material is generally characterized in terms of the pore size distribution. This pore size distribution represents a model of the solid internal structure, which assumes that an equivalent set of non-interacting and regularly shaped model pores can represent the complex void spaces within the real solid [25-27]. The pore size distribution is closely related to both the diffusion and retention properties of NOx in the porous material and is perhaps the most important aspect for characterizing the structural heterogeneity of porous materials used in industrial applications. The pore size distribution of the samples was evaluated by the density functional theory (DFT) method using medium regularization. The DFT pore size distribution of the activated carbons is shown in Figure 2.
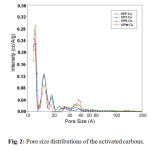 |
Fig2: Pore size distributions of the activated carbons.Click here to View figure |
This figure confirms that the activated carbons were mainly micro porous with some mesopores. For the activated carbons monoliths OPP-Cu, OPZ-Cu and OPK-Cu, several strong peaks were observed in this study. The predominant pore widths were around 1.2, 1.5, and 1.9 nm, respectively. For OPW-Cu, pores more than 2 nm in size (mesopore) were much more abundant and the predominant pore width shifted to 1.4 and 1.7 nm. In the case of OPK-Cu, the creation of a micro porous structure and widening of the micro pores to mesopores also occurred.
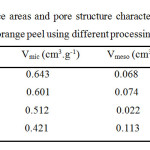 |
Table1: The BET surface areas and pore structure characteristics of activated carbon monoliths prepared from orange peel using different processing conditions Click here to View table |
The results show that the highest surface area monoliths were obtained with H3PO4, followed by ZnCl2. Monoliths with comparatively less developed areas were obtained with steam. Similar behavior has been found in previous experimental work and discussed extensively by Molina-Sabio et al. [28]. These authors conducted a study on the preparation of activated carbons in a detailed study and analyzed the effect of the degree of activation versus the amount of phosphoric acid used. In our research, as mentioned before, the isotherms at first exhibited characteristics of microporous solids and then presented a hysteresis loop that was a factor of the activating agent used (e.g. H3PO4). Greater mesoporosity occurred in the activated carbon honeycomb monoliths prepared by steam activation than in the other monoliths. This hysteresis was present at relatively high pressures after a plateau was reached. The role of each of the activating agents used in the activation process is not yet fully established and the mechanisms of action are unknown. Some authors have proposed different mechanisms and explanations, and literature reviews have been very interesting in the case of the activating agents used in this investigation, due to some of the textual characterization results. Reinoso et al. [28,29] performed this procedure and proposed a number of interesting arguments of which fit our results: the partial de-polymerization of lignin decreases the mechanical properties of the particle, thus facilitating swelling [27], whereas the decomposition of the other components, hemicellulose and cellulose, into smaller units, brings about flow and redistribution of the cellular matter, with a high degree of mobility and migration. In fact, one can observe physical and chemical changes in the particles during impregnation and, additionally, the appearance of micelles in the solution, which are converted into tar during evaporation. When the solution is completely evaporated, the particles of the precursor have a relatively weak structure, with the entire chemical content of its interior and the exterior surrounded by tars. The changes described during impregnation (weakening of the particle structure and the presence of tars) were more intense for phosphoric acid than for zinc chloride because the former is a Brönsted acid and a strong dehydrating agent, and thus is more effective at inducing bond cleavage. Additionally, phosphoric acid has the capacity to form phosphate esters or polyphosphates with the chains of degraded biopolymers [28]. When a pressure of 130 MPa was applied to the impregnated precursor at 100 or 150 ºC, the loss of water and tars from the interior of the particle occurred. The main effect of ZnCl2 was to dehydrate, especially at temperatures above 250 ºC; this is shown in the N2 adsorption isotherms. On the other hand, the chemical activation produced by phosphoric acid generated a decrease in porosity because it affected the interparticle space, which led to the development of mesoporosity and microporosity in this monolith. In this case, Reinoso et al. showed that the precursor continued losing water and volatile matter during the heat treatment of the monolith, becoming richer in carbon and smaller in size, but the contraction of the particles was partially restricted by the amount of chemicals in its interior. The extraction of the excess chemicals controls the volume and size distribution of the micropores of activated carbon monoliths [26,29].
In the case of activation with KOH, several authors have proposed that the preparation involves two main steps, which are carbonization and activation of the carbonized product. The carbon is usually charred at temperatures below 600°C during carbonization [30,31]. The char is then subjected to chemical treatment, such as KOH impregnation, to develop porosity and increase adsorption affinity [30-34].
The following reactions occurred during the impregnation and activation processes
CnHxOy + KOH → (CnHx-1Oy-K) + H2O (1)
The first stage, i.e. the semi-carbonization process, can be represented thus
(CnHx-1Oy-K) → Char (+K) + Tars + Gases (2)
Char usually contains 75-80% carbon, some oxygen, (15-17%) and some hydrogen (<3%) [24]. Abechoi et al. [30] showed that tars consists of phenols, CH3COOH, CH3OH, (CH3)2CO, and other high molecular weight hydrocarbons. The gaseous components include, among others, H2O, CO2, CO. The following reaction occurred during the activation (second stage) process [30,33,34]
C + 2KOH → 2K + H2 + CO2 (3)
C+ 2KOH →2K + H2O + CO (4)
CO2 + 2KOH → K2CO3 + H2O (5)
Potassium intercalated with the carbon matrix during activation, resulting in pore widening and the formation of new pores. A secondary reaction that could possibly take place is shown below [30,34]
H2O + C + 2KOH → K2CO3 + 2H2 (6)
Potassium carbonate is known to prevent excessive sample burn-off; as such, well-developed porosity and high yield resulted [30,33]. This resulted in a high yield and well-developed internal porosity [30,34]. The structure of the carbonaceous material became reorganized in a fashion characterized by a large internal surface through the activation process [30,31]. The intrinsic properties of the activated carbon were dependent on the raw material, the activating agent, and the conditions of the chemical treatment [30,34].
Díaz-Terán et al. [35] says that during activation with KOH are formed on the surface of carbon, compounds different potassium (mainly K2CO3 and other oxides). Furthermore, Lillo-Rodenas et al. [36] observed formation K2CO3 and potassium metal or metal oxide during activation with KOH. The mechanism through which activation occurs is not fully established. Some authors propose that the collation of these potassium compounds [36,37] or potassium metal [35] in the carbonaceous structure is primarily responsible for the development of porosity. While other authors suggest that what happens is gasification reactions between KOH and carbon surface causing delamination of carbon [38,39].
Boehm titrations
It was observed that the chemicals used in the activation process have an important role in the development of porosity. They also altered the surface chemistry of the synthesized carbon monoliths, as seen in the results reported in Table 2.
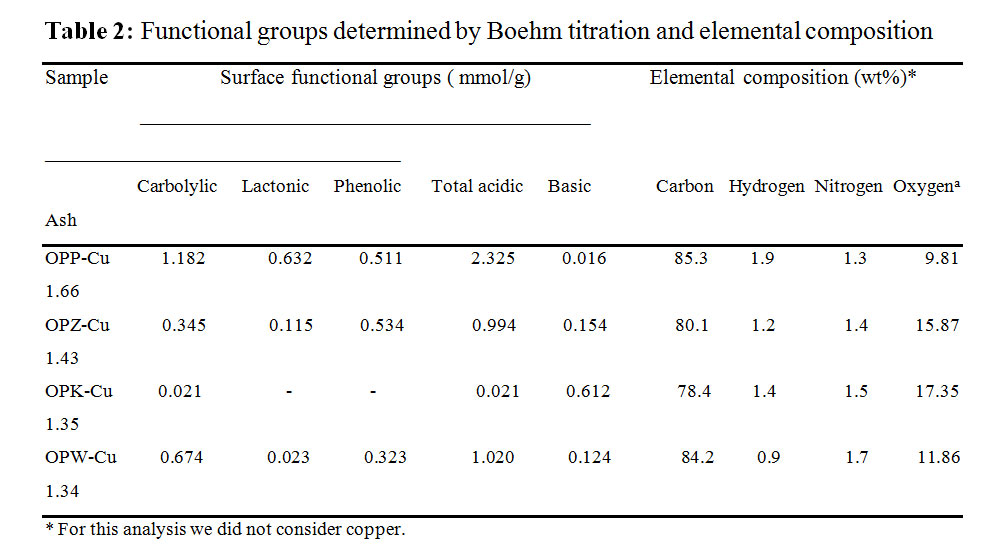 |
Table2: Functional groups determined by Boehm titration and elemental composition |
Acid and base treatments for surface modification were carried out with phosphoric acid, chloride zinc, potassium hydroxide and vapor water to study the effects on the retention of NOx. Table 2 shows the results of Boehm titrations in terms of the total acidic and basic groups, in addition to the lactonic and phenolic groups. The results show an increase in acidic groups in the OPP-Cu activated carbon monolith, which was expected because H3PO4, promoted primarily acidic groups. The results of the elemental analysis show that treatment with this base led to a decreased carbon content while the oxygen content increased. Treatment with phosphoric acid, zinc chloride and water vapor generated acidic groups. With the introduction of phosphoric acid into the activated carbon honeycomb monoliths, the number of oxygen functional groups increased, including O-H, C=O, and C-OH groups, which provided acidic characteristics.
XPS analysis
Figure 3 shows the XPS results of each of the activated carbon honeycomb monoliths prepared and impregnated with cooper taken after being subjected to the NOx retention process. These XPS results show the characteristic bands of C and O, along with the presence of K (in the case of the monoliths OPK-Cu), Zn (OPZ-Cu) and N. The characteristic bands of Cu were also present.
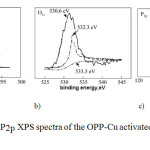 |
Fig3: The C1s, O1s, P2p XPS spectra of the OPP-Cu activated carbon honeycomb monolith Click here to View figure |
The XPS results for the OPP-Cu activated carbon honeycomb monoliths are presented in Figure 3, which show the chemical surface characteristics of this activated carbon monolith, where they realize a deconvolution at the high resolution C1s, O1s and P2p peaks (see Figures 3a, 3b and 3c).
The analysis showed high resolution for the C1s, O1s and P2p spectra, demonstrating the elemental composition of the activated carbon honeycomb monoliths on the surface and a variety of positions corresponding to different binding energies (BE). In the deconvolution of spectra of P2p, there were two major peaks [40,41]: peak 1 (134.0 to 134.6 eV), metaphosphate (M[PO3] n, n = 2-8, and peak 2 (133.6 to 134.7 eV), corresponding to the compounds (PhO) and 3PO (Ph indicates a phenyl group, C6H5). In this particular case, the P atom is bonded to four O atoms by a double bond and three single bonds.
When the P atom is bonded to one carbon atom and three O atoms [e.g. CH3OP(OH)2], the P2P peak moves to ca. 133.6 eV. Comparing the areas under the curves of peaks 1 and 2, the latter is larger, so the previous assignment suggests that the P atom in the OPP-Cu monolith was present mainly on the carbon surface by binding to O atoms.
Additionally, the XPS spectra for the OPZ-Cu monolith (Figure 4) show peaks similar to those described for the OPP-Cu monolith, but with no peaks for P. An additional peak in this monolith corresponded to zinc.
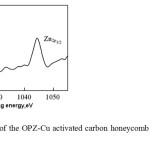 |
Fig4: XPS pattern of the OPZ-Cu activated carbon honeycomb monoliths supporting copper. Click here to View figure |
The energies of Zn2p1/2 and Zn2p3/2 for the products were observed around 1044.3 eV and 1021.2 eV, respectively. Another peak was also present, which was assigned to OH groups bound to Zn. This indicates that zinc remained inside the pores of the OPZ-Cu monolith during chemical activation.
For the case of the OPK-Cu activated carbon honeycomb monoliths, an interesting observation was the presence of the bands when the spectra are deconvolutionated, two bands are showed: of K-O bonds (531-33 eV), whereas that at 534 eV is presented another band is associated to strongly adsorbed water molecules (see figure 5)
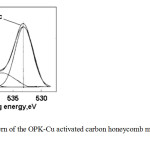 |
Fig5: A XPS pattern of the OPK-Cu activated carbon honeycomb monoliths supporting copper Click here to View figure |
Figure 6 shows the characteristic XPS bands for copper; these are common and similar in all samples prepared in this research. This figure represents the curve level spectrum of the Cu2p peak over 930–970 eV corresponding to CuO/OPP (OPZ-OPK-OPW). The peaks observed at 933.8 eV and 943.8 eV were assigned to Cu2p3/2 and Cu2p1/2, respectively. Additionally, two satellite peaks were observed at 953.9 eV and 962.3 eV, which were positioned at higher binding energies compared to the main peaks. The difference between them was found to be 9 eV, further confirming that the oxide in the sample was CuO [42].
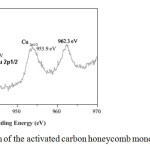 |
Fig6: XPS pattern of the activated carbon honeycomb monoliths with copper. Click here to View figure |
XPS recorded the corresponding nitrogen compounds after the adsorption of NOx. All the monoliths prepared in this study had very similar spectra. Figure 7 shows one example.
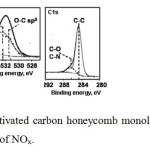 |
Fig7: XPS pattern of activated carbon honeycomb monoliths using as supporting of copper after the adsorption of NOx.Click here to View figure |
As can be seen, nitrogen complexes formed on the activated carbons honeycombs monoliths, including activated pyridine N-oxide (NX), N-quaternary complex (NQ) and NO2, showing the catalytic activity of NOx retention by the prepared monoliths. It was not possible demonstrate if nitrogen were absorbed on catalyst or from the catalyst was transferred to internal sites in the carbonaceous matrix by the XPS technique because by this technique does not is possible detect these complexes. Oxygenates were analyzed, and as can be seen for all samples in general, gasification of the carbonaceous material occurred, which possibly led to dissociative chemisorption of NO, forming complexes with low stability, such as CO and CO2, which were desorbed. Also, the XPS analysis showed a decrease in the O1s signal bonding energies between 532 eV and 534.8 eV, which correspond to oxygenated compounds such as CO, C=O and -COO-, which formed after the adsorption of NO by the sample. Nitrate and nitrite may decompose to NO2, which can be converted to NO, and a complex on the surface is then oxygenated and resorbed as CO2. The XPS results for the activated carbon honeycomb monoliths show a considerable increase in oxygenated compounds, which could mean that NO chemisorption occurred dissociatively on the catalyst and that oxygen was transferred into the carbon matrix via a spill-over mechanism
NOx profiles
The activated carbon honeycomb monoliths were tested for their ability to remove NOx. The experimental results are shown in Figure 8. The activated carbon monoliths containing higher acidity showed an increased ability to remove NOx. This is in good agreement with the textural properties determined for the monoliths prepared in this investigation, which shows that the pore size distribution and surface area plays an important role in the removal of NOx. From the above, it can be established that the monoliths with a larger surface area favored the retention of NOx and particularly those without higher microporosity (OPP-Cu). Figure 8 shows that the OPP-Cu monolith effectively removed 100% of the incoming NOx gas for about 150 min. To demonstrate the effect on NOx retention, the carbon monoliths were impregnated with copper (OP). As shown by the graph, this led to reduced removal times, indicating that copper is an effective catalyst.
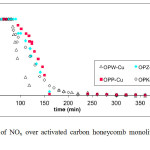 |
Fig8: Removal of NOx over activated carbon honeycomb monoliths prepared from orange peel. Click here to View figure |
The low retention of NOx in the metal-free pure monoliths (OP) (results not shown here) has been explained by reports published in the literature that showing that the retention of NOx is improved when oxygen molecules are present. Therefore, the selectivity to NOx generally decreases after oxygen combustion, which explains why these monoliths not completely removed NOx.
Regarding the mechanism of adsorption – process descomposión studied in the presence of O2 to the removal of NO in the activated carbon monolith , the literature suggests that such materials act as catalyst for the conversion of NO to NO2 in the presence of O2 and then NO2 is adsorbed on the carbon surface [7,12]. For the formation of NO2 adsorbed multiple paths [31,32] between which is suggested that first the dissociatively adsorbed oxygen on the carbon surface and then reacts with NO to form NO2 effluent adsorbed . Similarly, other authors reported that NO reacts with adsorbed atomic oxygen to form NO2 adsorbed , and then by oxidation with oxygen adsorbed on a neighbor, or by disproportion position NO3 formation occurs . A scheme of forming reactions are shown below.
NO + O (a) → NO2 (a)
Where O (a) is the adsorbed active oxygen.
Oxidation route : NO2 (a) + O (a) → NO3
Disproportionation route : 2NO2 (a) → NO3 + NO
Other routes have been reported in the scientific literature but does not conclusive. This study may be suggest that taking into account the chemical characterization of monoliths, this point improved the retention of NO. The another hand, the presence of copper promotes the retention of NO to the surface level of the monoliths , which is associated with the presence of oxygenated groups which favor the retention of the chemical level the NO and additionally the presence of ash also contribute to this activity chemically for NO retention.
CONCLUSIONS
This investigation showed that activated carbon honeycomb monoliths obtained from orange peels are solid porous, efficient for NOx retention. The retention capacity for NOx was affected by the texture and specically by chemical properties of the monoliths. Activated carbon honeycomb monoliths in the presence of ZnCl2 and KOH showed a higher capacity to retain NOx, as shown by the adsorption profiles for NOx, where they adsorbed 100% NOx for a longer period of time.
XPS analysis showed the presence of the respective elements according to the activation procedure with which the activated carbon honeycomb monoliths were synthesized from orange peel. Additionally, the surface showed different NOx compounds.
ACKNOWLEDGMENTS
The authors thank the framework agreement between the Universidad de los Andes (Bogotá, Colombia) and Universidad Nacional de Colombia (Sede Bogotá) under which this investigation was conducted. Special thanks also go to the Faculty of Science and the Vice-Rectory of Research at the University of the Andes (Bogotá, Colombia) for funding this research.
REFERENCES
- Ebner, A.; Ritter, J. Sep. Sci. Technol. 2009, 44, 273-1281
- Bastin, L.; Garcia, P. S. B.; Hurtado, E. J.; Silva, J.A.C.; Rodrigues, A. ; Chen, B. J. Phys. Chem. C. 2008,112,1575-1581
- Kim, S.N. ; Son, W.J. ; Choi, J.S.; Ahn, W.S. Microp. and Mesop. Mat. 2008, 115, 497-503
- Merel, J.; Clausse, M.; Meunier, F. Ind. Eng. Chem. Res. 2008, 47, 209-215
- Choi, S.; Drese, J.H.; Jones, C.W. Chem. Sus. Chem. 2009, 2, 796– 854
- Gray, M.L.; Soong, Y.; Champagne, K.J.; Baltrus, J.; Stevens, R.W.; Toochinda, P.; Chuang, S.S.C. Sep. Purif. Technol. 2003, 35, 31-36
- Cavenati, S.; Grande, C.A.; Rodrigues, A.E. Chem. Eng. Sci. 2006, 61, 3893-3906
- Dantas, T.L.P.; Amorim, S.M.; Luna, F.M.T.; Silva Jr, I.J.; Azevedo, D.C.S.; Rodrigues, A.E.; Moreira, R.F.P.M. Sep. Sci. Technol. 2010, 45, 73-84
- Sumida, K.; Rogow, D.L.; Mason, J.A.; McDonald, T.M.; Bloch, E.D.; Herm, Z.R.; Bae, T.H.; Long, J.R. Chem. Rev. 2012. Special issue
- Xiao, Y.; Low, Bt.; Hosseini, S.S.; Chung, T.S.; Paul, D.R., Prog. Polym. Sci. 2009, 34, 561–580
- Li, S.; Carreon, M.A.; Zhang, Y.; Funke, H.H.; Noble, R.D.; Falconer, J.L. J. Membr. Sci. 2010, 352 (1–2) 7-13
- Williams, J.L. Catalysis Today. 2001, 69, 3-9
- Gadkaree, K.P. and Mach, J.F. Method of making activated carbon honeycombs having vaying adsorption capacities, Patent 5510063. New York. (1996)
- Gatica, J.M. ; Rodriguez-Izquierdo, J.M.; Sánchez, D.; Chafik, T.; Harti, S.; Zaitan, H.; Vidal, H. C.R. Chimie. 2006, 9, 1215-1220
- Nijhuis, T.A.; Beers, A.E.W.; Vergunst, T.; Hoek, I.; Kapteijn, F.; Moulijn, J.A. Catal. Rev. 2001, 42, 345-380
- Lozano,D.; Cazorla, D.; Linares, A.; Quinn, D.F. Carbon. 2002, 40, 2817-282.
- Álvarez, P.; Santamaría, R.; Blanco, C.; Granda, M. J. Anal. Appl. Pyrolysis. 2005,74, 337-343
- Stoeckli, F.; Centeno,T.A.; Donnet, J.B.; Pusset, N.; Papirer, E. Fuel. 1995,74, 1582-1588
- Nakagawa,Y.; Molina-Sabio, M.; Rodríguez-Reinoso, F. Micropor. Mesopor. Mat. 2007,103, 29-34
- Yorgun, S.; Vural, N.; Demiral, H. Micropor Mesopor Mater. 2009, 122, 189-194
- Vargas-Delgadillo, D.; Giraldo, L.; Moreno-Piraján, J.C. E-J. Chem. 2010, 7, 531-539
- Boehm, H.P. Chemical Identification of Surface Groups, in: D. D. Eley, H. Pines, P. B. Weisz (Eds.), Advances in Catalysis, Academic Press., New York, (1966)
- Boehm, H.P. Carbon. 2002, 40,145-149
- Baquero, M.C.; Giraldo, L.; Moreno-Piraján, J.C.; Suárez-García, F.; Martínez-Alonso, A.; Tascón, J.M.D. J. Anal. Appl. Pyrolysis. 2003, 70, 779-784
- Ismadji, S.; Bhatia, S.K. Carbon, 2001, 39, 1237-1250
- Marsh, H.; Rodríguez-Reinoso, F. Activated Carbon, Elsevier, Oxford, 2006
- Baker, F.S.; Miller, C.E.; Repik, A.J.; Tolles, E.D. Activated Carbon, in: Kirk-Othmer Encyclopedia of chemical technology, vol. 4, John Wiley & Sons, New York, 1992, pp. 1015-1034
- Molina-Sabio, M.; Rodríguez-Reinoso, F. Colloids and Surfaces A: Physicochem. Eng. Aspects. 2004, 241, 15-25
- Caturla, F.; Molina-Sabio, M.; Rodríguez-Reinoso, F. Carbon, 1991, 29, 999-1012.
- Abechi, S.E.; Gimba, C.E; Uzairu, A.; Dallatu, Y.A. Res. J. Chem. Sci. 2013, 3, 54-61
- Sirichote, O.; Innajitara, W.; Chuenchom, L.; Chunchit, D.; Naweekan, K. J. Sci. Technol. 2002, 24, 235- 242
- Collins, J.C.; Zain, M.F.H.; Dek, F.S. J. Anal. Sci. 2006, 10, 1-6
- Okieimen, F.E; Ojokoh, F.I.; Okieimen, C.O; Wuana, R.A. Chemclass J. 2004, 2,191-196
- Bansal, C.R.; Goyal, M. Activated carbon adsorption, Taylor and Francis, London, 2005
- Díaz-Terán, J.; Nevskaia, DM.; Fierro, J.L.G.; López-Peinado, A.J.; Jerez, A. Micropor. Mesopor. Mat. 2003, 60, 173-181
- Lillo-Ródenas, M.A.; Cazorla-Amorós, D.; Linares-Solano, A. Carbon. 2003, 41 267-275
- Otawa, T.; Yamada, M.; Tanibata, R.; Kawakami, M. In: Vansant E.F., Dewolfs R. (Eds). Gas Separation Technology, Elsevier, Amsterdan, (1990)
- Ehrburger, P.; Addoun, A.; Addoun, F.; Donnet, J.B. Fuel. 1986, 65, 1447-1449
- Marsh, H, Yan, D.S., O´Grady, T.M.; Wennenberg, A. Carbon. 1984, 22, 603-611.
- Wu, X.X.; Radovic, L. Carbon. 2006, 44, 141-151
- Tao, X.; Xiaoqin, L. J. Chem. Eng. 2008, 16, 401-406
- Shaikh, J.S.; Pawar, R.C.; Moholkar, A.V.; Kim, J.H.; Patil, P.S. Appl. Surf. Sci. 2011, 257, 4389-4397

This work is licensed under a Creative Commons Attribution 4.0 International License.
![]()
A New Edition of Web of Science
Journal Impact Factor
2022: 0.5
Five Year: 0.8
Journal is Indexed in

Cabells Whitelist
![]()


