FTIR, UV-Vis, magnetic, mass spectral and XRD studies of Ni(II) complex with pioglitazone: An oral antidiabetic drug
Om Prakash Chouhan1, and George Jacob2
1Department of Chemistry, Saifia Science College, Barkatullah University, Bhopal-462001, India
2Department of Science, Lawrence Park, Ontario, Canada
DOI : http://dx.doi.org/10.13005/ojc/300407
Article Received on :
Article Accepted on :
Article Published : 15 Dec 2014
Metal complex of pioglitazone hydrochloride (PLZ) drug with Ni(II) ion is synthesized and characterized using analytical data, molar conductance, IR, UV-Vis, magnetic, mass spectral and XRD studies. From the analytical data, the complex is proposed to have general formula [(C19H19N2O3S)+2 Ni]2Cl-. The conductometric titration using monovariation method reveals that complex is L2M type. The molar conductance data indicates that the metal chelate is ionic. IR spectra show that PLZ is coordinated to the metal ions in which ligand molecules lie horizontally joining the central Ni(II) atoms. The electronic spectra and magnetic moment reveal that the chelate have tetrahedral geometry. Mass spectra is also used to confirm the proposed formula and the possible fragments resulted from fragmentation of PLZ and its Ni(II) complex. XRD data also used to calculate the various parameters like particle size, porosity, volume of unit cell and density.
KEYWORDS:pioglitazone; metal complex; IR; UV-Vis; magnetic; mass; XRD
Download this article as:| Copy the following to cite this article: Chouhan O. P, Jacob G. FTIR, UV-Vis, magnetic, mass spectral and XRD studies of Ni(II) complex with pioglitazone: An oral antidiabetic drug. Orient J Chem 2014;30(4). |
| Copy the following to cite this URL: Chouhan O. P, Jacob G. FTIR, UV-Vis, magnetic, mass spectral and XRD studies of Ni(II) complex with pioglitazone: An oral antidiabetic drug. Available from: http://www.orientjchem.org/?p=5874 |
Introduction
Pioglitazone hydrochloride is an oral antidiabetic agent that has been shown to affect abnormal glucose and lipid metabolism associated with insulin resistance by enhancing insulin action on peripheral tissues in animals. It is used in the treatment of type-II diabetes also known as non‐insulin‐dependent diabetes mellitus1 (NIDDM) or adult‐onset diabetes. Currently, it is marketed under the trade name Actos It belongs to a class of compounds known as the “thiazolidinediones”. Pioglitazone hydrochloride (C19H20N2O3S·HCl) exists as an odorless white crystalline powder. It has structural formula as shown in Fig.1, with a molecular weight 392.90 daltons. It has low solubility and high permeability. It is insoluble in water and ether, little soluble in acetonitrile and acetone, and completely soluble in dimethylformamide (DMF). For oral administration it is available in the form of tablets in market. It exhibits slow gastrointestinal absorption rate and inter individual variation of its bioavailability2. A survey of literature reveals that metal complexes of many drugs have been found to be more effective than the drug alone3 therefore, much attention is given to the use of thiazolidinedione hydrochloride due to their high complexing nature with essential metals. In view of the above and in continution of our work, it is interesting to have an insight into the synthesis of nickle complex with pioglitazone and to diagnose various structural aspects of the isolated complex. Here the synthesis and characterization of nickle chloride with pioglitazone hydrochloride has been described.
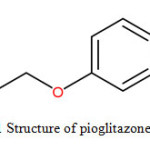 |
Fig1: Structure of pioglitazone hydrochloride Click here to View figure |
Experimental
Ligand- Metal Ratio
(a). To find out the ligand metal ratio, initially conductometric titration using monovariation method are carried out at 27±1 ºC and 0.005 M solution of pioglitazone hydrochloride is prepared in DMF. Similarly, solution of nickle chloride (NiCl2) is prepared in the ethanol of 0.01M concentration. 10 ml of ligand is diluted to 100 ml with the same solvent. The ligand is titrated conductometrically against metal salt solution taken in burette using fraction of 1ml. Conductance is recorded after each addition with proper stirring. Results is plotted in the form of graph between corrected conductance and volume of metal salt added. From the equivalence point in the graph, ratio between ligand and metal are noted to be 2:1 (L2M).
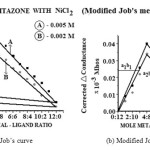 |
Fig2: (a) Job’s curve (b) Modified Job’s curve Click here to View figure |
Material and Method
All chemicals are used of analytical grade (A. R.). They include pure pioglitazone hydrochloride with molecular formula (C19H20N2O3S.HCl), received from Morepen Laboratories, Distt. Solan (H. P.) India. The metal salt of NiCl2 obtained from Hi media Laboratory, Mumbai, India. Ethanol and DMF were used as a solvent.
Synthesis of Complex
A weighed quantity of “Pioglitazone” (2 mole) is dissolved separately in minimum quantity of DMF. The NiCl2 solution is prepared by dissolving separately in the ethanol. Ligand solution is added slowly with stirring into the solution of metallic salt at room temperature; maintain the pH between 6.0 to 6.5 by adding dilute NaOH solution. On refluxing the mixture for 3-4 h and on cooling, the precipitates of metal complex is obtained, which are filtered off, washed well with DMF and ethanol finally dried in vacuum and weighed.
Instrumentation
Molar conductances of complexes are measured by using Systronics Digital Conductivity meter. The elemental analysis of the isolated complex is carried out by using Coleman Analyzer Model at the Departmental Micro Analytical Laboratory, CDRI, Lucknow, India. IR spectra of ligand and complex are recorded with Perkin Elmer Model 577 Spectrophotometer in the range of 4000-450 cm-1 as KBr pellets CDRI, Lucknow, India. The UV-Vis spectra of the ligand and complex are recorded with Perkin ElmerUV Winlab in the range of 200-800 nm Punjab University, Chandigarh, India. The ESI-MS Mass Spectra of pioglitazone and its nickle complex are performed on Waters UPLC-TQD Mass Spectrometer at CDRI, Lucknow, India which provides information about the complex by examining the fragmentation pattern and total mass of the complex. X–ray diffraction studies are carried out by X–ray Diffractometer model with 45kV rotating anode and Cukα (1W=1.54060A°) radiation at Punjab University, Chandigarh, India. The samples are scanned in the range 10.000° to 79. 9784° (2θ) powder data were indexes using computer software (FPSUIT V2.0).
Results and Discussion
The formation of metal complex with organic compounds has long been recognized. The synthesized complex is coloured and stable, being soluble in DMSO and insoluble in water, ethanol etc. Analytical data and conductometric studies suggest 2:1 (L2: M) ratio. Structures for the complex is shown in Fig. 3.
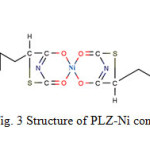 |
Fig3: Structure of PLZ-Ni complex. Click here to View figure |
Composition of Metal Complex
The isolated solid complex of Ni metal ions with the PLZ ligand is subjected to elemental analyses (C, H, N, S and metal content) and molar conductance. The results of physical and analytical data are given in Table 1.
Table 1 Physical and analytical data of PLZ-Ni complex.
|
Ligand/Complex |
Color (Yield %) |
m.p. (°C) |
Elemental analysis calculated (found) |
Am (Ω-1mol-1cm2) |
Log K (L/mole) |
ΔF (Kcal/mole) |
|||||
|
C |
H |
N |
S |
Metal |
2Cl– |
||||||
| C21H27N5O4S |
white
|
208 |
56.55 (56.45) |
6.05 (6.01) |
15.71 (15.65) |
7.18 (7.13) |
– – |
– – |
– – |
– – |
– – |
| [(C21H26N5O4S)2 Ni]Cl2- |
Off white (68.34) |
242 |
49.80 (49.12) |
4.15 (3.80) |
6.11 (6.26) |
6.99 (6.87) |
6.41 (6.22) |
7.75 (7.65) |
45.08 |
11.65 |
-16.04 |
Infra-Red Spectral Studies
The IR spectra of ligand and isolated complex are recorded within the range 4000-400 cm-1. In order to determine the coordination sites that may be involved in chelation, we compared the IR spectra of the PLZ with their Ni complex as shown in Fig. 4(a, b).
The stretching vibration band in ligand at 3613 cm-1 can be ascribed to N-H group but in the complex this group is found at 3656 cm-1. The C=O stretching frequency of the ligand appear at 1675cm-1 while in nickle complex, it is shifted at 1626 cm-1. The shift of C=O group by changing frequency in the complex indicate that these are involved in the complexation. New bands are found in the spectra of complexes in the region 507 cm-1 which is assigned to M-O stretching vibrations. The proposed structure for the isolated complex is also supported by IR absorptions 12-18.
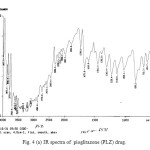 |
Fig4(a): IR spectra of pioglitazone (PLZ) drug. Click here to View figure |
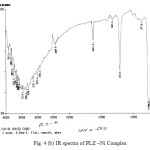 |
Fig4(b): IR spectra of PLZ –Ni Complex Click here to View figure |
UV-Visble and magnetic moment studies
The electronic spectra of Ni complex Fig.5 show three bands at 10845 cm-1, 15076 cm-1 and 10768 cm-1 are assigned to 3A2g(F) → 3T2g(F), 3A2g(F)→ 3T1g(F) and 3A2g(F) → 3T1g(P) transitions respectively indicated for tetrahedral geometry around Ni(II) complex19-20. The magnetic moment value of Ni(II) complex is 3.36 B.M suggests the presence of two unpaired electrons, which reveals the spin free nature of the complex corresponding a tetrahedral stereo chemistry.
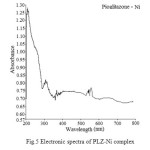 |
Fig5: Electronic spectra of PLZ-Ni complex Click here to View figure |
Mass Spectral Studies
Mass spectra represent the intensities of signals at various m/z values. It is highly characteristic of the compound that no two compounds can have similar mass spectra. It provides information regarding the molecular structure of organic and inorganic compounds. Mass spectrum of PLZ and its Ni complex are presented in Fig.6 (a)-(b).
Assignment of Ni complex, molecular formula i.e. [(C19H19N2O3S)+2 Ni]2Cl–, (Mol.Wt.= 915.39), m/z 918 due to [(C19H19N2O3S)+2 Ni]2Cl– or (ML2∙)+. Molecular ion peak (m+.); m/z 358 due to [C19H20N2O3S)]+ . base peak ion 100% relative abundance, m/z 223 due to [C10H9NO3S]+. m/z 136 due to [C9H12N]+., m/z 120 due to [C8H10N]+. radical ion respectively.
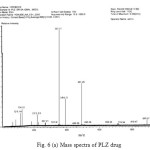 |
Fig6(a): Mass spectra of PLZ drug Click here to View figure |
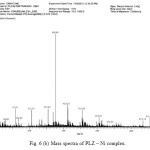 |
Fig6(b): Mass spectra of PLZ – Ni complex. Click here to View figure |
X-Ray Diffraction Studies
The crystallographic data (scattering angles, d-spacing, and relative intensities) for PLZ – Ni complex is calculated by using computer software (FPSUIT 2.0V). The X-ray diffraction pattern for Ni complex is shown in Fig. 7. It can be seen from the figure that the main characteristic scattering peaks for PLZ-Ni are at 18°, 20°, 28° and 30° positions.
From the crystallographic data21-26 unit cell parameters are obtained for Ni complex which attributed to orthorhombic crystal system. The particle size of pioglitazone-nickle complex is 19.871 microns respectively, which is calculated from X-ray line broadening using the Scherrer formula; t = kλ β cosΦ where t is the thickness of the sample, κ is a coefficient and is equal to 0.89 here, β is the half-maximum line width, and λ is the wavelength of X-rays.The porosity is 0.211% calculated by formula;
dtrue – dobs Χ 100 dtru and volume of the unit cell is 14059.63A° which is calculated by Volume (Å) = abc where a, b and c are lattice parameters. Density =weight /volume is found 0.0595 g/cm3 respectively.
and volume of the unit cell is 14059.63A° which is calculated by Volume (Å) = abc where a, b and c are lattice parameters. Density is found 0.0595 g/cm3 respectively.
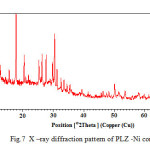 |
Fig7: X –ray diffraction pattern of PLZ -Ni complex. Click here to View figure |
Conclusion
In the present paper, we have synthesized the complex of pioglitazone drug with Ni(II) metal. The structure of the complex is confirmed by the spectroscopic techniques and XRD study. Analytical data agrees with the molecular formula of the complex. Molar conductance value supports the ionic nature of the complex. The tentative structure assigned to the complex on the basis of analytical data were further supported by modren spectroscopic methods like IR, Mass spectral studies. In mass spectra of nickle complex the base peak of the ligand appear on m/z 358 while short peak for Ni complex appear on m/z 915 which is quite supportive. A detailed study of X-ray also supports the complex formation and various parameters such as particle size, porosity, volume of unit cell and density of synthesized complex is evaluated.
References
- Abbasi, F.; Lima, N. K.; Reaven, G. M. Metabolism. 2009, 58, 373‐378.
- Kouichi, Diab. Res. Clin. Pract. 2005, 68, 250-257.
- Sharma, S.; Iqbal, S. A.; Bhattacharya, M. Orient. J. Chem. 2009, 25(4), 1101-1104.
- Job, P. Annales de Chimie. 1928, 10, 113.
- Turner, S. E.; Anderson R. C. J. Am.Chem. Soc. 1949, 71(3), 912–914.
- Irving, H.; Rossotti, H.S. J. Chem. Soc.1955,1176.
- Irving, H.; Rossotti, H.S. J. Chem. Soc.1954, 3397.
- Irving, H.; Rossotti, H.S. J. Chem. Soc.1953, 2904.
- Prakash, Om.; Krishan, B.; Jacob, G. Orient. J. Chem. 2013, 29(2), 823-828.
- Prakash, Om.; Iqbal, S. A.; Jacob, G. Orient. J. Chem. 2013, 29(3), 1079-1084.
- Iqbal, S. A .; Zaafarny, I. Orient. J. Chem. 2012, 28, 613-618.
- Weissberger, A. Inter Science Publ. New York. XI, (1956).
- Nakamotto, K. John Willey and son’s. New York.(1963).
- Rao, C. N. R. Academic press, New York. (1963).
- Dyer, J. R. Prentice Hall of India Pvt. Ltd. (1966).
- Tawkir, M.; Khairou, K.; Zaafarany, I. Orient. J. Chem. 2012, 28(4), 1697-1710
- Krishan, B.; Tawkir, M.; Iqbal, S. A. Orient. J. Chem. 2012, 28(4), 1883-1888.
- Chauhan, G. R.; Kharadi, G. J.; Patel, K. D. Orient. J. Chem. 2010, 26(4), 1431-1436.
- Van Vleck, J. H.; Frank, A. Physical Review. 1929, 34(1), 1494-1496.
- Rastogi, G.; Rastogi,R. K.; Ahmad S. Orient. J. Chem. 2008, 24(3),1077-1080
- Krishan, B.; Prakash, O.; El-Mossalamy, E. H. Orient. J. Chem. 2013, 29(1), 381-388.
- Krishan, B.; Tawkir, M.; Iqbal, S. A. Orient. J. Chem. 2012, 28(4), 1883-1888.
- Tawkir, M.; Krishan, B.; Iqbal, S. A.; Zaafarany, I. Material Science Research india. 2010, 9(1), 93-98.
- Bragg, W. L.; Bragg, W. H. The crystalline state -A general survey, London, (1993).
- Jenkins, R.; Devries, J. L. Worked examples in X-ray analysis, New York, Springer Verlog (1970).
- Chouhan, O. P.; Chouhan, H. Material Science Research india. 2014, 11(1), 75-81.

This work is licensed under a Creative Commons Attribution 4.0 International License.
![]()
A New Edition of Web of Science
Journal Impact Factor
2022: 0.5
Five Year: 0.8
Journal is Indexed in

Cabells Whitelist
![]()


