Experimental and Quantum chemical studies on the inhibition potential of some Quinoxaline derivatives for mild steel in acid media
1Department of Chemistry, PSGR Krishnammal College for Women, Tamil Nadu, India
2Department of Physics, Bharathiar University, Tamil Nadu, India
3Department of Physics, PSGR Krishnammal College for Women, Tamil Nadu, India
DOI : http://dx.doi.org/10.13005/ojc/300431
Download this article as:
![]()
The inhibition potential of four Quinoxaline derivatives namely 1,4-dihydroquinoxaline-2,3-dione, (3E)-3-hydrazinylidene-3,4-dihydroquinoxalin-2(1H)-one, 1-[(2E)-3-oxo-3,4-dihydroquinoxalin-2(1H)-ylidene]urea and 1-[(2E)-3-oxo-3,4-dihydroquinoxalin-2(1H)-ylidene]thiourea have been investigated against mild steel in 1M H2SO4 solution using conventional weight loss, electrochemical impedance spectroscopy, potentiodynamic polarization and atomic absorption spectroscopy. The percentage inhibition efficiency was found to increase with increase in the inhibitor concentration due to the adsorption of the inhibitor molecules on the metal surface. In addition, it was established that the adsorption follows Langmuir adsorption isotherm. Moreover, some thermodynamic data were calculated and discussed. The density functional theory at the B3LYP/6-311G (d,p) basis set level was performed for two inhibitors namely 1,4-dihydroquinoxaline-2,3-dione and (3E)-3-hydrazinylidene-3,4-dihydroquinoxalin-2(1H)-one. The quantum chemical parameters such as highest occupied molecular orbital energy (EHOMO), lowest unoccupied molecular orbital energy (ELUMO), energy gap (∆E), dipole moment (µ), softness (σ), hardness (η), electronegativity (χ), Mulliken atomic charges, the fraction of electrons transferred from the inhibitor to the metal surface (∆N) and the total energy (TE) have been calculated for these compounds. It was found that theoretical data support the experimental results.
KEYWORDS:adsorption; quinoxaline; impedance; density functional theory; softness
Introduction
Corrosion problems have received a considerable amount of attention because of their economic and safety consequences. The use of inhibitors is one of the most practical methods for protection against corrosion. Most of the efficient inhibitors used in industry are organic compounds which may contain oxygen, sulphur, nitrogen and multiple bonds in the molecule through which they are adsorbed on the metal surface (1). Moreover, many N-heterocyclic compounds have been used as effective inhibitors for the corrosion of metals and alloys in aqueous media. Though the existing data show that numerous N-heterocyclic organic compounds have good anticorrosive activity, some of them are highly toxic to both human beings and environment (2). The safety and environmental issues of corrosion inhibitors arisen in industries has always been a global concern. These toxic effects have led to the use of eco-friendly and harmless N-heterocyclic compounds as inhibitors.
Quinoxaline derivatives as an important N-heterocyclic compounds are easy to synthesize and readily available. Their ring moiety constitutes part of the chemical structures of various antibiotics such as echinomycin, levomycin and actinoleucin (3). The aim of this paper is to further explore the use of 1, 4-dihydroquinoxaline-2, 3-dione derivatives as corrosion inhibitor for mild steel in sulphuric acid solution using chemical and non-electrochemical methods. The choice of this compound was based on the consideration that this compound contains many π electrons and two N atoms that induce greater adsorption of the inhibitor compared with compound containing only one N atom.
The objective of this work is to investigate the inhibition efficiency of some quinoxaline derivatives by electrochemical and non-electrochemical methods and to determine the molecular properties of two selected quinoxalines by Density functional theory (DFT). Quantitative structure activity relationship (QSAR) approach is utilized to determine possible correlation between experimental inhibition efficiencies of the two compounds and two or more quantum mechanical parameters.
Experimental method
Cold rolled mild steel specimen of size 1cm x 3 cm x 0.08 cm having composition 0.084% C, 0.369% Mn, 0.129% Si, 0.025% P, 0.027% S, 0.022% Cr, 0.011% Mo, 0.013% Ni and the reminder iron were used for weight loss measurements. For electrochemical methods, a mild steel rod of same composition with an exposed area of 0.785 cm2 was used. The specimens were polished with 1/0, 2/0, 3/0 and 4/0 grades of emery sheets, degreased with trichloroethylene, and dried using a drier. The plates were kept in a desiccator to avoid the absorption of moisture.
Synthesis of the inhibitor
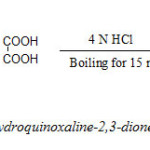
Step 1: Synthesis of 1,4-dihydroquinoxaline-2,3-dione (I) (DQD)
A mixture of oxalic acid (6.5 g) and o-phenylenediamine (5.5 g) were dissolved in 4N HCl. The solution was allowed to boil for 15 minutes. A crystalline solid appeared which was cooled, washed with water and dried. The compound was dissolved in alkali and acidified with HCl. Pure quinoxaline-2,4-dione was obtained as white needles. Yield: 3g. Melting point: >3500C.
 |
Scheme 1 Click here to View scheme |
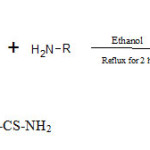
Step 2: Synthesis of 1,4-dihydroquinoxaline-2,3-dione derivative (IIa-c)
A mixture of the 1,4-dihydroquinoxaline-2,3-dione (1 mole), amine (NH2-NH2/urea/thiourea) (1 mole) and ethanol (50 ml) were heated under reflux for 2 hour, then cooled to room temperature. The precipitate was filtered, washed with water and recrystallized from 2-butanol.
 |
Scheme 2Click here to View scheme |
R = -NH2 , -CO-NH2 , -CS-NH2
1,4-dihydroquinoxaline-2,3-dione (DQD) I
Yield: 88%, Melting Point = >350ºC, white crystals, IR Spectrum (γ/cm-1) : 1250 (C-N); 1719.46 (C=O); 3393.90 (N-H))
(3E)-3-hydrazinylidene-3,4-dihydroquinoxalin-2(1H)-one (HDQD) IIa
Yield: 91%, Melting Point = 320 – 325ºC, yellow crystals, IR Spectrum (γ/cm-1) : 1672.36 (C=N); 1722.36 (C=O); 1546.01 (N-N), 3412.12 (NH2 str)
1-[(2E)-3-oxo-3,4-dihydroquinoxalin-2(1H)-ylidene]urea (ODQDU) IIb
Yield: 94%, Melting Point = 154-156ºC, pale brown crystals, IR Spectrum (γ/cm-1) : 1671.39 (C=N); 1701.06(C=O); 3428.62 (NH2 str)
1-[(2E)-3-oxo-3,4- dihydroquinoxalin-2(1H)-ylidene]thiourea (ODQDTU) IIc
Yield: 93%, Melting Point = 186 – 187ºC, white crystals, IR Spectrum (γ/cm-1) : 1671.39 (C=N); 1201.24 and 798.56(C=S); 3440.19 (NH2 str)
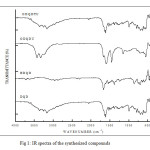 |
Fig1: IR spectra of the synthesized compounds Click here to View figure |
Non-Electrochemical Techniques
Weight loss method
The initial weight of the polished mild steel plates of size 1 cm x 3 cm x 0.08 cm was taken. The solutions were taken in a 100 ml beaker and the specimens were suspended in triplicates into the solution using glass hooks. Care was taken to ensure the complete immersion of the specimen. After a period of 3 hours the specimens were removed, washed with distilled water, dried and weighed.
From the initial and final masses of the plates (i.e., before and after immersion in the solution) the loss in weight was calculated. The experiment was repeated for various inhibitor concentrations in 1M H2SO4. A blank was carried out without inhibitor.
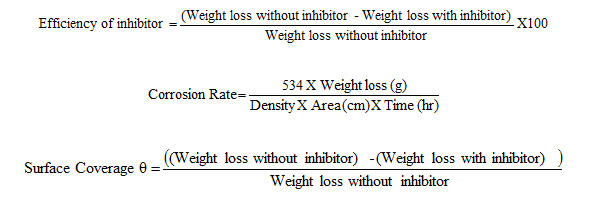
The inhibition efficiency, corrosion rate and surface coverage were calculated from the weight loss results using the formulas,
To study the effect of temperature, the above procedure was carried out at different temperature range i.e., (313-333K) using thermostat with the inhibitor concentration of 10mM.
Activation energy (Ea), Free energy of adsorption (∆G0), Enthalpy and Entropy (∆H0& ∆S0) were calculated using the formula,
where [from Langmuir equation], Ө – Surface coverage of the inhibitor, C- concentration of inhibitor in mM/100 ml
h – Planck’s constant, N – Avogadro number, T – Absolute temperature, R – Universal gas constant.
Atomic Absorption Spectroscopy (AAS)
Atomic Absorption Spectrophotometer (Model GBC 908, Australia) was used for estimating the amount of dissolved iron in the corrodent solution containing various concentrations in 1M H2SO4 after exposing the mild steel specimen for 3hours. From the amount of dissolved iron, the inhibitor efficiency was calculated.
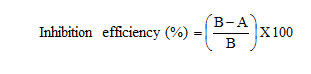
where A and B = amount of dissolved iron in the presence and absence of inhibitors
Electrochemical Techniques
The electrochemical measurements were performed in a classical three-electrode cell assembly with mild steel rod (exposed area 0.78 cm2) as working electrode, a platinum electrode and saturated calomel electrode as counter and reference electrodes. The measurements were carried out with IVIUM Compactstat Potentiostat/Galvanostat. EIS measurements were carried out at a frequency range of 10 KHz to 0.01Hz with a superimposed sine wave of amplitude 10mV. From the plot of Z1Vs Z11 the charge transfer resistance (Rct) and double layer capacitance (Cdl) were calculated
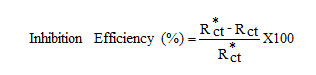
where, Rct and Rct* are the charge transfer resistance obtained in the absence and presence of the inhibitors.
The potentiodynamic polarization curves were obtained from -100 mV to +100 mV (versus OCP) with a scan rate of 1 mV/s .The data were collected and analyzed by IVIUM Soft software.
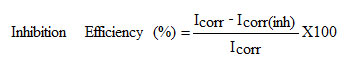
where, Icorr and Icorr(inh) signifies the corrosion current density in the absence and presence of inhibitors.
Synergism
Weight loss measurements were carried out to know the synergistic effect was studied by the addition of 1mM /KCl/KBr/KI to the mild steel specimen immersed in 1M H2SO4 containing various concentrations of the inhibitors for a duration of three hours. From the weight loss the inhibition efficiency was calculated.
Surface Morphology
Surface examinations of mild steel specimens were carried out to understand the surface morphology of mild steel in 1M H2SO4 in the presence and absence of the inhibitors using Medzer biomedical research microscope (Mumbai, India).
Results and Discussion
Non-Electrochemical Measurements
Weight loss measurements
The effect of addition of quinoxaline derivatives tested at different concentrations on the corrosion of mild steel in 1M H2SO4 was studied using weight loss method at 303 K after immersion for 3 hour. The results are given in Table 1.
It is clear that the corrosion rate decreases with the increase in concentration of the compounds tested. The inhibition efficiency increased with increase in the concentration of the 1, 4-dihydroquinoxaline-2, 3- dione derivatives. The maximum inhibition efficiency was achieved at a concentration of 10 mM for ODQDTU (93%) and the least for DQD (79.97%). The percentage inhibition efficiency tends to decrease in the following order
ODQDTU > ODQDU > HDQD > DQD
The protective properties of quinoxalines are probably due to the interaction between π electrons of the two aromatic rings of the quinoxaline and the free pairs of electrons of S, N and O atoms with the positively charged metal surface.
Table 1: Inhibition efficiencies of various concentrations of the inhibitors for corrosion of mild steel in 1M H2SO4 obtained by weight loss measurement at 30±10C
|
Name of the Inhibitor |
Concentration (mM) |
Weight loss |
Inhibition |
Surface Coverage |
Corrosion Rate (g cm-1 hr-1) |
|
BLANK |
– |
0.2212 |
– |
– |
21.92 |
|
DQD |
0.5 |
0.0715 |
67.68 |
0.6768 |
7.09 |
|
1.0 |
0.0667 |
69.85 |
0.6985 |
6.61 |
|
|
2.5 |
0.0604 |
72.69 |
0.7269 |
5.99 |
|
|
5 |
0.0564 |
74.50 |
0.7450 |
5.59 |
|
|
7.5 |
0.0496 |
77.58 |
0.7758 |
4.91 |
|
|
10 |
0.0443 |
79.97 |
0.7997 |
4.39 |
|
|
HDQD |
0.5 |
0.0626 |
71.7 |
0.717 |
6.20 |
|
1.0 |
0.0596 |
73.01 |
0.7301 |
5.91 |
|
|
2.5 |
0.0549 |
75.18 |
0.7518 |
5.44 |
|
|
5 |
0.0478 |
78.39 |
0.7839 |
4.73 |
|
|
7.5 |
0.0424 |
80.83 |
0.8083 |
4.20 |
|
|
10 |
0.0387 |
82.5 |
0.825 |
3.83 |
|
|
ODQDU |
0.5 |
0.0403 |
81.78 |
0.8178 |
3.99 |
|
1.0 |
0.0318 |
85.62 |
0.8562 |
3.15 |
|
|
2.5 |
0.0315 |
85.76 |
0.8576 |
3.12 |
|
|
5 |
0.0298 |
86.53 |
0.8653 |
2.95 |
|
|
7.5 |
0.0289 |
86.93 |
0.8693 |
2.86 |
|
|
10 |
0.0201 |
90.91 |
0.9091 |
1.99 |
|
|
ODQDTU |
0.5 |
0.0385 |
82.59 |
0.8259 |
3.81 |
|
1.0 |
0.0296 |
86.62 |
0.8662 |
2.93 |
|
|
2.5 |
0.0244 |
88.97 |
0.8897 |
2.42 |
|
|
5 |
0.0201 |
90.91 |
0.9091 |
1.99 |
|
|
7.5 |
0.0174 |
92.13 |
0.9213 |
1.72 |
|
|
10 |
0.0148 |
93.31 |
0.9331 |
1.47 |
Effect of temperature
The influence of temperature on the corrosion of mild steel/acid in the presence and absence of inhibitors at a concentration of 10mM was investigated by weight loss method in the temperature range 303 K to 333 K for an immersion period of 1 hour. The results are depicted in Table 2. From the data in Table 2 it is clear that inhibition efficiency decreases with increase in temperature.
Table 2: Inhibition efficiencies of 10mM concentration of the inhibitors for corrosion of mild steel in 1M H2SO4 obtained by weight loss measurement at higher temperature
|
Name of the inhibitor |
Temperature |
Weight loss |
Inhibition efficiency |
Corrosion rate |
|
|
Blank |
303 |
0.0677 |
– |
20.12 |
|
|
313 |
0.1295 |
– |
38.50 |
||
|
323 |
0.2526 |
– |
75.10 |
||
|
333 |
0.5021 |
– |
149.28 |
||
|
DQD |
303 |
0.0314 |
53.62 |
9.33 |
|
|
313 |
0.0613 |
52.66 |
18.22 |
||
|
323 |
0.1287 |
49.05 |
38.26 |
||
|
333 |
0.3148 |
37.30 |
93.59 |
||
|
HDQD |
303 |
0.0196 |
71.05 |
5.83 |
|
|
313 |
0.0504 |
61.08 |
14.98 |
||
|
323 |
0.1241 |
50.87 |
36.89 |
||
|
333 |
0.2972 |
40.81 |
88.36 |
||
|
ODQDU |
303 |
0.0319 |
52.88 |
9.48 |
|
|
313 |
0.0842 |
34.98 |
25.03 |
||
|
323 |
0.1858 |
26.44 |
55.24 |
||
|
333 |
0.3996 |
20.41 |
118.81 |
||
|
ODQDTU |
303 |
0.0214 |
68.39 |
6.36 |
|
|
313 |
0.0585 |
54.83 |
17.39 |
||
|
323 |
0.1398 |
44.66 |
41.56 |
||
|
333 |
0.3412 |
32.05 |
101.44 |
Temperature increases the rate of all electrochemical processes and influences adsorption equilibrium and kinetics as well. Adsorption and desorption of inhibitor molecules continuously occur at the metal surface and an equilibrium exists between two processes at a particular temperature. With increase in temperature the equilibrium between adsorption and desorption processes is shifted to a higher desorption rate than adsorption until equilibrium is again established at a different value of equilibrium constant. This explains the lower inhibition efficiency at higher value (4).
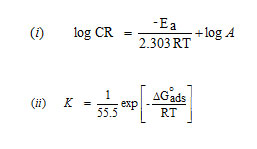
In acidic solution the corrosion rate is related to temperature by the Arrhenius equation
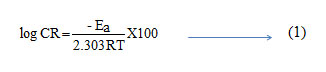
where Ea is the apparent activation energy and A – frequency factor, R – Gas constant, T – Temperature. Fig 2 shows the plot of log CR Vs 1000/T. Linear plots were obtained for all the inhibitors. The values of Ea were computed from the slope of the straight lines and are listed in Table 3. It is clear from the data that Ea values in the presence of inhibitors are higher than that in the absence. The higher activation energies imply a slow reaction and that the reaction is sensitive to temperature. Similar results have been reported by Ebenso etal., in the corrosion inhibition of steel by Alizarin (5). The increase in Ea in the presence of inhibitors signifies physisorption (6).
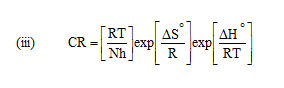
Enthalpy and entropy of activation ΔH0 and ΔS0 were obtained by applying transition state equation
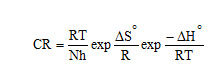
A transition state plot of log (CR/T) Vs 1/T gives straight line (Fig 3) with slope = – ΔH0 / R and intercept = ln (R/Nh) + ΔS0/ R from which the values of ΔH0 and ΔS0 were calculated and listed in Table 3. Analysis of the data in Table 3 clears that the negative sign of enthalpy reflects the exothermic nature of dissolution of steel. Absolute values of enthalpy of activation are lower than 41.86 KJ/mol indicates physical adsorption whereas values approaching 100 KJ/mol indicate chemical adsorption. In this study, the values of ΔH0 are less than 41.86 KJ/mol confirming physical adsorption. The ΔS0 values are negative which means that the process of adsorption is accompanied by a decrease in entropy. The negative value of ΔS0 decreases in the presence of inhibitor as compared to that of in their absence ie. There is an increase in entropy in the presence of inhibitor. This indicated that the adsorption process is spontaneous and there is an increase in randomness or disorder on the surface due to the adsorption process and also desorption at higher temperature (7).
Table 3: Kinetic/Thermodynamic Parameters for mild steel corrosion in 1M H2SO4
|
Name of the inhibitor |
Ea KJ |
ΔG (K) |
ΔHo KJ/ mole |
ΔSo KJ/ mole |
|||
|
303 |
313 |
323 |
333 |
||||
|
Blank |
56.86 |
– |
– |
– |
– |
23.16 |
-0.0993 |
|
DQD |
64.09 |
-29.63 |
-30.51 |
-30.10 |
-30.13 |
26.68 |
-0.0906 |
|
HDQD |
58.89 |
-23.22 |
-23.51 |
-24.13 |
-23.64 |
31.85 |
-0.0751 |
|
ODQDU |
59.75 |
-24.01 |
–23.39 |
-22.79 |
-24.37 |
29.39 |
-0.0812 |
|
ODQDTU |
60.21 |
-26.61 |
-27.42 |
-28.01 |
-28.35 |
32.30 |
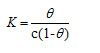
-0.0732 |
In the present study, the ΔG0 ads values (Table 4) obtained ranges from -22 to -30 KJ/mol, which are lower than -20 KJ/mol but higher than -21 KJ/mol. This indicates that the adsorption is neither typical physisorption nor typical chemisorption but it is a complex mixed type in which physisorption predominant (8). This assumption is supported by the data process reported in Table 3, which shows that inhibition efficiency decreases with increase in temperature (physisorption) (9).
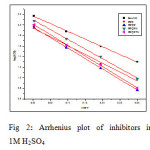 |
Fig2: Arrhenius plot of inhibitors in 1M H2SO4 Click here to View figure |
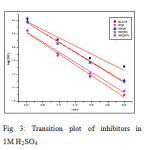 |
Fig3: Transition plot of inhibitors in 1M H2SO4Click here to View figure |
Adsorption Isotherm
The adsorption of an organic inhibitor on the surface of a corroding metal may be regarded as a substitution process between the organic compound in aqueous phase and water molecules on the metal surface. The adsorption of an organic adsorbate at metal-solution can occur as a result of substitutional adsorption process between organic molecules present in aqueous solution (org sol) and water molecules previously adsorbed on the metallic surface (H2Oads) (10).
Orgsol + nH2O → Orgads + nH2Osol
where Orgsol and Orgads are the organic species in the bulk solution and that adsorbed on the metallic surface respectively. nH2Oads is the H2O molecule adsorbed on the metallic surface and ‘n’ is the size ratio representing the number of H2O molecules replaced by one organic adsorbate.
The surface coverage (θ) was calculated as θ = (%) Inhibition efficiency/100
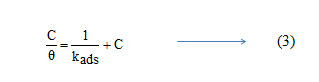
Basic information on the interaction between the inhibitor and the metal surface can be provided by the adsorption isotherm. In order to obtain the isotherm, linear relation between θ values and the inhibitor concentration ‘C’ was found. Attempts were made to fit the θ values to various isotherms including Langmuir, Temkin, Frumkin and Freundlich. The best fit was obtained with the Langmuir isotherm. Langmuir adsorption isotherm was found to be the best description of the adsorption behaviour of the studied inhibitors. This adsorption isotherm is described by the following equation
where kads is the equilibrium constant of the adsorption process and ‘C’ is the inhibitor concentration and Ө is the fraction of the surface covered. Fig 4 shows the dependence of C/ θ as a function of concentration C for the inhibitors.
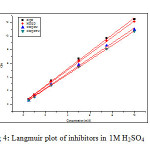 |
Fig4: Langmuir plot of inhibitors in 1M H2SO4 Click here to View figure |
Electrochemical Measurements
Electrochemical impedance spectroscopy
It is evident from Fig 7, that the Nyquist plots of mild steel show a depressed semi-circular shape. EIS measurements have been carried out at 303 K in acidic solution with and without inhibitors. The charge transfer resistance (Rt) values are calculated from the difference in impedance at lower and higher frequencies.
As it can be seen from the Table 4, Rt value increased with the increasing the concentrations of the inhibitors. On the other hand, the values of Cdl decreased with an increase in the inhibitors concentration thus with inhibition efficiencies (11). This situation was the result of an increase in the surface coverage by the inhibitor, which led to an increase in the inhibition efficiency. The decrease in the Cdl Value can result from a decrease in local dielectric constant and/or an increase in the thickness of the electrical double layer, signifying that quinoxaline molecule acts by adsorption at the solution / interface.
Table 4: AC-impedance parameters for corrosion of mild steel for selected Concentrations of the inhibitors in 1M H2SO4
|
Name of the Inhibitor |
Concentration (mM) |
Rt (ohm cm2) |
Cdl (μF/cm2) |
Inhibition Efficiency (%) |
|
BLANK |
– |
11.06 |
27.8 |
– |
|
DQD |
0.5 5.0 10.0 |
32.3 36.8 42.58 |
31.5 30.6 30.4 |
68.58 67.68 65.75 |
|
HDQD |
0.5 5.0 10.0 |
31.6 38.96 46.9 |
26 23 21.4 |
65.03 71.61 76.43 |
|
ODQDU |
0.5 5.0 10.0 |
44.6 47.5 49.7 |
21 20.4 20.2 |
75.22 76.70 77.72 |
|
ODQDTU |
0.5 5.0 10.0 |
38.7 40.8 43.4 |
21.1 20.4 19.1 |
71.40 72.89 74.50 |
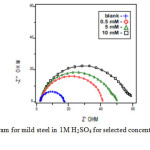 |
Fig5: Nyquist diagram for mild steel in 1M H2SO4 for selected concentrations of inhibitor (HDQD) Click here to View figure |
Potentiodynamic Polarization Studies
The potentiodynamic polarization curves for mild steel in 1M H2SO4 in the presence and absence of inhibitor (HDQD) are shown in Fig 6. Similar curves were obtained for other inhibitors (DQD, ODQDU and ODQDTU). The investigated inhibitors retard the anodic dissolution of mild steel and cathodic hydrogen discharge reactions. Electrochemical parameters such as current density (Icorr), corrosion potential (Ecorr), Tafel constants (ba & bc) and inhibiton efficiency were calculated from the Tafel plots and are given in Table 5. It is observed that presence of inhibitors lowers Icorr. Maximum decrease in Icorr values was observed for compound ODQDTU indicating that it is the most effective corrosion inhibitor. Ecorr values, Tafel slopes are significantly affected by the addition of inhibitors. Both anodic and cathodic Tafel lines are parallel and are shifted to more negative and positive direction respectively by the addition of inhibitors. This indicates that the mechanism of the corrosion reaction does not change and the corrosion reaction is inhibited by a simple adsorption mode (12).
Table 5: Corrosion parameters for corrosion of mild steel with selected concentrations of the inhibitors in 1M H2SO4 by Potentiodynamic polarization method
|
Name of the Inhibitor
|
Concentration (mM) |
Tafel slopes (mV/dec) |
Ecorr (mV) |
Icorr (μAmp/cm2) |
Inhibition Efficiency (%) |
|
|
ba |
bc |
|||||
|
Blank |
– |
68 |
133 |
-503.9 |
379 |
– |
|
DQD
|
0.5 5.0 10.0 |
68 59 54 |
146 144 136 |
-443.4 -484.6 -499.1 |
246.6 213.7 190.3 |
34.93 43.61 49.79 |
|
HDQD
|
0.5 5.0 10.0 |
66 55 52 |
160 156 154 |
-490.8 -481.2 -477.5 |
204.6 194.8 155.9 |
46.02 48.60 58.87 |
|
ODQDU
|
0.5 5.0 10.0 |
72 66 60 |
152 127 170 |
-479.4 -474.3 -487.4 |
184 176 154 |
51.45 53.56 59.37 |
|
ODQDTU
|
0.5 5.0 10.0 |
72 79 78 |
91 118 107 |
-536.6 -549.3 -534.8 |
156 135.4 119.6 |
58.84 64.27 68.44 |
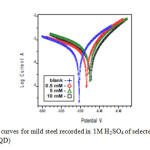 |
Fig6: Polarization curves for mild steel recorded in 1M H2SO4 of selected concentrations of the inhibitor (HDQD) Click here to View figure |
Synergism
Synergistic effect of halide ions
The synergistic effect provided by the addition of halide ions I–, Br–, Cl– to the solutions containing 1M H2SO4 and the quinoxaline derivative was studied by weight loss method and the data are presented in Table 7. Analysis of the data reveals that the synergistic influence of halide ions follows the order
I– > Br– > Cl–
It is well known that nitrogen based organic compounds are effective inhibitors for mild steel corrosion in aqueous medium. The presence of lone pair of electrons on the nitrogen atoms and π electron of aromatic ring facilitate their adsorption on the metal surface by interaction with the vacant d- orbital of iron. Heterocyclic compounds may also be adsorbed through electro static interaction between positively charged nitrogen atoms and negatively charged metal surface. It is also known that adsorption of the inhibitor can be influenced by the nature of the anions in acidic solutions. The presence of halide ions is found to enhance the inhibition efficiency. They are characterized by their strong adsorbability on the metal surface which brings about a negative charge favouring the adsorption of cation type inhibitors. The quinoxaline contain two nitrogen in the ring system, these compounds get transformed into cations in acid solution. Therefore the halide ions increase the efficiency of the quinoxalines. The study of influence of the addition of halide ions has been studied by weight loss method. It is clear from the table that the addition of KI exhibits high efficiency compared to KBr and KCl. The highest synergistic influence exhibited by iodide ion may be explained as follows.
The steel surface is originally positively charged in 1M H2SO4 when I– is added to the inhibiting solution they are strong chemisorbed by forming chemical bonds even leading to the formation of iron halide. This strong chemisorption of I– ions shift ɸn of the metal to more positive potential than Cl– and Br– and renders the surface highly negatively charged. On the highly negatively charged metal surface, the protonated cationic inhibitor molecules are physisorbed due to electrostatic interaction. This interaction is higher for I– than for Cl– or Br–due to higher magnitude of negative charge on the metal surface. Hence the observed order was I–> Br– > Cl–.
Table 6: Synergistic effect of 1mM KCl / KBr / KI on the inhibition efficiency of inhibitors by weight loss method at 30±1°C
|
Name of the inhibitor |
Concentration (mM) |
Inhibition efficiency (%) |
|||
|
Without KCl, KBr and KI |
With 1mM KCl |
With 1mM KBr |
With 1mM KI |
||
|
DQD |
0.1 0.2 0.3 0.4 0.5 |
56.47 58.64 59.71 62.41 64.19 |
67.27 70.34 71.42 72.68 74.62 |
71.68 72.63 74.35 75.19 78.96 |
75.36 78.20 81.25 83.47 86.88 |
|
HDQD |
0.1 0.2 0.3 0.4 0.5 |
69.94 74.98 77.65 73.02 82.59 |
73.71 77.07 81.59 85.63 86.62 |
84.23 85.41 86.55 87.59 90.48 |
94.6 95.2 95.95 96.76 97.17 |
|
ODQDU |
0.1 0.2 0.3 0.4 0.5 |
71.84 73.93 75.02 77.15 82.38 |
77.17 78.44 82.47 83.06 85.44 |
78.82 79.25 82.86 84.20 86.25 |
80.99 81.74 84.92 86.55 87.31 |
|
ODQDTU |
0.1 0.2 0.3 0.4 0.5 |
73.57 76.69 78.04 79.57 83.15 |
87.92 98.68 91.85 92.98 93.98 |
92.48 93.59 94.99 95.21 97.29 |
93.33 94.19 96.10 97.32 98.36 |
Synergistic effect of Surfactants
The synergistic effect of surfactants cationic (cetyl trimethylammonium bromide (CTAB)) and anionic (Sodium laurylsulphate (SLS)) on the inhibition efficiency of the quinoxaline derivatives was studied by weight loss method. Presence of surfactants along with the inhibitors enhanced the inhibiton efficiency by about 10%-20% [Table 8]. The inhibitive action of CTAB and SLS surfactants added to quinoxaline derivative towards the corrosion of mild steel in 1 M H2SO4 solution could be attributed to the adsorption of their compounds on the steel surface forming a barrier between the mild steel and the acid medium. The surfactants molecule consists of polar hydrophilic group and non-polar hydrophobic group. The polar end of the surfactant is oriented towards the metal surface, while the non-hydrocarbon tails forms a hydrophobic barrier to the aggressive ions in the acid medium. The addition of surfactants has led to lowering of the interfacial tension at the metal surface. This lowering in interfacial tension is thought to cause a decrease of the bulk concentration of the inhibitor and an increase in its concentration at the metal surface.
Table 7: Surfactant effect of 1mM CTAB/ 1mM SLS on the inhibition efficiency of inhibitors by weight loss method at 30±1°C
|
Name of the inhibitor |
Concentration (mM) |
Inhibition Efficiency (%) |
||
|
Without CTAB, SLS |
With 1mM CTAB |
With 1mM SLS |
||
|
DQD |
0.1 0.2 0.3 0.4 0.5 |
56.47 58.64 59.71 62.41 64.19 |
69.54 73.45 76.28 78.69 80.67 |
76.87 79.35 81.65 84.52 86.43 |
|
HDQD |
0.1 0.2 0.3 0.4 0.5 |
69.94 74.98 77.65 73.02 82.59 |
89.98 91.38 93.60 95.21 96.66 |
96.52 96.97 97.74 97.83 97.97 |
|
ODQDU |
0.1 0.2 0.3 0.4 0.5 |
71.84 73.93 75.02 77.15 82.38 |
76.58 85.90 89.87 92.36 93.17 |
96.56 97.47 97.78 99.46 99.73 |
|
ODQDTU |
0.1 0.2 0.3 0.4 0.5 |
73.57 76.69 78.04 79.57 83.15 |
91.41 93.54 95.16 95.89 97.11 |
98.82 98.87 99.00 99.10 99.19 |
The strength of adsorbed layer formed on the metal surface due to the electrostatic interaction occurs between the negative centers on the metal surface and the positively charged head groups of the cationic surfactants molecule (N+). The increase in the hydrophobic chain length increases the overlapping between the chains and increases the thickness of adsorbed protective layer formed on the mild steel surface (13).
Atomic Absorption Spectrophotometric Studies (AAS)
The inhibitor efficiency (%) of the inhibitors DQD and HDQD was calculated from the percentage of Fe dissolved obtained from AAS and the data are presented in Table 8. The inhibition efficiency obtained by this technique was found to be in good agreement with that obtained from the conventional weight loss method.
Table 8: Amount of dissolved iron present in the corrosive solution with and without inhibitors in 1M H2SO4 measured using atomic absorption spectroscopy
| Name of the inhibitor |
Concentration (mM) |
Amount of iron content (mg/l) |
Inhibition Efficiency (%) |
|
BLANK |
– |
1104.96 |
– |
|
DQD |
0.5 10 |
746.42 159.98 |
32.45 85.52 |
|
HDQD |
0.5 10 |
146.82 39.63 |
86.71 96.41 |
Surface Morphology
Scanning electron microscopy (SEM) studies
The mild steel specimens immersed in the blank acid (1M H2SO4) and inhibited acid (1M H2SO4 + 10 mM of HDQD) were observed under a scanning electron microscope and the photographs are shown in Fig 8 & 9. The photographs show that the mild steel was heavily corroded in 1M H2SO4 (Fig.8) where as in the presence of inhibitor the surface condition was comparatively better (Fig.9). This suggests the presence of protective adsorbed layer of inhibitor molecules on the mild steel surface, which reduces the corrosion rate of the metal appreciably.
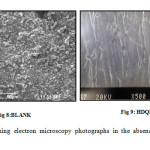 |
Fig7& 8: Scanning electron microscopy photographs in the absence and presence of inhibitors Click here to View figure |
Energy Dispersion Spectroscopy (EDS) studies
The EDS spectra were used to determine the elements present on the surface of mild steel after 8 hour of exposure in the uninhibited and inhibited 1M H2SO4. Table 10 portrays the EDS analysis of mild steel in 1M H2SO4 which indicates only the presence of Fe and O. This confirms that the passive film contained only Fe2O3. The EDS of HDQD in 1M H2SO4 shows the presence of additional lines due to ‘C’ and ‘N’ (14). This may be attributed to the presence of HDQD on mild steel that protects the steel surface from corrosion. A comparable elemental distribution is shown in Table 9.
Table 9: Surface composition of mild steel after 3h of immersion in 1M H2SO4 without and with the optimum concentrations of the studied inhibitors
|
BLANK |
HDQD |
||||
|
Element |
Wt (%) |
Atomic Wt (%) |
Element |
Wt (%) |
Atomic Wt (%) |
|
O Fe |
33.80 66.20 |
64.05 35.95 |
C N O Fe |
7.07 15.22 6.02 71.69 |
2.59 1.44 3.37 3.42 |
FT-IR studies
In this paper, FT-IR studies was used to evaluate the protective layer formed on the mild steel surface of inhibitors and to provide the possible interactions between the organic molecules and the mild steel surface. The FT-IR spectrum of pure compound DQD shows broadband in the region 3400-3300 cm-1 attributed to –NH stretching vibration. The absorption band at 1669.46 cm-1 is characteristic of >C=O stretching vibration (Fig 1). In the IR spectrum of the plate immersed in 1M H2SO4 and 10mM DQD, appearance of a weak band around 3400 – 3300 cm-1 and shift of >C=O band from 1669 cm-1 to higher wave numbers 1678 cm-1
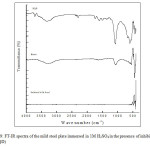 |
Fig9: FT-IR spectra of the mild steel plate immersed in 1M H2SO4 in the presence of inhibitor (DQD) Click here to View figure |
Fig 12 clearly proved that the electron centres –NH and >C=O are involved in the sharing of electrons with metal. These changes support the argument that the imine nitrogen and carbonyl oxygen atoms are coordinated with Fe2+. Furthermore the ntensities of these stretching frequencies are decreased confirming the absorption of DQD on the metal surface.
Computational approach
Calculations were done by using the Density functional theory (DFT) method in combination with the B3LYP functional. The DFT/B3LYP combination is known to produce good estimate of molecular properties that are related to molecular reactivity. The basis set used for calculations is 6-311G(d,p). The molecular properties that were evaluated for two selected quinoxalines (DQD and HDQD) are highest occupied molecular orbital energy (EHOMO), lowest unoccupied molecular orbital energy (ELUMO), energy gap (∆E), dipole moment (µ), softness (σ), hardness (η), electronegativity (χ), the fraction of electrons transferred from the inhibitor to the metal surface (∆N) and total energy (TE) (15). The optimized geometries, HOMO and LUMO of the two compounds are shown in Table 12.
Molecular properties of the studied compounds provide information on the reactivity and selectivity of the compounds. Such information is useful in the comparison of trends in reactivity among different compounds and helps to understand the interaction of the inhibitor with the metal surface. The energy of HOMO provides information about the tendency of a molecule to donate electrons to an appropriate acceptor with empty molecular orbitals and ELUMO indicates its ability to accept electrons. The high value of EHOMO of HDQD compared to DQD,ODQDU and ODQDTU indicate the greater tendency of HDQD to donate electrons to the unoccupied ‘d’ orbitals of the metal. The electronic configuration of Fe atom is [Ar] 4s2 3d6 , 3d is not fully filled with electrons. The unfilled orbital bind the HOMO of the inhibitors whereas the filled 4s orbital donate the electrons to LUMO of the inhibitors (16). The higher inhibition efficiency of HDQD is due to the greater interaction between 3d, 4s orbitals of Fe atom and the Frontier molecular orbital of the inhibitor.
Table 10: The calculated quantum chemical parameters for the selected inhibitors obtained using DFT at the B3LYP/6-311G (d,p) basis set.
|
Quantum chemical parameters |
DQD |
HDQD |
DQD |
HDQD |
| Total energy (au) |
-562.6 |
-604.05 |
-717.46 |
-104.41 |
| Dipole moment (μ) |
6.21 |
2.05 |
6.42 |
7.6 |
| EHOMO (eV) |
-6.37 |
-5.03 |
-6.1 |
-5.36 |
| ELUMO (eV) |
-1.61 |
-1.23 |
-1.71 |
-1.88 |
| Energy gap, ΔE (eV) |
4.76 |
3.8 |
4.4 |
3.48 |
| Ionization potential (I) (eV) |
6.37 |
5.03 |
6.1 |
5.36 |
| Electron affinity(A) (eV) |
1.61 |
1.23 |
1.71 |
1.88 |
| Hardness (η) |
2.38 |
1.9 |
2.195 |
1.74 |
| Softness (σ) |
0.42 |
0.53 |
0.46 |
0.57 |
| Electronegativity (χ) |
3.99 |
3.13 |
3.905 |
3.62 |
| Number of electrons transferred (ΔN) |
0.6324 |
1.0184 |
0.7050 |
0.9713 |
The energy difference between the HOMO and LUMO (∆E) provides information about the overall reactivity of the molecule, the smaller the ∆E value is, the greater is the reactivity of the molecule (17). The ∆E values of the studied compounds show that ODQDTU (∆E = 3.48 eV) is more reactive than DQD (∆E = 4.76 eV), HDQD (∆E = 3.8 eV), ODQDU (∆E = 4.76 eV). Therefore, on interaction with the metal surface, ODQTU would have the highest tendency to interact with the metal surface. ODQTU has highest electron density centres due to the presence of extra –C=S- NH2 group in comparison to other derivatives.
The dipole moment (μ) is the first derivative of the energy with respect to an applied electric field and is a measure of the asymmetry in the molecular charge distribution. A low value of μ favours accumulation of the inhibitor molecules on the metal surface and is also an indication of the hydrophobic character of the molecule (18). The μ value of HDQD (2.05 debye) was high when compared to other inhibitors while that confirming the greater accumulation of HDQD on the metal surface resulting in higher inhibition efficiency.
Absolute hardness and softness are important properties to measure the molecular stability and reactivity. A hard molecule has a large energy gap and a soft molecule has a small energy gap. Soft molecules are more reactive than hard ones because they can easily offer electrons to an acceptor. For the simplest transfer of electrons adsorption could occur at the part of the molecule, where the softness value is high (19). In corrosion process the inhibitor acts as a lewis base and the metal acts as a lewis acid. Bulk metals are soft acids and thus soft base inhibitors are most effective for anodic corrosion of these metals (20). In the present study HDQD has higher σ value (0.53) and lower η value (1.9). Normally, the inhibitor with the least value of global hardness η and highest value of global softness σ is expected to have the highest inhibition efficiency (21).
The number of electrons transferred ΔN indicates the tendency of a molecule to donate electrons. The higher the value of ΔN, the greater is the tendency of a molecule to donate electrons to the electron poor species. In the case of corrosion inhibitors, the higher value of ΔN implies a greater tendency to interact with the metal surface. The inhibitor HDQD has a higher ΔN value of 1.0184 in comparison to DQD, ODQDU and ODQDTU. The higher ΔN value also justifies the higher inhibition efficiency obtained for HDQD.
Mulliken atomic charges
The use of Mulliken population analysis to estimate the adsorption centres of inhibitors has been widely reported and it is mostly used for the calculation of charge distribution over the whole skeleton of the molecule (22).
Table 11: Calculated Mulliken atomic charges for the inhibitors using DFT at the B3LYP/6-311G(d,p) basis set.
|
Atoms |
DQD |
HDQD |
ODQDU |
ODQDTU |
|
C2 |
-0.072 |
-0.057 |
0.022157 |
0.02486 |
|
C3 |
-0.095 |
-0.135 |
0.007821 |
0.009263 |
|
C4 |
-0.095 |
-0.151 |
0.002425 |
0.005129 |
|
C5 |
-0.072 |
-0.037 |
0.030495 |
0.032553 |
|
C6 |
0.192 |
0.072 |
0.188941 |
0.19244 |
|
C7 |
0.192 |
0.105 |
0.193018 |
0.190996 |
|
C8 |
0.306 |
0.212 |
0.281141 |
0.307289 |
|
C9 |
0.306 |
0.273 |
0.362909 |
0.369454 |
|
N15 |
-0.463 |
-0.326 |
-0.22432 |
-0.22215 |
|
N16 |
-0.463 |
-0.361 |
-0.22766 |
-0.22714 |
|
O17 |
-0.307 |
-0.343 |
-0.32401 |
-0.31591 |
|
O18 |
-0.307 |
– |
– |
– |
|
N18 |
– |
-0.279 |
-0.36626 |
-0.33725 |
|
N19 |
– |
-0.311 |
– |
– |
|
C19 |
– |
– |
0.388328 |
0.086632 |
|
O20 |
– |
– |
-0.35217 |
– |
|
N21 |
– |
– |
0.017183 |
0.113063 |
|
S20 |
– |
– |
– |
-0.22924 |
The Mulliken charge distribution of DQD, HDQD, ODQDU and ODQDTU are presented in Table 11, it has been reported that as the Mulliken charges of the adsorbed centre become more negative, more easily the atom donate its electrons to the unoccupied orbital of the metal (23). From the Table 11, it is clear that some carbon atoms, nitrogen and oxygen atoms have high charge densities. The regions of high charge densities are generally the sites to which electrophiles can attach (24). Therefore, N, O and some Carbon atoms are the active centres, which have the strongest ability to bond the metal surface. From the above facts, it can be concluded that the active sites of adsorption are the hetero atoms- oxygen, ring nitrogen atoms, outside the ring nitrogen atoms and the carbon atoms of the benzene ring of the quinoxaline derivatives.
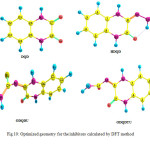 |
Fig10: Optimized geometry for the inhibitors calculated by DFT method Click here to View figure |
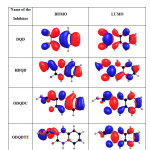 |
Table12: HOMO and LUMO for the inhibitors calculated by DFT method Click here to View table |
Mechanism of inhibition
1,4-dihydrquinoxaline-2,3-dione and its derivatives show good inhibition efficiencies towards corrosion of mild steel in 1M H2SO4. It is generally assumed that adsorption of the inhibitor at the metal/solution interface is the first step in the action of the inhibitors in aggressive acid media. Four types of adsorption may take place during inhibition at the metal/solution interface:
- Electrostatic attraction between charged molecules and the charged metal,
- Interaction of unshared electron pairs in the molecule with the metal,
- Interaction of π electrons with the metal and
- Combination of the above
Concerning inhibitors, the inhibition efficiency depends on several factors, such as the number of adsorption sites and their density, molecular size, heat of hydrogenation mode of interaction with metal surface and formation of metal complexes (25). The inhibitive property depends on the electron density surrounding the adsorption centre, the higher the electron density at the centre, the more effective the inhibitor.
In general, two modes of adsorption are considered on the metal surface in acid media: physisorption and chemisorption. Physisorption requires the presence of both the electrically charged surface of the metal and charged species in solution. A chemisorption process involves charge sharing or charge-transfer from the inhibitor molecules to the metal surface to form a coordinate type of bond. This is possible in the case of a positive as well as a negative charge of the surface. The adsorption of 1, 4-dihydrquinoxaline-2, 3-dione derivatives can be attributed to the presence of atoms of sulphur, nitrogen and oxygen and aromatic/heterocyclic rings. Therefore, the possible centres are unshared electron pair of heteroatoms and π electrons of aromatic ring. ODQDTU shows the best inhibition efficiency among other inhibitors. The high efficiency of ODQDTU is due to the presence of –CS-NH2 group that increase the electron density on the quinoxaline molecule.
Evaluation of inhibitors
Inhibition efficiency values obtained for the inhibitors are shown in the following sequence
ODQDTU > HDQD > ODQDU > DQD
All the four inhibitors have the same molecular structure except for the substituents at third position in the quinoxaline ring. Among the four inhibitors ODQDTU exhibit high inhibition efficiency. The best performance of ODQDTU may be due to the presence of >C=S group which increase further its electron densities for their adsorption on the metal surface. The inhibition efficiencies of organic compounds containing different donor atoms is in the sequence S > N > O (26-28). The lower inhibition efficiency of DQD may be due to the greater solubility of >C=O in aqueous acid medium leading to the dissolution of the inhibitor film from the metal solution and due to the presence of high electronegative oxygen. ODQDU is also expected to exhibit high inhibition efficiency due to the presence of amide group but it is slightly lower when compared to ODQDTU, which is due to the absence of more electronegative S atom. The same reason holds good for the lower inhibition efficiency of HDQD compared to ODQDTU.
Conclusion
- The investigated 1,4-dihydroquinoxalin-2,3-dione derivatives are fond to perform well as corrosion inhibitors in 1M H2SO4 solution. The order of inhibition as follows ODQDTU > ODQDU > HDQD > DQD
- The inhibition efficiency increases with increase in the concentratoin but decreases with rise in temperature.
- The adsorption of quinoxalines on mild steel from 1M H2SO4 obeys Langmuir adsorption isotherm.
- Phenomenon of physical adsorption is proposed from the value of kinetic / thermodynamics parameters (Ea, ΔGads) obtained.
- The polarization data indicates that the inhibitors behave as mixed –type.
- The addition of KCl, KBr & KI and surfactants CTAB and SLS was found to increase the percentage inhibition efficiency due to synergistic effect.
- Quantum mechanical studies of Quinoxaline derivatives were found to be in good agreement with experimental results.
References
- Adardour,K.; Kassou,O.; Touir, R.; Ebn Touhami,M.; ElKafsaoui,H.; Benzeid,H. J. Mater. Environ. Sci. 2010, 1, 129-138.
- Obot,I.B.; Obi-Egbedi, N.O. Mater. Chem. Phys, 2010, 122, 325– 328.
- Obot, I.B.; Obi-Egbedi, N.O.; Odozi,N.W, Corros. Sci. 2010, 52 923-926.
- Jamal Abdul Nasser, A.; Anwar Sathiq, M, Int.l J. Eng. Sci. Tech. 2010, 21,6417-6426.
- Tebhji, K.; Hammouti, B.; Oudda,H.; Ramdani, A.; Benkadour, A, Appl. Surf. Sci. 2005, 252, 1378-1385.
- Bentiss, F.; Lebrini, M.; Lagrenee, M. Corros. Sci. 2005, 47, 2915-2931.
- Shivakumar, S.S.; Mohana, K.N. Ad. Appl. Sci. Res. 2012, 3, 3097-3106.
- Mohammed, K.Z.; Hamdy, A.; Abdel-Wahab, A.; Farid, N.A. Life Sci J. 2012, 9, 424-434.
- Solomon M.M.; Umoren S.A.; Udosoro, I.I.; Udoh A.P. Corros. Sci. 2010, 52, 1317 – 1325 .
- Naderi. E.; Jafari A.H.; Ehteshamzadeh, M.; Hosseini, M.G. Mater. Chem. Phys, 2009, 115, 852-858.
- Fenging Xu.; Baorong Hou. Acta Metallugica Sinic. 2009, 22, 247-254.
- Khaled, K.F.; Saedah R Al-Mhyawi. Inter. J. Electrochem.Sci. 2013, 8, 4055-4072.
- Maqsood Ahmad Malik, Mohd Ali Hashim, Firdosa Nabi, Shaeel Ahmed Al-Thabaiti, Zaheer Khan. J. Electrochem.Sci. 2011, 6, 1927-1948.
- Fouda, A.S.; Eldesoky, A.M.;. Elmorsi, M.A.; Faye, T.A.; Atia, M.F. J. Electrochem.Sci. 2013, 8, 10219-10238.
- Mistry, B.M.; Patel, N.S.; Sahoo, S.; Jauhari, S. Bull. Mater. Sci. 2012, 35, 459-469.
- Bentiss, F.; Traisnel, M.; Vezin, H.; Hildebran, H.F.; Lagrenee, M. Corros. Sci, 2004, 46, 2781-2792.
- Eddy, N.O. Mol. Simul. 2010, 35, 354-363 .
- Mwadham M Kabanda, Lutendo C Murulana, Muzaffer Ozcan, Faruk Karadag, Ilyas Dehri, Obot, I.B.; Ebenso, E.E. J. Electrochem.Sci. 2012, 7, 5035 – 5056.
- Hasanov, R.; Sadiklgu, M.; Bilgic, S. Appl. Surf. Sci. 2007, 253, 3913-3921.
- Obi-Egbedi, N.O.; Obot, I.B.; El-Khatary, M.I.; Umoren, S.A.; Ebenso, E.E. J. Electrochem.Sci. 2011, 6,.5649-5675.
- Ebenso, E.E.; Isabirye, D.A.; Eddy, N.O. Inter. J. Mol. Sci. 2010, 11, 2473 -2498.
- Bentiss, F.; Lebrini, M.; Lagrenee, M.; Traisnel, M.; Elfarouk, A.; Vezin, H. Electrochim. Acta, 2007, 52,.6865-6872.
- Xia S.; Qiu M.; Yu L.; Liu F.; Zhao H. Corros. Sci. 2008, 50, 2021-2029.
- Musa, A.Y.; Kadhum, A.H.; Mohamad, A.B.; Rahoma, A.B.; Mesmari, H. J. Mol. Struct, 2010, 969, 233-327.
- Safaa El-din H Etaiw.; Abd El-Aziz S Fouda.; Mohamed M.El-bendary. Prot. Met. Phys. Chem. Surf, 2013, 49, 113-123.
- Derya Lece, H.; Kaan.; Emregtil, C.; Orhan Atakol. Corros. Sci, 2008, 50, 1460 – 1468.
- Behpour, M.; Ghoreishi, S.M.; Soltani, N.; Salavati-Nisari, Hamadanian, M.; Gandomi. A.Corros. Sci. 2008, 50, 2172-2181.
- Hamdy H Hassan.; Essam Abdelghani.; Mohammed A Amin.; Electrochimica Acta, 2007, 52, 6359-6366.


ISSN Online: 2231-5039

![]()


