Electrophoretic Studies of Binary and Ternary Complexes of Some Metal Ions with Alizarin
Shikha Sharma, Pradeep Mishra and O. P. Rai*
Department of Chemistry Govt. P . G. College, Satna-485001, India
DOI : http://dx.doi.org/10.13005/ojc/300465
Article Received on :
Article Accepted on :
Article Published : 17 Dec 2014
Quantitative studies of complex formation from the determination of stability constants of the binary complexes of metal (II)/(III)- alizarin and also the mixed complexes of metal (II)/(III)- alizarin-NTA have been described using paper electrophoretic technique. The stability constant of metal-(II)/(III)-alizarin are found to be 105.14, 104.84, 104.44 and 104.14 and mixed complexes of metal (II)/(III) have been found 105.40,105.10,105.00 and 104.70 for Cr(III), Cu(II),Ni(II) and Zn(II) respectively at 350C and ionic strength I=0.1 mol dm-3 (HClO4).
KEYWORDS:Binary complexes; ternary complexes; overall mobility; stability constants; paper electrophoretic technique
Download this article as:| Copy the following to cite this article: Sharma S, Mishra P, Rai O. P. Electrophoretic Studies of Binary and Ternary Complexes of Some Metal Ions With Alizarin. Orient J Chem 2014;30(4). |
| Copy the following to cite this URL: Sharma S, Mishra P, Rai O. P. Electrophoretic Studies of Binary and Ternary Complexes of Some Metal Ions With Alizarin. Available from: http://www.orientjchem.org/?p=5943 |
Introduction
Alizarin and its derivatives are well known colorimetric reagents for cations. The presence of two hydroxyl groups in positions 1 and 2 with respect to the quinoid oxygen makes it very suitable for the formation of chelates with metal ion. A number of studies have been carried out on the detection and determination of a number of transition metal 1,2,3. The complexation of legand and determination of stability constant has been studied by several workers. Dey et.al. studied the composition and stability of the 4-7 complexes with copper, lead, chromium and hafnium. Later Varadarajulu et.al studied the stoichometric and stability constants of chelates with certain metal ions 8-12. Hu et.al. 13 used anthraquinone derivative for capturing chemiluminescence emission for binding proteins and metal ion under appropriate conditions. It is well known that the ease of formation of a complex with dye, thus stability of the complex decides its applicatory importance. Zn(II),Cu(II),Ni(II) and Cr(III) are well known for their biomedical applications and play essential role in different physiological processes of the body 14-29 In recent years a number of papers have described paper electrophoresis for the study of complexation reactions in solution 30-36.
The present paper describes the study of complex formation of Zn, Cu, Ni and Cr with alizarin and mixed complexes of these metal ions with alizarin as primary ligand and NTA as secondary ligand.
Experimental
Instruments
An electrophoretic apparatus (systronics type 604, India) was used together with the various accessories supplied with the instrument. The apparatus consisted of polyvinyl chloride of the cassette type and chromatogram could be run simultaneously on eight paper strips. The power unit capable of yielding a maximum of 300V. In each case electrophoresis was carried out for 1 hr at 240V and at 300C. What man no.1 paper strips were used with an applied voltage gradient of 9V Cm-1. pH measurements were made with Elico digital pH meter having glass electrode assembly working on 220 volts/ 50 cycles stabilized AC main was used.
Chemicals
Zn(II),Cu(II),Ni(II) and Cr(III) perchlorates were prepared by precipitating the corresponding carbonates from solutions of nitrate (Anala R grade) with the solution of sodium carbonate, washing the precipitates thoroughly with boiling water and dissolving in a suitable amount of perchloric acid. The resulting solutions were heated to boiling on a water bath and then filtered. The solutions were standardized and diluted with distilled water. As required Anala R/ BDH grade alizarin, NaOH, HClO4, NTA and specific colour developing reagents were used for different metal ions of binary and ternary system sets for specific colour development.
1-(2- pyridylazo)-2 naphthol(PAN), 0.1% (w/v) in ethanol was used for detecting all the metal ions. A saturated aqueous solution (0.9 ml) of silver nitrate was diluted with acetone to 20 ml. Glucose was detected by spraying with this solution and then with 2% ethanolic sodium hydroxide, forming a black spot.
Background Electrolyte
Stock solution of 5.0 M perchloric acid was prepared by its 70% solution (Anala R grade) 2.0m sodium hydroxide (Anala R grade), 0.5M alizarin and 0.5M NTA (AnalaR grade) were prepared. Each solution was standardized as usual.
The background electrolytes used in the study of binary complexes were 0.1M perchloric acid and 0.01M alizarin. For the study of mixed systems the background electrolyte used consisted of 0.1 M perchloric acid, 0.01 M alizarin and varying amounts of 0.01M NTA. The mixed system was maintained at pH 8.5 by the addition of sodium hydroxide.
Procedure
The midpoint of each paper was marked and moistened with the background electrolyte. Excess electrolyte was allowed to drain off and papers were mounted on the plate of electrophoretic chamber. A spot of the metal solution was then applied at the marked point with the help of a fine glass capillary. For recording observations of particular metal ion two strips were spotted with the metal ion solution along with additional two spotted with glucose. The electrode compartment was filled with the equal volumes of the desired background electrolyte solutions. The lid of the chamber was then placed, it was left for 10 minutes to ensure wetting of strips. Subsequently a direct 220 volts potential was applied between the electrodes. Electrophoresis was carried out for 60 minutes after which these strips were removed from the tanks with a glass rod and dried. The metal ion and glucose spots were detected by specific reagents. The leading and tailing edge were measured from the marked centre point and the mean were taken. The distance moved by glucose was subtracted (in case the migration towards anode) to obtain correct path length. Migration towards anode and cathode were designated by negative and positive signs respectively. The actual distance of the sample spot was measured after taking into account the distance travelled by the reference glucose spot. The distance recorded in the duplicated differed within ±5% and the average of two distances was noted. The mobilities were then calculated and expressed in 103cm2v-1min-1 .
Results and Discussion
Several workers 37-39 have been employed graphical methods for determination of stability constants of metal complexes using ionic mobilities data. A plot of electrophoretic mobility against pH gives a curve with a number of plateaus (Fig1). Two plateaus with all the four metal ions are observed. The first plateau in each case corresponds to a region of pH where metal ion are uncomplexed. In this low pH protonated form of alizarin is maximum. Further increase in pH from this region on wards which naturally leads to increase in ligating alizarin anion concentration and brings about a progressive decrease in overall ionic mobility of the metal ion species. This decrease indicates formation of complex of the metal ion with the ligand. A point is reached beyond which mobility of the metal ion species remain constant regardless of the increase of pH of reaction mixture. This is the second plateau which corresponds to a pH region in which 1:1 binary complex of cationic nature is formed.
In view of the above observation the complexation of metal ions with these ligands may be represented as
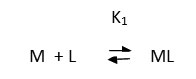
The metal ion moving under the influence of electrical field, the overall mobility is given by the equation.
u= ∑un fn
Where, un and fn are mobility and mole fraction of a particular complex species. This equation is transformed into the following form. On taking into consideration of different equilibria.
u = u0+u1K1[L]+u2K1K2[L]2+…….. / 1+K1[L]+K1K2[L]2+…………
Where K’s(K1K2) are the stability constants of complexes and [L] is concentration of alizarin. U’s (U0,U1, U2) are the ionic mobilities of different species of the metal ions, which can be accessed from the plateaus of the Fig1. In the region between first and second plateau, the system contains, mixture of free metal ion and 1:1 complex. The existence of 1:2 complex can be excluded and hence the third term in the numerator and the denominator of the above equation can be neglected. U would be equal to (u0+u1/2) provided K1[L]=1.
Accordingly the pH corresponding to the average value of U0 and U1 is found from the fig.1 and with the knowledge of the dissociation constant of alizarin (pKa 6.94), the concentration of alizarin ion at this pH is calculated. Its reciprocal gives the stability
constant K1 of the 1:1 complex
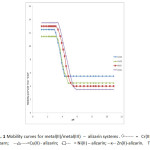 |
Fig1: Mobility curves for metal(II)/metal(III) – alizarin systems . ◊——- = Cr(III) -alizarn; —Δ——=Cu(II) – alizarin; —Δ—- = Ni(II) – alizarin; –x– Zn(II)-alizarin. The paper strips were spotted with 0.1 µl of sample solution and glucose (for making osmotic correction). The background electrolytes = 0.1M perchloric acid and 0.01M alizarin. Click here to View figure |
The concentration of chelating alizarin anion [L] is determined as
[L] = [L]tot / 1+[H]/K1+[H]2/K1K2
Where [L]tot is the total concentration of the ligand alizarin (0.01M) and K1 and K2 are first and second dissociation constants of the alizarin respectively.
Metal-alizarin-nitrilotriacetate mixed system.
Fig.2 illustrate the studies carried out in M-alizarin-NTA mixed complexes. The first plateau corresponds to binary M-alizarin complexes whereas the second plateau corresponds to the formation of new complex. The first plateau is in agreement with the mobility of the binary metal-alizarin complexes. And the mobility of last plateau is more negative than that of the first plateau.
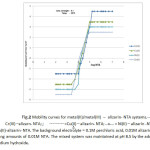 |
Fig2: Mobility curves for metal(II)/metal(III) – alizarin- NTA systems.– —– = Cr(III) –alizarn- NTA; ; ——— =Cu(II) – alizarin- NTA; –x— = Ni(II) – alizarin -NTA; –+–Zn(II)-alizarin- NTA. The background electrolyte = 0.1M perchloric acid, 0.01M alizarin and varying amounts of 0.01M NTA. The mixed system was maintained at pH 8.5 by the addition of sodium hydroxide. Click here to View figure |
Thus it is inferred that the coordination of NTA anion to 1:1 metal-alizarin complex resulting in the formation of 1:1:1 metal-alizain-NTA mixed complexes as
K’
M-L + NTA →M-L-NTA
For M-L-NTA complexes the stability constant K’ is calculated by using modified equation.
u = u0+u1 K’[NTA] / 1+K’[NTA]
Here u0 and u1 are the mobilities of M-L and M-L-NTA complexes. From the fig.2 concentration of NTA at which overall mobility as the mean of the mobilities of the two plateaus is determined by using the equation.
[L] = [L] tot / 1+[H]/K1
The concentration of NTA anion at pH 8.5 for this NTA concentration is calculated. K’ is obviously equal to 1/[NTA]. The stability constant values for binary (M-L) and mixed (M-L-NTA) complexes are Cr(III) (5.14,5.40) Cu(II)(4.84,5.00) Ni(II) (4.44,5.00) and Zn(II)(4.14,4.70) which follows the Irving William’s order for the stability constants of transition metals of the first transition series. In literature 40 log K for binary complex of Cu(II) with alizarin Red S at 0.1M and temp. 30 ±2.0 is 4.36; log K values of other binary and mixed complexes are not available in literature hence no comparison can be made.
Conclusion
Further complexes of metal alizarin and its derivatives find application in estimation of drugs in pharmaceutical formulation 10, labeling of protein 8 and selective staining 11. It can be concluded that the study of complexation of alizarin with Cr(III),Cu(II),Ni(II) and Zn(II) will be worthful for metal- dye complex studies.
References
- Dey A.K. Mikrochim Acta, 1964, 2-4, 414.
- Abbaspour A., Baramakesh L., Anal. Sci, 2002, 18,1127.
- Nejati- Yazadinejad M., Anal, Sci, 2006, 22, 617.
- Mukherji A.K. and Dey A.K, J Indian chem., soa 1957, 34, 641.
- Mukherji A.K. and Dey A.K., Proc. Natl. Acad. Sci. India 1957, 26A, 20.
- Banerji S.K. and Dey A. K., J. Indian Chem. Soc. 1961, 38, 121.
- Banerji S.K. and Dey A.K. Bull, Chem, Soc, Jpn. 1962, 35,209.
- Varadarajulu A and Seshaiah U.V.,J. Indian Chem. Soc. 1971, 48, 1065.
- M. Bartulek Colled, Czech Cham Commun 1967, 32.
- Sangal S.P., J.Prakt, Chem, 1967, 36,126.
- Biryuk E.A., Nazarenko V.A., Ravitskaya R.V., zh Anal Khim 1968, 21, 1658.
- Govil P.K., Banerji S.K., J. chem., India 1972, 10, 538.
- Hu G.L., Wan C.F., Li Q.M., Zhang Y.H., Cuo X.Y., Lin S.C., J. Instrum Anal. 2005, 24, 74.
- Dallinger R., Berger B., Hunjiker P and kagi, J H R. Nature. 1997, 388, 237.
- Shimon M B, Goldshleger R and Karlish S J D, J Biol Chem,., 1998, 273, 34190-34195.
- Battersby A R. Acc Chem Res., 1993, 26, 15-21.
- Thibaut D, Kiuchi F, Debussche L, Leeper F.J and Blanche F, Chem Commun., 1992, 2, 135.
- Hartman H.A. and Evenson M.A Med Hypothesis, 1992, 38(1), 75-85.
- Bush A.I., Moir R.D. Williamson T.G. Small D.H. Rumble B. Pollwein P. Beyreuther K and Masters C.L, J Biol Chem., 1993; 268, 16109-16112.
- Beckman J.S., Carson M. Smith C.D. and Koppenol W H., Nature. 1993, 364, 584.
- Fell G.S., Chemistry in Britain, , 1980, 16(6), 323.
- Nishino S, Kunita M. Kani Y. Ohba S. Matsushima H, Tokii T and Nishida Y, Inorg Chem Bommun., 2000, 3,145.
- Lu Y, Roe J A., Bender C J, Peisach J. Banci L, Bertini l. Gralla E B and Valentine J S, Inorg Chem., 1996, 35, 1692-1700.
- Pirot F., Millet J, Kalia Y.N and Humbert P. Skin Pharmacol., 1996, 9, 259-269 DOE:10.1159/000211423.
- Sidhu K S. Nash D.F. and McBride D.E., Regul Toxicol Pharmacol., 1996, 22(1), 95-100.
- Dourson M.L., Felter S.P. and Robinson D. Regul Toxicol Pharmacol., 1996, 24(2), 108-120.
- Gibson R.S., Am J Clin Nutr., 1994, 59(5), 1223S-1232S.
- Nakashima S, Kitagawa T and Olson J.S, Chem Phys., 1998, 228, 323-336(1994).
- Kushak Y. Kazuhiro S, Narufumi S and Yutaka H, J Occup Health. 2001, 43, 1.
- Singh S., Yadv K.L., Annli Di Chimica 1985, 75, 377.
- Tiwari B.B. and Yadav K.L, Trans Saest 1990, 25(4) 124.
- Tiwari B.B. and Yadav K.L., J Chromatogr 1991, 542-537.
- Tiwari B.B. and Yadav K.L., Biomed Chromatogr 1996; 10(5), 221.
- Tiwari B.B. , J chromatogr 2001, 910 (1) 181.
- Singh S., Bajpai A.K. and Yadav K.L. Electrophoresis 1986, 7, 187.
- Singh S., Gupta D. and Yadav K.L J. Eletrochem. Soa 1986, 35, 1.
- Tewari B.B. Journal of the chile chem.. Soc 2005, 50(2).
- Tewari B.B. Revista Boliviana De Quimica 2011, 28(1).
- Singh P Praveen and Kanaujia S, Chem Soci Trans 2013, 2(3), 1028-1034).
- Yadav Laljee, S. Sanjay Sharda, Preyas Ankit and Mukesh Chattopadhyaya G Der Pharma chemica 2010, 2(3), 114-121).

This work is licensed under a Creative Commons Attribution 4.0 International License.
![]()
A New Edition of Web of Science
Journal Impact Factor
2022: 0.5
Five Year: 0.8
Journal is Indexed in

Cabells Whitelist
![]()


