Effect of silver loading on optical and antibacterial behavior of Poly(methyl methacrylate)
Nayma Siddiqui1, Arpan Bhardwaj1, Anis Shaikh2, Anita Jain1 and Suresh Kumar Verma3
1Department of Chemistry, Govt. Madhav Science P.G. College, Vikram University, Ujjain, 456010, India 2Institute of Pharmacy, Vikram University, Ujjain, 456010, India 3Department of Chemistry, Shri Kalyan Govt. P.G. College, University of Rajasthan, Sikar-332001, India
DOI : http://dx.doi.org/10.13005/ojc/300437
Article Received on :
Article Accepted on :
Article Published : 30 Dec 2014
The main aim of this study is to investigate the optical behavior and antibacterial activity of Poly(methyl methacrylate)/silver nanocomposite. In this paper, thin films of PMMA/Ag nanocomposites were synthesized by reduction method using dimethyl formamide as a solvent as well as reducing agent and Triton X-100 as a stabilizer. The morphological study was carried out using FESEM and TEM. The presence of Ag nanoparticles confirmed through EDX spectroscopy. The study reveals that the particles are of spherical shape and are of nanometer size. The time dependant UV absorption spectra of silver nanocomposites were determined by UV absorption spectrophotometer and their surface plasmon resonance (SPR) behavior is studied. The antibacterial activity was investigated against Pseudomonas aeruginosa (Gram-negative) and Staphylococcus aureus (Gram-positive) bacteriae. Zone of inhibition was increased with increasing concentration of Ag nanoparticles.
KEYWORDS:nanocomposite; surface plasmon resonance; antibacterial
Download this article as:| Copy the following to cite this article: Siddiqui N, Bhardwaj A, Shaikh A, Jain A, Verma S. K. Effect of silver loading on optical and antibacterial behavior of Poly(methyl methacrylate). Orient J Chem 2014;30(4). |
| Copy the following to cite this URL: Siddiqui N, Bhardwaj A, Shaikh A, Jain A, Verma S. K. Effect of silver loading on optical and antibacterial behavior of Poly(methyl methacrylate). Available from: http://www.orientjchem.org/?p=6371 |
Introduction
Due to the unique physical, chemical, and biological properties of metallic nanoparticles, they are significantly used in wide range of applications. silver and gold nanoparticles has been known for its superior optical, electronic, mechanical and catalytic properties [1] as well as for biomedical applications[2,3]. Since last years there has been a strong emphasis on the synthesis of polymer nanocomposites, in which one of the components has one or more dimensions in the nanometer range. Polymer silver nanocomposites also exhibit application in optoelectronic devices [4]. Silver nanoparticles exhibit surface plasmon absorption bands appearing in the visible region is a characteristic band of noble nano particles. The wavelength of the plasmon resonance band depends on particle size, shape surface charge and environment [5,6]. The aqueous solutions of silver nanoparticles are not stable and rapidly undergo agglomeration due to the high reactivity of silver nanoparticles. Surface modification of nanoparticles is one of the mostly widely accepted methods to improve the dispersion stability of nanoparticles. To improve the dispersion stability and controlled growth of nanoparticles it is necessary to modify the particle surface by polymeric surfactants or other modifier. The most extensively used method for the synthesis of metal nanoparticles is chemical reduction method. Several reducing agents have been used in various studies such as sodium borohydride (NaBH4), ascorbates, citrates etc. These include strong reducing agent such as sodium borohydride (NaBH4), weak reducing agent such as ascorbates, citrates etc. Some solvents have been also used for the purpose of reduction. These include alcohol, ethylene glycol and DMF [7]. The use of silver nanoparticles as an antibacterial agent has drawn great attention for centuries [8]. Polymer silver nanocomposites can be used in a wide variety of biomedical product to reduce infections as well as to prevent bacterial colonization on plastic devices like prostheses, catheters, vascular grafts, dental materials, surgical gloves, antibacterial cloths and towels [9,10]. Plastic materials can be easily infected by the microorganism in moisture condition so it is necessary to protect them against microorganism. Polymer/ Ag nanocomposites have drawn great research interest for their antibacterial activity. In this Communication, we report the synthesis of poly(methyl methacrylate)/ Ag nanocomposite thin films by chemical reduction method using DMF as a solvent because of high solubility of PMMA as well as reducing agent and TX-100 as a modifier and investigated the effect of different concentration of Ag content on UV absorption properties and antimicrobial study.
Material and Method
Poly(methyl methacrylate) (PMMA, Commercial grade), Silver nitrate (AgNO3, Merck AR grade), Dimethyl formamide (DMF, Rankem, AR grade), TX-100 (Merck, AR grade), Agar (Himedia, AR grade).
Experimental Procedure
1 gm of PMMA was dissolved in 20 ml of DMF in a RB flask and stirred for 3 hours at room temperature. 0.01 molar AgNO3 was added in small amount of double distilled water and mixed with 1.5X10⁻² M TX-100 and mixed well to get sable silver colloid in DMF. This AgNO3 solution was added into the polymer solution in such a way so as to obtain 0.5, 0.75, 1.0 1.5 and 2.0 wt% nano-Ag in PMMA. The solution was stirred for 24 hours and color changed from colorless to light yellow and became darker as the time increased, which indicated the reduction of Ag+ ion into the Ag0 state. The solution was then poured in a petri dish and kept at 40oC until the film was completely dried. The film was removed from the petri dish and then analyzed. The films were prepared at different time intervals of 5 minute, 10 minute, 30 minute, 2 hours and 24 hours.
Results and Discussion
Characterization Techniques
UV-visible absorption measurements were carried out on Shimadzu 1800 spectrophotometer to study the optical behavior of nanocomposite films. The bonding between surfactant and Ag nanoparticles was confirmed by FTIR study using FTIR spectrometer BRUKER ALFA ECO-ATR in the range of 500-4000 cm-1 at resolution of 4 cm-1. For FTIR analysis the sample was prepared as follows: firstly 0.01 molar AgNO3 was dissolved with minimum quantity of double distilled water and mixed with 1.5X10⁻² molar TX-100. The solution thus prepared was mechanically stirred for 10 minutes. The spectrum was recorded by directly putting the sample on ATR ZnSe plate. The detailed imaging information about the morphology and elemental analysis of the samples were performed by field emission scanning electron microscope (FESEM) with energy-dispersive x-ray spectroscopy (EDX) (FEI- NOVA NANOSEM-430) with 15 kV acceleration voltage. The samples for FESEM were prepared by putting the nanocomposite films on a carbon supported grid using a conductive carbon tape. Thin gold layer was coated on the specimen by using sputter coating instrument (EMITACH). The morphology of the nano-size materials was studied using transmission electron microscope (TEM). TEM images were recorded using JEOL 3010 electron microscope.
Surface Morphology
Figure 1 shows FESEM image of PMMA/Ag nanocomposite thin film having 0.5 wt% Ag content. Few particles were found to be seen in the FESEM image. Ag nanoparticles have strong tendency to agglomerate. Due to which actual size of nanoparticles could not be precisely measured through FESEM. Presence of the Ag nanoparticles was confirmed through EDX spectroscopy. The EDX spectrum shows that the Ag nanoparticles were successfully prepared. The EDX spectrum represents the presence of elements in a particular area of FESEM image as shown in figure 1. The presence of Au is due to the gold plating on the specimen to prevent static discharging. Besides Ag, Au, and O element, it shows the presence of Cl also. This is observed most probably due to contamination on the copper grid. The table 1 shows the atomic and weight percentage of all the elements found in the EDX spectrum.
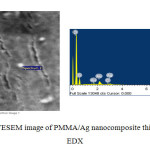 |
Figure1: FESEM image of PMMA/Ag nanocomposite thin film with EDX Click here to View figure |
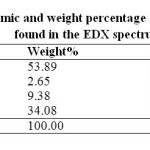 |
Table1: Atomic and weight percentage of all the elements found in the EDX spectrum. Click here to View table |
The samples were also characterized through TEM to know the exact particle size and distribution of Ag nanoparticles. The samples were prepared in a similar manner by putting the sample solution on carbon supported copper grid. TEM image for a solution containing 0.5 wt% Ag and 2 wt% Ag are shown in figure 2. TEM analysis shows that the particles are of spherical shape and are of nanometer size. The average particle size of 0.5 wt% Ag nanocomposite is found to be around 15 nm (Figure 2a). As the concentration increases the size of the particles is also increased, as shown in figure 2b.
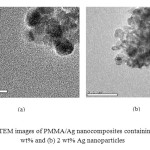 |
Figure2: TEM images of PMMA/Ag nanocomposites containing (a) 0.5 wt% and (b) 2 wt% Ag nanoparticles Click here to View figure |
Optical Study
Figure 3a shows the UV-visible absorption spectra of PMMA/Ag nanocomposites thin films for different weight percentage of Ag (0.5 wt%, 0.75 wt%, 1.0 wt%, 1.5 wt%, and 2.0 wt%) modified with 1.5X10⁻² M TX-100. As shown in figure 3, red shift in absorption maxima is observed. This red shift is observed due to large agglomeration and increase in particle size, this assumption is supported by TEM images in figure 2b. For PMMA/Ag nanocomposites having 0.5 wt% to 1.5 wt% Ag nanoparticles, the intensity of band is increased. For 2 wt% Ag embedded PMMA nanocomposite the intensity is decreased due to agglomeration of Ag nanoparticles. These nanocomposites thus prepared show absorption band at about 422 nm to 435 nm. For 1.5 wt% embedded Ag nanocomposite and 2 wt% Ag embedded nanocomposite, the width of surface plasmon resonance is found to be the same, which suggests that the size of the Ag nanoparticles are similar at both concentrations. Figure 3b shows the time dependent UV-visible absorption spectra of PMMA/Ag nanocomposite films having 0.5 wt% Ag nanoparticles. As the reaction time increases the wavelength of the absorption band increases from 422 nm to 430 nm and intensity of peak is also increased, indicating the continuous formation of silver nanoparticles and increase in particle size during the course of reaction. After 24 hours the absorption reached a maximum intensity, indicating no further formation of nanoparticles. It was also proved by change in color, when reaction time was increased. (Figure 4).
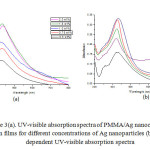 |
Figure3(a): UV-visible absorption spectra of PMMA/Ag nanocomposite thin films for different concentrations of Ag nanoparticles (b) Time dependent UV-visible absorption spectra Click here to View figure |
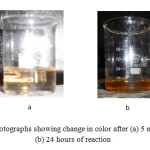 |
Figure4: Photographs showing change in color after (a) 5 minutes and (b) 24 hours of reaction Click here to View figure |
FTIR Study
Figure 5a and 5b shows the FTIR spectra of pure TX-100 and AgNO3/TX-100 composite respectively. As shown in the spectrum of the pure TX-100, the strong O–H and –CH2 stretching vibrations are appeared at 3480 cm-1, 2948 cm-1 (asymmetrical stretch), and 2869 cm-1 (symmetrical stretch), respectively. Four characteristic absorption bands of aromatic system are observed at 1642, 1610, 1581 and 1511 cm-1. Bands at 1456 cm-1 and 1364 cm-1 are attributed to the C-H bending vibrations. Bands between 1096 cm-1 and 1300 cm-1 are observed due to C-O stretching vibrations.
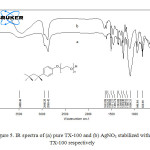 |
Figure5: IR spectra of (a) pure TX-100 and (b) AgNO3 stabilized with TX-100 respectively Click here to View figure |
It is observed from the FTIR spectrum of AgNO3/TX-100 that the intensity of peaks assigned to C-O bond of TX-100 is decreased on interaction with AgNO3. It suggests that the oxygen of C-O bond is interacting with Ag+ ions. These results indicate that the Ag+ ions are successfully capped by the hydrophilic polyoxyethylene group. In addition of this, the intensity of peak at 1642 cm-1 is also increased due to the addition of water.
Antibacterial Study
The PMMA/Ag nanocomposites were tested for antibacterial activity by cup method also known as well diffusion method, using Mueller Hinton agar plate against pathogenic bacteriae Pseudomonas aeruginosa and Staphylococcus aureus.
Zone of inhibition method was used to assess the antibacterial action of nanocomposites. The bacterial suspension was prepared by making a saline suspension of isolated colonies. The suspension was adjusted to match the tube of 0.5 McFarland turbid standard using spectrophotometry. The agar medium was seeded with the organisms by pour plate method. Wells of 6 mm diameter were created and filled with different concentrations of Ag nanoparticles embedded polymer nanocomposite solution. The plates were pre-incubated for 1 hour at room temperature to ensure adequate diffusion and finally incubated at 37°C for 24 h. After incubation the diameter of zone was measured. 1X10⁻² molar aqueous AgNO3 solution was used as standard in order to check the antibacterial action of PMMA/Ag nanocomposites.
Figure 6 illustrates the images of inhibition zones for the samples for antibacterial activity. The figure shows that all the samples having different concentrations of silver nanoparticles showing high antibacterial activity. It was most probably due to smaller size of Ag nanoparticles. Due to their small size, nanoparticles can easily penetrate the bacterial cell membrane, and reach to the nuclear content. The exact mechanism of antibacterial action of Ag nanoparticles is partially known. Probably when Ag nanoparticles come in contact with moist condition, they release Ag cations, which interact with the negatively charged species of bacterial cell membrane and bases of DNA, leading either to the inhibition of respiratory processes [26] or DNA unwinding [27] leading to bacterial cell death.
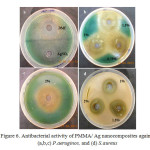 |
Figure6: Antibacterial activity of PMMA/ Ag nanocomposites against (a,b,c) P.aeruginos, and (d) S.aureus Click here to View figure |
When the study was carried out on P. aeruginosa with Ag nanocomposites modified with TX-100, showed strongest antibacterial effect. It may be due to smaller size and high surface area of Ag nanoparticles. Pure DMF is also found to show good antibacterial activity (figure 6a). As the concentration of Ag nanoparticles increased in PMMA, the zone of inhibition was also increased as shown in figure 6b and 6c. When the study was carried out on gram positive S. aureus, the zone of inhibition was increased with increasing concentration of Ag nanoparticles. At higher concentration (2 wt%) the zone of inhibition was slightly decreased as compared to 1.5 wt% Ag nanoparticles embedded PMMA, probably due to the agglomeration of nanoparticles as shown in figure 6d, because the antibacterial activity is also influenced by the surface area and size of the Ag nanoparticles. Results of inhibitory activity of nanocomposites are presented in table 2.
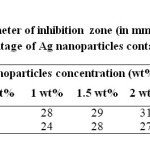 |
Table2: Diameter of inhibition zone (in mm) for different weight percentage of Ag nanoparticles containing PMMA Click here to View table |
References
- Nicolais, L. and Carotenuto, G., Metal-Polymer Nanocomposites, John Wiley & Sons, Hoboken, NJ, USA, (2005)
- Templeton, A.C.; Cliffel, D.E.; Murray, R.W. J. Am. Chem. Soc. 1999, 121, 7081-7089.
- Gehr, R.J.; Boyd, R.W. Chem. Mater. 1996, 8,1807-1819
- Mulvaney, P. Langmuir. 1996,12,788-800
- Liz-Marzan, L.M. Langmuir. 2006,22,32-41
- Pallavicini, P.; Taglietti, A.; Dacarro, G.; Diaz-Fernandez, Y.A.; Galli, M.; Grisoli, P.; Patrini, M.; Santucci, D.M.G.; Zanoni, R. J. Colloid Interface Sci. 2010, 350,110-116
- Dallas, P.; Sharma, V.K.; Zboril, R. Adv. Colloid Interface Sci. 2011,166,119-135
- Karchmer, T.B. Arch. Intern. Med. 2000,160, 3294-3298.
- Jafari, A.; Ghane, M.; Sarab, M.; Siyavoshifar, F., Orient J. Chem, 2011, 27(3), 811-822.
- Kreibig, U.; Gartz, M.; Hilger, A.; Neuendorf, R. Nanostruct. Mater. 1999, 11, 1335–1342
- Sarkar, A.; Kapoor, S.; Mukherjee, T. Res. Chem. Intermediat. 2010, 36,411-421

This work is licensed under a Creative Commons Attribution 4.0 International License.
![]()
A New Edition of Web of Science
Journal Impact Factor
2022: 0.5
Five Year: 0.8
Journal is Indexed in

Cabells Whitelist
![]()


