Effect of Mixing Temperature on the Synthesis of Hydroxy apatite by Sol-Gel Method
Tika Permata Sari, Novesar Jamarun*, Syukri, Zefri Azharman, Asregi Asril
Department of Chemistry, Andalas University, Padang, West Sumatera
DOI : http://dx.doi.org/10.13005/ojc/300440
Article Received on :
Article Accepted on :
Article Published : 30 Dec 2014
In this work, hydroxyapatite was synthesized from limestone using the sol-gel method. Calcium carbonate (CaCO3) and diammonium hydrogen phosphate ((NH4)2HPO4) were used as calcium and phosphate source. The hydroxyapatite was obtained by mixing the precursors at a variaty of temperature 50, 60, 70, 80 and 90°C. The resulting product were characterized by XRD and SEM-EDX. From the XRD data it can be seen that all of the product produced at different mixing temperature is a family hydroxyapatite. The compound prepared at 70°C showed smaller crystal size compared the one synthesized at 50 and 90°C. It also can be seen for SEM picture that the resulty material was agglomerated and spherical shape.
KEYWORDS:Hydroxyapatite; Temperature; Sol-Gel; Limestone
Download this article as:| Copy the following to cite this article: Sari T. P, Jamarun N, Syukri, Azharman Z, Asril A. Effect of Mixing Temperature on the Synthesis of Hydroxyapatite by Sol-Gel Method. Orient J Chem 2014;30(4). |
| Copy the following to cite this URL: Sari T. P, Jamarun N, Syukri, Azharman Z, Asril A. Effect of Mixing Temperature on the Synthesis of Hydroxyapatite by Sol-Gel Method. Available from: http://www.orientjchem.org/?p=6362 |
Introduction
Currently, materials technology have been steadily growing, particularly in biomaterial. Biomaterials is compounds with bioinnert, bioresorbable and bioactive properties and can be implanted into living tissue system or as a substitute for the damaged tissue. 1There materials are biocampatible in human body and do not have any side effect on human body .
Hydroxyapatite (Ca10(PO4)6(OH)2 has widely been used ini biomedical and dental applications due to its similarity to main mineral component of hard tissue of human body such as bone and dental.2In addition, hydroxyapatite can replace toxic ion in human body by its own. Due to its similarity to the mineralized matrix of natural bone (human skeletal system), this inorganic phosphate has been studied extensively for medical application (orthopedics and dentistry) in the form of powders, composites, or prosthetic coatings.3
In this research, starting material used to form hydroxyapatite is limestone because its naturally abundant on earth crust. Synthesis of hydroxyapatite can be achieved by several methods such as sol-gel method4, hidrotermal5, prescipitated6, microwave7, and microemulsi8. Among the various methods, which are used in this study is the sol-gel method with several advantages such as increased homogeneity due to atomic level mixing, finer grain microstructure, lower temperature of crystallization, use of little equitment and cost-effectivenes.9 Precursors used are calcium nitrate (Ca(NO3)) and diammonium hydrogen phosphate ((NH4)2HPO4) using NH4OH as pH regulator.
Experimental
Chemicals and Apparatus
Reagents grade chemicals such as limestone, nitiric acid (HNO3), ammonium hydroxide (NH4OH), diammonium hydrogen phosphate ((NH4)2HPO4). Apparatus used in this study were thermometers, glassware, magnetic stirre and hot plate, analytical balance, Wattmann (42) filter paper, and pH meter.
Procedure
To synthesize hydroxyapatite powders via sol-gel processing, 5.6 grams of CaO were added to 100 ml of 1 M HNO3 and stirred (600 rpm, 1 hours , 65°C). Then, they were filtered and resulted Ca(NO3)2. Stoichiometric ammounts of calcium nitrate (Ca(NO3) and diammonium hydrogen phosphate were dissolved in two seperate aqueous solotions at room temperature. The pH of mixture was adjusted to 9 in ammonia solution then stirred with temperature variation 50, 60, 70, 80 and 90°C for 5 hour. The formed sol was aging for 1 day to obtain a gel. Then filtered and dried at 105°C for 3 hours and calcined at 600°C for 5 hours. Product were characterized using XRD (Philips X’pert powder) to identify phase composition and crystallinity and SEM for surface morphology and particle size estimation.
Results and Discussion
X-ray diffraction (XRD)
XRD analysis was conducted to determine whether the hydroxyapatite crystals that are formed were amorphous, crystalline or polycrystalline. Analysis with XRD was depicted in Figure 1 showed for hydroxyapatite synthesized at different temperature.
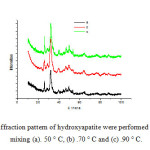 |
Figure1: X-ray diffraction pattern of hydroxyapatite were performed at a temperature of mixing (a). 50 ° C, (b) .70 ° C and (c) .90 ° C. Click here to View figure |
From figure 1 it can be seen that a sharp peak with high intensity was at an angle = 32.0731 ° and 25.9168 ° in accordance with the standards of the ICSD no.26205 at 50 ° C were confirmed that compound product it was hydroxyapatite with miller indices hkl values (211) and (002). The the highest intensity at 70 °C was 25.8728 ° and 32.2243 ° with miller indices hkl values (211) and (002). It was confirmed that product was hydroxyapatite. XRD was also showed that the obtained hydroxyapatite was formed at 50, 70 and 90°C (amorf phase).
From the XRD spectrum, we knowed the size of crystal by using Scherrer equation, where a sharp peak with narrow peak width indicated that the large crystal size, whereas the width of the peak indicated a small crystal size. By measuring the FWHM (Full Width at Maximum Hall) and the Scherrer equation, we can estimate the size of hydroxyapatite crystals. The following table 1 was the size of hydroxyapatite crystal data at temperature 50°C.
Table 1 : Crystal size of hydroxyapatite at 50° C
|
Line width (FWHM) |
2Theta (°) |
Crystal Size (nm) |
Specific surface area (m2/g) |
|
0.2558 |
25.9168 |
30.72 |
61.8077 |
|
0.8187 |
32.0731 |
10.09 |
188.1798 |
|
0.4093 |
34.0904 |
20.30 |
93.5337 |
|
0.9210 |
39.6668 |
9.17 |
207.0593 |
|
0.7164 |
46.5840 |
12.07 |
157.3102 |
|
0.4093 |
49.5052 |
21.37 |
88.8505 |
|
0.3582 |
53.1828 |
24.80 |
76.5619 |
From table 1, we know the size of hydroxyapatite crystals were in range 9-30 nm with specific surface area produced ± 61-208 m2/g. XRD spectrum on hydroxyapatite at 50°C showed the highest intensity were at 2θ = 25-32 ° angle.
The size of crystals at a temperature 70°C can be seen in the table 2. From the table 2 it could be seen that size of hydroxyapatite crystals were in range 8-11 nm and 91,89 nm at 32.2243°. The specific surface that was produced ± 162-220 m2/g. XRD spectrum hydroxyapatite at 70°C showed the highest intensity was 25-32°. For the size of the crystals formed was at a temperature of 90°C can be seen in table 3.
Table 2 : Crystal size of hydroxyapatite at 70° C
|
Line width (FWHM) |
2Theta (°) |
Ukuran kristal (nm) |
Specific surface area (m2/g) |
|
0.9446 |
25.8728 |
8.63 |
220.0155 |
|
0.9446 |
28.7647 |
8.68 |
220.7830 |
|
0.0900 |
32.2243 |
91.89 |
20.6631 |
|
0.9446 |
39.6516 |
8.94 |
212.3863 |
|
0.9446 |
44.0755 |
9.07 |
209.3422 |
|
0.8659 |
46.6432 |
9.99 |
190.0635 |
|
0.9446 |
49.5696 |
9.26 |
205.0468 |
|
0.8659 |
53.3282 |
11.49 |
165.2510 |
|
0.7872 |
63.8248 |
11.89 |
159.6917 |
|
0.8659 |
72.0091 |
11.34 |
167.4368 |
|
0.9446 |
77.8030 |
10.81 |
175.6461 |
|
0.9446 |
87.8018 |
11.67 |
162.7022 |
Table 3 : Crystal size of hydroxyapatite at 90° C
|
Line width (FWHM) |
2Theta (°) |
Crystal Size (nm) |
Specific surface area (m2/g) |
|
0.3149 |
26.1999 |
25.90 |
73.2958 |
|
0.4723 |
29.2622 |
17.39 |
109.2093 |
|
0.3936 |
31.9897 |
26.25 |
72.3409 |
|
0.3149 |
32.4390 |
26.28 |
72.2589 |
|
0.6298 |
34.4984 |
13.21 |
143.7847 |
|
0.7085 |
40.1119 |
11.94 |
159.0429 |
|
0.7872 |
44.1930 |
10.89 |
174.2933 |
|
0.6298 |
46.9677 |
13.76 |
138.0355 |
|
0.3149 |
49.7569 |
27.82 |
68.2706 |
|
0.2362 |
53.4477 |
37.66 |
50.4173 |
|
0.4723 |
64.2321 |
19.86 |
95.5973 |
|
0.9446 |
72.0305 |
10.40 |
182.5917 |
From the Table 3, we know the size of hydroxyapatite crystals were in the range 10-37 nm. The specific surface area are ± 50-182 m2/g. XRD spectrum of hydroxyapatite at 90°C showed the hightest intensity at 2θ = 26°-32° but, at 90°C, the peak shifted and based on ICSD 26205 standart XRD hydroxyapatite obtained at temperature mixing 50, 70 dan 90° C showed the compound was truly hydroxyapatite. Interestingly , at 70°C of temperature preparation, the size of the crystals were smaller than that the one and as the result is prepared at 50°C and 90°C, they were 8-11 nm.
Scanning Electron Microscopy (SEM)
SEM analysis was performed to characterize the surface morphology of the sample. In principle, surface analysis involving surface radiation with enough energy to penetrate and caused some transitions that resulted the emission from beam energy surface.
For SEM characterization, we carried out the formation of hydroxyapatite at 50°C and 70° C. Figure 2 is SEM analysis results for the mixing temperature of 50°C.
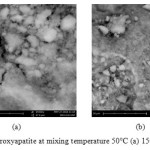 |
Figure2: SEM hydroxyapatite at mixing temperature 50°C (a) 15000x, (b) 5000x. Click here to View figure |
From figure 2 it can be seen that for the formation of hydroxyapatite at 50°C, the formed particles are not distributed and homogeneous. In addition, the form of hydroxyapatite compound was less clear.
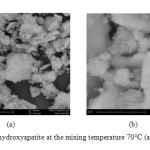 |
Figure3: SEM of hydroxyapatite at the mixing temperature 70°C (a)5000x, (b) 15000x. Click here to View figure |
For SEM results at 70°C was showed in figure 3. From figure 3, can we know that formed hydroxyapatite particle consists of large particles and small particles. The particles that formed were spherical and have aglomeration. There is particles distribution on hydroxyapatite compound. By using SEM-EDS, we could see composition of hydroxyapatite compound. Figure 4 was SEM-EDS analysis result at 70°C.
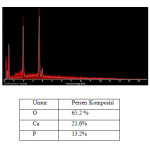 |
Figure 4 Click here to View figure |
The table 4 showed composition of hydroxyapatite from EDS analysis.From the EDS analysis result, we can conclude that the shape of hydroxyapatite prepared at 50°C was not clear, but at 70°C the hydroxyapatite that formed was spherical shape.
Acknowledgments
The authour would like to thank the analyst who has help in this research, friends in the Laboratory of Material Science Faculty of Andalas University for advice and another who helped this research.
References
- Sooksaen,P. Jumpanol,N. Crystallization of Nano-Sized Hydroxyapatite via Wet Chemical Process Under Strong Alkaline Conditions. Science Journal. 2010. 1, 1, 20-27
- N Montazeri, R Jahandideh, Esmaeil Biazar. Synthesis and characterization of hydroxyapatite calcium hydroxide for dental composite. Ceramic-silikaty. 2011. 55,.2, 123-126.
- Prakash,O,; Iqbal,SA.; Jacob,G.;Orient.J.Chem. 2013, 29(3), 1079-1084.
- Ziani, Salima. Meski, Samira. Khireddine, Hafit. Characterization of Magnesium-Doped Hydroxyapatite Prepared by Sol-Gel Process. International Journal of Applied Ceramic Technology. 2014. 11, 1, 83-91
- 5. Gomes, J. F. G., Cristina C.; Silva, Miguel a,; Hoyos, Milton. An Unvestigation of the Synthesis Parameters of the Reaction of Hydroxyapatite Precipitation in Aqueous Media. International Journal of Chemical Reactor Engineerin. 2008
- Shirley J.M. Duarte, Roseli M. Balestro, Solange F.Nascimento, Marize V.de, Oliveira, Magna M. Monteiro . Different routes for obtaining hydroxyapatite by sol-gel. Congresso lationo americano de orgaaos artificials e biomaterials. 2012
- Onur Rauf Bingol, Caner Durucan. Hydrothermal synthesis of hydroxyapatite from calcium sulfate hemihydrate. American Journal of Biomedical Sciences. 2011. 4, 50-59
- S.N. Danilchenko, O. V. K., M.V. Pogorelov, A.N. Kalinkevich, A.M. Sklyar, T.G. Kalinichenko,, V.Y. Ilyashenko, V. V. S., V.I. Bumeyster, V.Z. Sikora, L.F. Sukhodub, A.G. Mamalis,, & S.N. Lavrynenko, a. J. J. R. Chitosan–hydroxyapatite composite biomaterials made by a one step co-precipitation method: preparation, characterization and in vivo tests. Journal of bilogical physics and chemistry. 2009. 9, 119-126.
- Samar J. Kalita, Saurabh Verma, Mate. Sci. and Eng. C, 2010, 30; 295-303
- Palanivelu. R, A. Rubankumar. Synthesis and Spectroscopic Characterization of Hydroxyapatite by Sol-Gel Method. International Journal of ChemTech Research. 2013. 5, 6, 2965-2969
- Gunawan, Sopyan I, Suryanto. Zinc-doped biphasic calciumm phosphate nanopowders synthesized via sol-gel method. Indian Journal of Chemistry. 2014. 152-158

This work is licensed under a Creative Commons Attribution 4.0 International License.
![]()
A New Edition of Web of Science
Journal Impact Factor
2022: 0.5
Five Year: 0.8
Journal is Indexed in

Cabells Whitelist
![]()


