Development and Validation of Rp - Hplc Method for the Simultaneous Determination of Hydrochlorothiazide, Amlodipine Besylate and Telmisartan in Bulk and Pharmaceutical Formulation
RLC Sasidhar1*, S. Vidyadhara1, B. Deepti2, K. Tejaswi1, J. Suhasini1
1Chebrolu Hanumaiah Institute of Pharmaceutical Sciences, Chowdavaram, Guntur – 19, Andhra Pradesh, India
2Vignan Pharmacy College, Vadlamudi, Guntur, Andhra Pradesh, India
DOI : http://dx.doi.org/10.13005/ojc/300442
Article Received on :
Article Accepted on :
Article Published : 22 Dec 2014
A reverse phase high performance liquid chromatographic method has been developed for the simultaneous estimation of Hydrochlorothiazide, Amlodipine Besylate and Telmisartan in pharmaceutical formulation using RP - C18 column. The mobile phase (acetonitrile: acetate buffer adjusted to pH 5 with orthophosphoric acid) was pumped at a flow rate of 1.0 mL min-1 in the ratio of 60:40% v/ v and the eluents were monitored at 333 nm. Linearity was obtained in the concentration range of 20 – 100 µg mL-1 for hydrochlorothiazide, amlodipine besylate and telmisartan. The method was statistically validated and RSD was found to be less than 2% indicating high degree of accuracy and precision of the proposed HPLC method. Due to its simplicity, rapidness, high precision and accuracy, the proposed HPLC method can be applied for determining hydrochlorothiazide, amlodipine besylate and telmisartan in bulk and in pharmaceutical dosage form.
KEYWORDS:Hydrochlorothiazide; Amlodipine besylate and Telmisartan; RP - HPLC
Download this article as:| Copy the following to cite this article: Sasidhar RLC, Vidyadhara S, Deepti B, Tejaswi K, Suhasini J. Development and Validation of Rp - Hplc Method for the Simultaneous Determination of Hydrochlorothiazide, Amlodipine Besylate and Telmisartan in Bulk and Pharmaceutical Formulation. Orient J Chem 2014;30(4). |
| Copy the following to cite this URL: Sasidhar RLC, Vidyadhara S, Deepti B, Tejaswi K, Suhasini J. Development and Validation of Rp - Hplc Method for the Simultaneous Determination of Hydrochlorothiazide, Amlodipine Besylate and Telmisartan in Bulk and Pharmaceutical Formulation. Available from: http://www.orientjchem.org/?p=6125 |
Introduction
Hydrochlorothiazide (Figure 1) (HCT), 6 – chloro – 3, 4 – dihydro – 7 – sulfamoyl – 2H – 1, 2, 4 – benzothia – diazine – 1, 1 – dioxide, is a thiazide diuretic1. It increases sodium and chloride excretion in distilled convoluted tubule. Many analytical methods for HCT alone or in combination with other drugs including spectroscopic and chromatographic methods are also reported in literature 2-6.
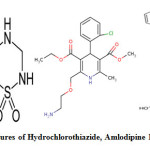 |
Fig1: Chemical structures of Hydrochlorothiazide, Amlodipine Besylate and Telmisartan Click here to View figure |
Amlodipine besylate (Figure 2) (AMB), 2 – [(2 – amino ethoxy) – methyl] – 4 – (2 – chloro phenyl) -1, 4 -dihydro – 6 – methyl – 3, 5 – pyridine dicarboxylic acid 3 – ethyl – 5 – methyl ester, benzene sulfonate, is a potent dihydro calcium channel blocker1. Various analytical methods have been reported for the assay of AMB alone or in combination with other anti – hypertensive agents in pharmaceutical formulations. They include UV spectroscopy, high performance liquid chromatography, high performance thin layer chromatography, , LC – MS and LC – MS/ MS 7-13.
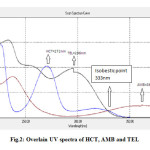 |
Fig2: Overlain UV spectra of HCT, AMB and TEL Click here to View figure |
Telmisartan (Figure 3) (TEL),2-(4-{[4-methyl-6-(1-methyl-1H-1,3-benzodiazol -2-yl)-2-propyl-1H-1, 3-benzodiazoll-1-yl] methyl} phenyl) benzoic acid, is a angiotensin converting enzyme inhibitor and angiotensin – II type I receptor blocker. Various analytical methods have been reported for the assay of TEL alone or in combination with other agenst. They include UV spectroscopy, high performance liquid chromatography . All three drugs are official in IP14, AMB and HCT are official in BP15, HCT is official in USP. Literature survey revealed that there are several methods were reported for the estimation of HCT, AMB and TEL individually as well as in combination with some other drugs. As no method is reported for SIMULTAneous estimation of the three drugs HCT, AMB and TEL in combination, the present was aim to develop accurate, precise and sensitive HPLC method for estimation of HCT, AMB and TEL in bulk and combined tablet dosage form. For the analysis of marketed tablet, TELVAS*-3D containing 12.5mg of HCT, 5mg of AMB and 40 mg of TEL was used 16-19.
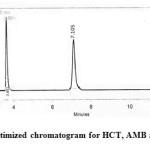 |
Fig3: Optimized chromatogram for HCT, AMB and TEL Click here to View figure |
Experimental
Instrumentation
Analysis was performed with a Agilent ODS UG 5 column, 250mm x 4.5mm with C18 column of injection capacity of 20 μL. The mobile phase was a 60:40% (v/ v) mixture of Acetonitrile: Acetate Buffer(50 mM, pH 5 ± 0.1, adjusted with orthophosphoric acid). The flow rate was 1.0 mL min−1 and the run time was 15 min. Before analysis both the mobile phase and sample solutions were degassed by the use of a sonicator (1.5LH Ultrasonic bath sonicator) and filtered through a 0.45 µ membrane filter paper. The identity of the compounds was established by comparing the retention times of compounds in the sample solution with those in standard solutions. Chromatography was performed in an ambient temperature maintained at 20 ± 1°C. The UV spectrum of HCT, AMB and TEL for selecting the working wavelength of detection was taken using a LAB INDIA double beam UV – Visible spectrophotometer with pair of 10 mm matched quartz cells.
Reagent and chemicals
Pharmaceutically pure sample of HCT, AMB and TEL were obtained as a gift samples from Mylan laboratories. All solvents were of AR grade obtained from S.D. Fine chem. Limited, Mumbai. A combination of HCT(12.5 mg), AMB (5 mg), and TEL (40 mg) in tablet formulation was procured from Indian market TELVAS*-3D, Aristo pharmaceutical Pvt. Ltd, India.
Preparation of Stock Solution of HCT, AMB and TEL
About 50mg of HCT, AMB and TEL were accurately weighed and transferred in to 50 mL volumetric flasks separately. It was dissolved in methanol and the solution was made up to the volume with same.
Construction of Calibration Plots
Calibration standards for each analyte were prepared at the concentrations of 20, 40, 60, 80 and 100µg mL-1 for HCT, AMB and TEL. All the solutions were chromatographed and the peak areas were measured. Peak areas were that plotted against their respective concentrations for HCT, AMB and TEL. From the plots it was found that all the drugs were linear in the concentration range of 20, 40, 60, 80 and 100µg mL-1 for HCT, AMB and TEL rspectively. Unknown assay samples were quantified by reference to these calibration plots.
Assay of Tablet Formulation
The contents of twenty commercial tablets were weighed and their mean mass was determined. After grinding the tablets into a fine powder in a glass mortar, an accurately weighed quantity of the tablet powder equivalent to 40 mg of TEL was quantitatively transferred into a 50 ml volumetric flask with about 45ml of methanol. The contents were sonicated for 15 min, to ensure the complete solubility of the drug. The mixture was then made up to 50 mL with methanol. The solution was made up to the mark with the solvent and filtered through a 0.45 µ membrane filter paper. From the clear solution, further dilutions were made by diluting 1.0 mL into 10 mL with mobile phase; to obtain 100µg mL-1 of TEL which is also contains 31.25µg mL-1 of HCT and 12.5 µg mL– 1 of AMB theoretically. Each sample solution was injected and the peak areas were measured for the determination of HCT, AMB and TEL in tablet formulation.
Statistical Calculations
Standard regression curve analysis was performed by use of Microsoft Office Excel 2007 software (Microsoft, USA), without forcing through zero. Means, standard deviations and other statistical parameters were calculated by use of SPSS software version 9.5 (SPSS, Cary, NC, USA).
Validation
The objective of method validation is to demonstrate that the method is suitable for its intended purpose as it is stated in ICH guidelines. The method was validated for linearity, precision (repeatability and intermediate precision), accuracy, selectivity and specificity. Accuracy was assessed by measuring recovery at three different levels. Precision assessed by measurement of intra and inter day precision. In the intraday study the concentrations of all the drugs were calculated six times on the same day at different time intervals. In the inter day study the concentrations of the drugs were calculated on six different days. Selectivity and specificity of the method were assessed by injecting solutions containing all the drugs; after chromatography three sharp peaks were obtained for all drugs. LOD and LOQ were measured to evaluate the detection and quantitation limits of the method and to determine whether these were affected by the presence of impurities. They were calculated by use of the equations LOD = 3.3 σ/S and LOQ = 10 σ/S, where σ is the standard deviation of the response and S is the slope of the calibration plot 20-21.
Stability Studies
To determine whether the developed method was stability indicating the tablets were stressed under different conditions to promote degradation. Regulatory guidance in ICH Q2A, Q2B, Q3B and FDA 21 CFR section 211 requires the development and validation of stability-indicating potency assays 22. The tablet formulation was exposed to dry heat in oven at 70°C about 48h. The tablets were then removed from the oven and were powdered. The solutions of the sample were prepared in mobile phase and injected to chromatographic system.
Results and Discussion
Hplc Method Development and Optimization
The multi component formulations have gained a lot of importance as there is greater patient acceptability, increased potency and decreased side effects. HCT, AMB and TEL are a recent combination in the market used for the treatment of hypertension. This work was focused on optimization of the conditions for the simple and rapid as well as low cost effective analysis including a selection of the proper column or mobile phase to obtain satisfactory results.
Solvent type, solvent strength (volume fraction of organic solvent(s) in the mobile phase and pH of the buffer solution), detection wavelength, and flow rate were varied to determine the chromatographic conditions giving the best separation. The mobile phase conditions were optimized so there was no interference from solvent and excipients.
Method development was started with Acetonitrile:Phosphate buffer pH-3.6 (55:45),but only two drugs were eluted, TEL was not eluted up to 10 min. The mobile phase was changed to Acetonitrile:Phosphate Buffer with pH-3.0 (50:50), but resolution is less. The mobile phase was changed to Acetonitrile:Acetate Buffer pH-5.0 (50:50), but resolution is less. The mobile phase was then adjusted by mixing acetonitrile with Acetate buffer (50 mM) in the ratio 60:40% v/ v. This resulted in distorted signals that were not well defined. Addition of 0.4 mL orthophosphoric acid and subsequent adjustment of the pH of buffer resulted in good separation and symmetrical peaks.
Table 1: Results from System Suitability Study
|
Parameters |
HCT* |
AMB* |
TEL* |
|
|
Retention time |
2.56 |
3.80 |
7.10 |
|
|
Tailing Factor |
1.42 |
1.35 |
1.34 |
|
|
Asymmetrical Factor |
1.78 |
1.56 |
1.52 |
|
|
Number of Theoritical plates |
2725 |
4598 |
6233 |
|
|
Capacity factor |
1.58 |
2.38 |
4.24 |
|
|
Resolution |
Between HCT and AMB 1.24 |
Between AMB and TEL 3.3 |
||
*Mean of six determinations.
To determine the appropriate wavelength for simultaneous determination of HCT, AMB and TEL, solutions of these compounds in mobile phase were scanned in the range of 200 – 400 nm. From the overlaid UV spectra, suitable wavelength choices considered for monitoring the drugs at 333nm (Figure 2). Solutions of each substance in the mobile phase were also injected directly for HPLC analysis and the responses (peak area) were recorded at 333 nm. It was observed that all analytes absorbed well at 333 nm, and at this wavelength there was no interference from the mobile phase or baseline disturbance, and it was, therefore, concluded that 333 nm was the most appropriate wavelength for analysis of all the drugs with suitable sensitivity.
Table 2: Results From Study Of Linearity
|
Parameters |
HCT* |
AMB* |
TEL* |
|
Detection wavelength |
333nm |
||
|
Beer’s law limit (µg mL-1) |
20-100 |
20-100 |
20-100 |
|
Correlation |
0.999 |
0.999 |
0.999 |
|
Coefficient (r) |
|||
|
Regression equation (y= mx+c) |
Y= 14245x + 40813 |
Y= 10121x + 15999 |
Y=11079 x -25536 |
|
Slope |
14245 |
10121 |
11079 |
|
Intercept (a) |
40813 |
15999 |
25536 |
|
LOD (µg mL-1) |
5.2 |
9.45 |
7.60 |
|
LOQ (µg mL-1) |
17.16 |
31.18 |
25.08 |
*Mean of six determinations.
The optimum mobile phase was, therefore, Acetonitrile: Acetate Buffer in the ratio of 60:40 (v/ v). Under these experimental conditions sharp peaks were obtained for HCT, AMB and TEL at the retention times 2.53 min, 3.83 min and 7.10 min, respectively. The optimized chromatogram for HCT, AMB and TEL (20 µg mL-1) were shown in Figure 3. The resolution (RS) between HCT and AMB are 1.35; AMB and VAL are 2.25.
Table 3: Results From Assay Of Tablet Formulation
|
Amount Present in |
Amount Obtained in |
Label Claim %w/w |
||||||
|
(mg/tab) |
(mg/tab) |
|||||||
|
HCZ |
AMB |
TEL |
HCZ |
AMB |
TEL |
HCZ |
AMB |
TEL |
|
12.5 |
5 |
40 |
12.48 |
4.99 |
40.05 |
99.84 |
99.8 |
100.12 |
Method Validation
The developed method was validated as per ICH guide lines. The system suitability parameters like capacity factor, number of theoretical plates, and USP tailing factor for all the analytes were found to be within the limit indicating the suitability of the system (Table 1). The number of theoretical plates and the USP tailing factor were within the acceptance criteria of >2000 and ≤ 1.5, respectively, indicating good column efficiency and optimum mobile phase composition.
Table 4: Intraday Precision of the Method
|
Parameters |
Hydrochlorothiazide |
Amlodipine Besylate |
Telmisartan |
|
Peak areas |
10250563 |
14552309 |
11608817 |
|
|
10236221 |
14428385 |
11780467 |
|
|
10253177 |
14530297 |
11791373 |
|
|
|||
|
Mean |
10246654 |
14503664 |
11726886 |
|
|
|||
|
SD |
9129.000457 |
66115.73396 |
102395.7653 |
|
|
|||
|
%RSD |
0.08 |
0.45 |
0.87 |
Linearity
Linearity was tested in the concentration range 20-100 µg mL-1 for HCT, AMB and TEL. The solutions were chromatographed six times, in accordance with the International Conference on Harmonization. Separate calibration plots for HCT, AMB and TEL were constructed by plotting peak area against the respective concentrations and the method was evaluated by determination of the correlation coefficient and intercept, calculated in the corresponding statistical study (ANOVA; P < 0.05), correlation coefficient r2 values > 0.999 and intercepts very close to zero confirmed the good linearity of the method. The P values calculated for the calibration plots were greater than 0.05, indicating the variances were not significantly different (Table 2).
Table 5: Inter Day Precision of the Method
|
Parameters |
Hydrochlorothiazide |
Amlodipine Besylate |
Telmisartan |
|
Peak areas |
10285752 |
14355863 |
11744526 |
|
|
|||
|
10240563 |
14538886 |
11714579 |
|
|
10218836 |
14272729 |
11791373 |
|
|
|
|||
|
Mean |
10248384 |
14389159 |
11750159 |
|
|
|||
|
SD |
34136.635 |
136166070 |
38705.69 |
|
|
|||
|
%RSD |
0.33 |
0.94 |
0.32 |
Precision
The precision of the method was determined by repeatability and intermediate precision studies. Intraday and Inter day precision was determined by repeating assay three times on same day for intraday (Table 4) and on three different days for inter day precision (Table 5). The intraday precision ranges from 0.08 to 0.12, 0.45 to 0.75 and 1.03 to 1.70 for HCT, AMB and TEL, respectively. The inter day precision ranges from 0.33 to 0.79, 0.94 to 1.07 and 0.32 to 0.58 for HCT, AMB and TEL, respectively.
Accuracy
To ensure the reliability and accuracy of the method, the recovery studies were carried out by adding a known quantity of drug with pre analyzed sample and contents were reanalyzed by the proposed method. To check the accuracy of the developed methods and to study the interference of formulation excipients, analytical recovery experiments were carried out as per ICH guidelines. The results of the recovery studies and its statistical validation data were given in table 6 which indicates high accuracy of the proposed method. The percentage recovery was found to be in the range of 100.15% for HCT, 100.20% for AMB and 100.73% for TEL.
Robustness
As defined by the ICH, the robustness of an analytical procedure describes to its capability to remain unaffected by small and deliberate variations in method parameters. Robustness was performed by small variation in the chromatographic conditions and found to be unaffected by small variations like ± 2% variation in volume of mobile phase composition, ± 0.1 mL min-1 in flow rate of mobile phase, ± 0.1 variation in pH.
Table 6: Results of Recovery Analysis
|
Drug |
Amount taken (μg mL-1) |
Amount added (μg mL-1) |
Recovery (%) |
S.D |
|
HCT |
50 |
10 |
99.22 |
0.6493 |
|
|
||||
|
50 |
30 |
98.90 |
||
|
|
||||
|
50 |
50 |
100.15 |
||
|
|
||||
|
AMB |
50 |
10 |
102.20 |
1.1405 |
|
|
||||
|
50 |
30 |
100.25 |
||
|
|
50 |
50 |
100.20 |
|
|
|
||||
|
TEL |
50 |
10 |
102.22 |
0.7791 |
|
|
||||
|
50 |
30 |
101.08 |
||
|
50 |
50 |
100.73 |
Specificity
The specificity of the HPLC method was ascertained by analyzing standard drug and sample solutions. The retention time of HCT, AMB and TEL was confirmed by comparing the retention time with that of the standard.
Assay of Tablet Formulation
The assay of commercial tablets was established with present chromatographic condition developed and it was found to be more accurate and reliable. The percentage label claim present in tablet formulation TELVAS*-3D was found to be 99.84, 99.8, 100.12 for HCT, AMB and TEL, respectively. The chromatogram for the analysis of formulation is shown in figure 3, Precision of the method was confirmed by the repeated analysis of formulation for six times (Table 3).
Stability
The assay of the three drugs was unaffected in different conditions indicating the stability indicating capability of the method. The chromatogram of the three drugs stored after 48 hrs at 700c was shown in figure 4.
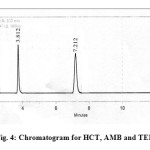 |
Fig4: Chromatogram for HCT, AMB and TEL Click here to View figure |
Conclusions
A simple isocratic RP – HPLC method with UV detection has been developed for simultaneous determination of HCT, AMB and TEL. The method was validated for accuracy, precision, specificity, and linearity. The run time is relatively short (15 min), which enables rapid quantification of many samples in routine and quality control analysis of tablets. Thus the proposed method is rapid, selective, requires a simple sample preparation procedure, Moreover, the lower solvent consumption leads to a cost effective and represents a good procedure of HCT, AMB and TEL determination in bulk and in pharmaceutical dosage forms.
Acknowledgements
The authors are thankful to the Mylan Labs limited, Hyderabad for providing gift sample of Telmisartan, amlodipine besylateand hydrochlorothiazide and also to the management of Chebrolu Hanumaiah Institute of Pharmaceutical Sciences, Chowdavaram, Guntur for providing facilities and great support to carry out the research work.
References
- S.Budavari, The Merck Index. 14th Edn., Whitehouse Station, NJ: Merck Research Lab, Division of Merck ? Co. Inc., USA, 2006; 827
- M.M. Baing, V.V.Vaidya, R.T.Sane, S.N.Menon and K.Dalvi. Chromatographia, 2006, 64(5), 293 – 296.
- K.P.Bhusari, P.B.Khedekar, Seema Dhole and V.S.Banode. Indian J Pharm Sci, 2009, 71(5), 505 – 508.
- S.L.Daniels and A.J.Vanderwielen. J Pharm Sci, 1981, 70 (2), 211 -215.
- D.Tian, X.Tian, T.Tian, Z.Wang and F.Mo. Indian J Pharm Sci, 2008, 70 (3), 372 – 374.
- H.Taomin, H.Zhong, Y.Bei, S.Luping, Z.Xiaowei and D.Gengli. J Pharm Biomed Anal, 41 (2), 644 -648 (2006).
- B.Neela Manish, D.Snehal Jawaharlal, M.Harinath Nivrutti and C.Prafulla Balkrishna. Asian J Res Chem, 2 (4), 393 – 397 (2009).
- S.Pallavie, G.Deepali, K.Rupali, D. Pandurang and B.Kishor. Asian J Res Chem, 2009, 2(4), 553 – 555.
- G.D.Vaijanath, B.S.Sweta, P.K.Pravin, P.Manisha and K.J.Vivek. J Pharm Biomed Anal, 2008, 46 (3), 583 -586.
- K.Ilango, P.B.Kumar and V.R.V.Prasad. Indian J Pharm Sci, 1997, 59(6), 171 – 173.
- Y.Feng, L.Zhang, Z.Shen, F.Pan and Z.Zhang. J Chromatogr Sci, 2002, 40(1), 49 – 53.
- J.Bhatt, S.Singh, G.Subbaiah, B.Shah, S.Kambli and S.Ameta. J Biomed Chromatogr 2007, 21, 169 – 175.
- Reddy, G.S., Reddy, S.L.N.P., Reddy, L.S., Orient J. Chem., 2013, 29(4), 1371-1380.
- Indian Pharmacopoeia, Controller of Publication, Govt. of India, Ministry of Health and Family Welfare, New Delhi, 2010; 2: 714, 318.
- British Pharmacopoeia, Vol. 1, London: Her Majesty’s Stationary Office; 2009, 2008, 565.
- P.Ajith, H.Sawarkar, Mukesh Singh, P.Kashyap, G.Priyanka. International Journal of Chem. Tech Research, 2011, 3, 657-660.
- G.Rekha, K.Sunil and P.Sharma. Journal of applied pharmaceutical sciences, 2011, 1, 46-49.
- C.H.Phani Kishore, V.Bhanu Prakash Reddy, M.K.Dhanashri. Int J Res Pharm Sci, 2010; 1, 493-501.
- R.Patel Amit, K.Chandrul Kaushal. International Journal of Pharmaceutical and Biomedical Research, 2011, 2, 4-16.
- ICH Q2A; Guidelines on validation of analytical procedure; Definitions and terminology, Federal Register, 1995, 60, 11260.
- ICH Q2B; Guidelines on validation of analytical procedure; Methodology, Federal Register, 1996, 60, 27464.
- ICH harmonized tripartite guideline, stability testing of new drug substances and products, Q1A (R2) , 2003, 1, 15.

This work is licensed under a Creative Commons Attribution 4.0 International License.
![]()
A New Edition of Web of Science
Journal Impact Factor
2022: 0.5
Five Year: 0.8
Journal is Indexed in

Cabells Whitelist
![]()


