Derivative Spectrophotometric and HPLC Validated Methods for Simultaneous Determination of Metformin and Glibenclamide in Combined Dosage Form.
Nabil. A. F. Alhemiarya1,2
1Department of Chemistry , College of Science & Arts – Sharurah, Najran University, Sharurah, Kingdom of Saudi Arabia. 2Department of Chemistry ,College of Science , University of Ibb, P. O. Box 70270, Ibb, Yemen.
DOI : http://dx.doi.org/10.13005/ojc/300408
Article Received on :
Article Accepted on :
Article Published : 20 Dec 2014
The aim of the present Study was to develop a simple and rapid method for determination of metformin (MET) and glibenclamide (GLB) ) in Pharmaceutical dosage form. A high-performance liquid chromatographic, fist and second derivative spectrophotometric methods used for the simultaneous determination of MET and GLB. The first derivative amplitudes at 236 nm and 275.7 nm were selected for the assay of MET and GLB, respectively. Calibration curves were established at 5–120 µg/ml for and 1–20 µg/ml, with limits of detection of 0.21µg/ml and 0.29 µg/ml and limits of quantification of 0.64µg/ml and 0.89 µg/mL for MET and GLB, respectively. The second derivative amplitudes at 244.6 nm and 229 nm were selected for the assay of MET and GLB, respectively. Calibration curves were established at 5–120 µg/ml for and 1–20 µg/ml, with limits of detection of 0.46 µg/ml and 0.30 µg/ml and limits of quantification of 0.1.41µg/ml and 0.91 µg/ml for MET and GLB, respectively. In the HPLC method separation was performed by using C18 reversed phase column and a mobile phase of acetonitrile: 0.05 M KH2PO4 (60:40v/v) adjusted by phosphoric acid to pH 3, at flow rate of 1 ml/min and the detection wavelength were 210 nm and 238 nm ,the retention time was found to be 3.145 and 7.792 min, linearity over the concentration ranges of 5–75 µm/ml and 2-45 µg/ml, with limits of detection of 0.64 µm/l and 0.02 µg/ml and limits of quantification of 1.95 µg/l and 0.07 µg/mL for MET and GLB, respectively. The methods were also applied for the determination of MET and GLB in the presence of their degradation products formed under variety of stress conditions. Proposed methods were validated for precision, accuracy, linearity range, robustness and ruggedness.
KEYWORDS:Simultaneous; Determination; Metformin; Glibenclamide; Derivative spectrophotometric; HPLC
Download this article as:| Copy the following to cite this article: Alhemiarya N. A. F. Derivative Spectrophotometric and HPLC Validated Methods for Simultaneous Determination of Metformin and Glibenclamide in Combined Dosage Form. Orient J Chem 2014;30(4). |
| Copy the following to cite this URL: Alhemiarya N. A. F. Derivative Spectrophotometric and HPLC Validated Methods for Simultaneous Determination of Metformin and Glibenclamide in Combined Dosage Form. Available from: http://www.orientjchem.org/?p=6097 |
Introduction
Glibenclamide(GLB),5-chloro-N-[2-4[[[(cyclohexylamino) carbonyl]-amino] sulphonyl]-phenyl]ethyl]-2-methoxy benzamide is a potent, second generation oral sulfonylurea antidiabetic agent widely used to lower blood glucose levels in patients with type 2 diabetes mellitus (Fig.1). It acts mainly by inhibiting ATP-sensitive potassium channels in pancreatic beta cells. This inhibition causes cell membrane depolarization, which cause voltage dependent calcium channels to open, which causes an increase in intracellular calcium in the beta cell, which stimulates insulin release. The literature survey reveals that few methods are reported for estimation of GLB 1-6.
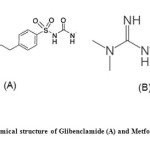 |
Fig1: Chemical structure of Glibenclamide (A) and Metformin (B) Click here to View figure |
Metformin hydrochloride (MET) chemically, N,N-dimethyl-imidodicarbonimidicdiamide hydrochloride is an antidiabetic agent from the biguanide class used in the management of type 2 diabetes (Fig.1). It does not cause insulin release from the pancreas and does not cause hypoglycemia, even in large dose. It decrease hepatic glucose production, decrease intestinal absorption of glucose and improves insulin sensitivity by increasing peripheral glucose uptake and utilization. Its predominant effect is to decrease fasting plasma glucose. Some methods have been reported in the literature for the estimation of MET in the presence of other drugs in formulations 7-14.
This combination can be achieved by taking each of the drugs separately or alternatively fixed formulations have been developed. Combinations of MET and GLB are available commercially as single tablets. Only few methods are available for the simultaneous estimation of MET and GLB 15-22.
The objective of this study was to investigate the utility of derivative spectrophotometry, multivariate methods in addition to a fast and sensitive HPLC technique in the assay of GLB and MET in pharmaceutical preparation without the necessity of sample pre-treatment. The proposed methods were optimized and validated for this purpose. According to the ICH description, the developed methods were accurate and precise23.
Experimental
Drug Substances and Dosage form
1,1-Dimethylbiguanid Hydrochlorid 97% (Metformin, MET) and Glybenclamide 99% pure substances, were kindly supplied by SPIMACO , Al-Qassim, Saudi Arabia. Diamet Tablets labeled to contain 500 mg MET and 5 mg GLB (obtained from the Saudi Pharmaceutical Industries Medical Appliance (SPIMACO), Al-Qassim, Saudi.
Chemicals
Acetonitrile (Fisher Scientific, UK). Potassium dihydrogen phosphate (KH2PO4)(Sigma-Aldrich Chemie, Germany). Orthophosphoric acid (H3PO4) (Sigma-Aldrich Chemie, Germany). Methanol (Sigma-Aldrich Chemie, Germany). Acetonitrile is HPLC grade and all other chemicals are analytical reagent grade.
Instrumentation
UV–Vis Spectrophotometric
A GENESYS 10S UV-Vis double beam spectrophotometer (Thermo Spectronic, USA) with a fixed slit width (1.8nm) connected to an IBM computer loaded with Thermo Spectronic VISION Lite version 4 software and 1cm quartz cell were used for the registration and treatment of absorption spectra. For all solutions, zero-order spectra were recorded over the range from 200.0 to 350.0 nm against a blank at intelliscan mode to enhance the signal to-noise ratio of absorbance peaks without extended scan duration with a Δλ = 5 nm .
High Performance Liquid Chromatogram (HPLC):
Agilent 1200 series isocratic quaternary pump HPLC instrument connected to 1200 multiple wavelength UV detector. Separation was performed by using C18 reversed phase column. Chromatographic peaks were electronically integrated and recorded using Chemstation software (Germany).
Preparation of Standard Solutions and Calibration:
Derivative Spectrophotometry Method
Accurately weighed 10 mg of MET was taken and transferred to a 10 ml volumetric flask, dissolved in methanol and diluted up to mark to obtain stock solution of 1000 µg/ml. From this solution, 0.5 ml was diluted to 10 ml to get 50 µg/ml standard MET solutions. Accurately about 1mg of GLB was weighed and transferred to a 10 ml amber colored volumetric flask and dissolved in methanol and volume was made up to mark to get stock solution of 100 µg/ml. From this solution, 0.2 ml was further diluted to 10 ml to get 20 µg/ml standard GBL solutions. Aliquots of 0.1 to 2.4 ml MET and 0.05 to 1 ml GLB were transferred into 10 ml volumetric flasks to reach the concentration ranges of 5-120 μg/ml for MET and 1-20 μg/ml for GLB.
HPLC Method
MET and GLB stock solutions in methanol were prepared by dissolving 10 mg of both drugs in 10 ml volumetric flasks (100μg/ml). Series of working solutions of MET and GLB were prepared by the appropriate dilution of the stock solutions with same solvent to reach the concentration ranges of 5-75 μg/ml for MET and 2-45 μg/ml for GLB. Triplicate 20 μl injections were made for each concentration using the following chromatographic conditions: Mobile phase consisting of acetonitrile: 0.05 M KH2PO4 (60:40 v/v) adjusted by phosphoric acid to pH 3. Detector wavelength: 210 nm for MET and 238 nm for GLB, flow rate: 1 ml/min at ambient temperature. Peak area of each concentration was plotted against the corresponding concentration for the construction of calibration graph.
Sample Preparation
Twenty tablets were weighed and finely powdered. An amount of the tablet powder equivalent to 500 mg of MET and 5 mg of GLB were weighed and finely powdered, a quantity of 10 mg of MET and 0.1 mg of GLB was weighed and transferred to 100 ml volumetric flask containing about 50 ml methanol. The solution was then solicited for 10 minutes and finally volume was made up to the 100 ml mark with diluent. Solution was filtered through Whatman grade No.42 filter paper. The final concentration of MET 100µg/ml and GLB 1µg/ml and this solution was used for the estimation.
Procedure for Forced Degradation Study
Degradation studies were performed in solutions containing drug at a concentration of 40µg/ml for MET and 20µg/ml for GLB. Samples were withdrawn and subjected to HPLC analysis, after suitable dilution. The stress conditions were as follows:
Stress Degradation by Hydrolysis Under Acidic Conditions
For acid degradation study 1ml of 0.1 M HCl was added to final drug solution. And it was refluxed for 2hr at 80° C. After 2hr this solution was injected in stabilized chromatographic condition.
Stress Degradation by Hydrolysis Under Alkaline Conditions
For alkali degradation study 1ml of 0.1 M NaOH was added to final drug solution. And it was refluxed for 2hr at 80° C. After 2hr this solution was injected in stabilized chromatographic condition.
Oxidative Degradation
For oxidation study 1ml of 3% v/v H2O2 was added to final drug solution. And it was refluxed for 2hr at 80°C. After 2hr this solution was injected in stabilized chromatographic condition.
Temperature Stress Studies
For temperature stress studies final drug solution was refluxed for 2hr at 80°C. And then after 2hr this solution was injected in stabilized chromatographic condition.
Results and Discussion
Absorption Spectra
The absorption spectra of MET and GLB and for their mixture were recorded. Fig. 2 shows the absorption spectrum of MET solution (20 μg/ml) with two maxima at wave length 226 nm and 274 nm, curve (b) show the absorption spectrum of GLB solution (10 µg/ml) with maximum wavelength of absorption at 212 nm. The total spectrum of mixture of is shown in curve (c) with λmax (214 nm) between the absorption maxima of the two components.
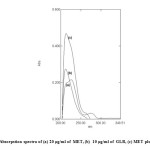 |
Fig2: Absorpstion spectra of (a) 20 μg/ml of MET, (b) 10 μg/ml of GLB, (c) MET plus GLB
|
First and Second Derivative Spectrophotometric Methods
The first and second orders derivative spectra of MET and GLB and for their mixture are shown in Fig. 3 and Fig. 4 respectively. It is obvious that there is a large overlap of the spectra of MET and GLB therefore, their determination, using the zero order absorption measurements, when present in the same solution is very difficult when using traditional two wavelengths of maximal absorption or the tangential base-line approximation techniques. On the other hand, derivative spectrophotometric technique is of a particular utility in determining the concentration of single component in such mixtures, with a large spectral overlapping. For this reason, derivative spectrophotometric methods have been applied. Both first and second order modes were tested, the results obtained show that these techniques could successfully applied when the measurements are carried out under optimum selection of slit width, response time, and scan speed for the monochromator. These were done by measuring the magnitude of derivative at several slit widths and scan speed with different response times. A slit width of 2 nm, a response time of 4 seconds and fast scan speed were found to be optimum.
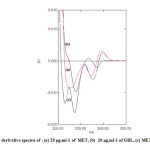 |
Fig3: First derivative spectra of : (a) 20 μg.ml-1 of MET, (b) 20 μg.ml-1 of GBL, (c) MET plus GLB
|
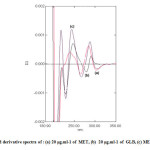 |
Fig4: Second derivative spectra of : (a) 20 μg.ml-1 of MET, (b) 20 μg.ml-1 of GLB, (c) MET plus GLB
|
In the present work, graphically peak-to-base line technique was used to deal with derivatives spectra to carry out the measurements.In fact that all these techniques in the first and second derivative modes show good proportionality to MET and GLB concentrations in their mixtures.
Fig. 5 and Fig. 6 show sets of first order spectra of mixtures containing different amounts of each of MET and GLB in the presence of (20 μg/ml) of the other compound respectively.
The results in Fig. 5 indicate that when the concentration of GBL is kept constant and the concentration of MET varied, the peak areas at the intervals (202 – 224 nm) and (224–262 nm) were proportional to the concentration of MET. Moreover, the peak-to-base line (i.e. amplitude measured in millimeter) at (236nm) was found in proportion to the MET concentration. The same features were found when inspecting Fig. 6 for the determination of GLB, i.e. peak areas in the wavelengths intervals of (225–254nm), (254–294 nm) and the peak amplitude measured at peak-to-baseline (275.5nm) and at zero cross of MET (223.9 nm) were in proportion to the concentration of GLB (Table1).
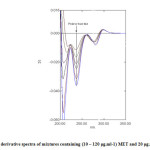 |
Fig5: First derivative spectra of mixtures containing (10 – 120 μg.ml-1) MET and 20 μg.ml-1 of GBL. |
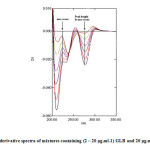 |
Fig6: First derivative spectra of mixtures containing (2 – 20 μg.ml-1) GLB and 20 μg.ml-1 of MET.
|
Fig. 7 and Fig. 8 show further sets of second derivative of the same above mixtures. Applying the same mentioned techniques in measuring peak amplitudes (in millimeter) at peak-to-base line and at zero crossing point of the other compound, and peak areas at selected wavelengths intervals enable the measurement of MET and GLB respectively (Table 1).
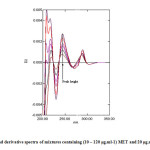 |
Fig7: Second derivative spectra of mixtures containing (10 – 120 μg.ml-1) MET and 20 μg.ml-1 of GLB.
|
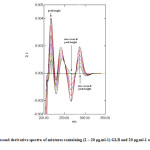 |
Fig8: Second derivative spectra of mixtures containing (2 – 20 μg.ml-1) GLB and 20 μg.ml-1 of MET.
|
HPLC Method
To perform the simultaneous elution of MET and GLB peaks, different chromatographic conditions were optimized. The composition of the mobile phase was studied by trying acetonitrile and 0.05 M of KH2PO4 in different ratios using gradient elution, The best peak shape and adequate separation of the two drugs was obtained by a final composition of acetonitrile-KH2PO4 (60:40 v/v) adjusted by phosphoric acid to pH 3. Different flow rates (0.5-1.2 ml/min) were tested; good resolution was obtained using 1 ml/min. Four wavelengths were tried (210, 230, 238 and 280 nm); much sensitive detector response was obtained at 210 nm for MET and 283 nm for GLB. System suitability parameters were calculated and the retention times were found to be 3.415 min for MET and 7.792 min for GLB, Fig. 9. Resolution and selectivity factors for this system were found to be 2.22 and 2.51 for MET and GLB, respectively. Tailing and capacity factors were obtained as 1.21 and 0.91 for MET and 1.51 and 1.55 for GLB. Results obtained from system suitability tests are in agreement with the USP requirements.
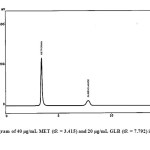 |
Fig9: Chromatogram of 40 μg/mL MET (tR = 3.415) and 20 μg/mL GLB (tR = 7.792) in pharmaceutical formulations. Click here to View figure |
Method Validation
The optimized first, second derivative spectrophotometric methods and HPLC were completely validated according to the procedure described in ICH guidelines and United State Pharmacopoeia for validation of analytical methods. The performance parameters evaluated for the method were linearity, precision, accuracy, limits of detection and quantitation, and ruggedness.
Linearity
The calibration curve was tested with five concentrations of the standard solutions of MET and GLB, as 5-120 µg/ml and 1-20 µg/ml for First, Second derivative spectrophotometric methods and 5-75 μg/ml and 2-45 μg/ml for HPLC method, respectively. The solutions were prepared in triplicate. The regression analysis data are represented in Table 1. The regression coefficients (r2) obtained was higher than 0.99 for MET and GLB, which attest the linearity of the method.
Table 1: Analytical parameters for the determination of MET and GLB by the proposed methods .
|
GBL |
MET |
Parameter |
||||||||
|
HPLC method |
Derivative spectrophotometric methods |
HPLC method |
Derivative spectrophotometric methods |
|||||||
|
2D |
1D |
2D |
1D |
|||||||
|
238 |
229 |
275.7 |
207 |
244.6 |
236 |
Wavelength (nm) |
||||
|
2-45 |
1-20 |
1-20 |
5-75 |
5-120 |
5-120 |
Linearity range (μg/ml) |
||||
|
0.9995 |
0.9990 |
0.9984 |
0.9996 |
0.9986 |
0.9974 |
Correlation coefficient (r2) |
||||
|
0.031 |
0.0013 |
0.0036 |
0.150 |
0.0024 |
0.0645 |
Intercept (a) |
||||
|
0.346 |
0.00006 |
0.00045 |
0.179 |
0.00004 |
0.00048 |
Slope (b) |
||||
|
0.0025 |
9.07×10⁻⁶ |
2.69×10⁻⁵ |
0.035 |
2.28×10⁻⁵ |
0.000236 |
Standard deviation of the intercept (Sa) |
||||
|
0.0065 |
0.000108 |
0.000383 |
0.022 |
0.00122 |
0.000293 |
Standard deviation of the slope (Sb) |
||||
|
1.4914 |
0.0001 |
0.0003 |
1.081 |
0.0002 |
0.0037 |
Standard deviation (SD) |
||||
|
0.02 |
0.30 |
0.29 |
0.64 |
0.46 |
0.21 |
Limit of detection LOD(μg/ml) |
||||
|
0.07 |
0.91 |
0.89 |
1.95 |
1.41 |
0.64 |
Limit of quantification LQD (μg/ml) |
||||
Precision
The precision of the assay was determined by repeatability (intra-day) and intermediate precision (inter-day). Repeatability was evaluated by assaying samples, at same concentration and during the same day. The intermediate precision was studied by comparing the assays on different days (3 d). Five sample solutions were prepared and assayed. The %R.S.D. value was lower than 2%, assure the precision of the method and the results are shown in Table 2.
Accuracy
To check the degree of accuracy of the method, recovery studies were performed in triplicate by standard addition method at 50%, 100% and 150% of nominal analytical concentration (40 μg/mL MET and 20 μg/mL GLB) were prepared and analyzed.. Known amounts of standard MET and BLG were added to pre-analyzed samples and were subjected to the proposed HPLC method. Results of recovery studies are shown in Table 2.
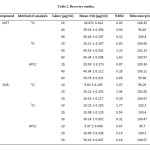 |
Table2: Recovery studies.Click here to View table |
Robustness
Robustness for HPLC method was determined by analysis of samples under deliberately changed chromatographic conditions. The flow rate of the mobile phase was changed from 1ml/min to 0.9ml/min and 1.1ml/min while the ratio of the mobile phase was changed by ± 2%. The effect on retention time and peak parameter were studied.
Detection and Quantitation Limits
In accordance with the recommendations of ICH23, the limit of detection, LOD =3.3 ∂/S, where ∂ is the standard of y-intercept and S is the sensitivity, namely the slope of the calibration graph. The limit of quantitation, LOQ, is defined as 10∂/S. In the first derivative spectrophotometric method the LOD and LOQ were found to be 0.21 μg/ml and 0.64μg/ml for MET and 0.29 μg/ml and 0.85 μg/ml for GLB, the scand derivative spectrophotometric method were found to be 0.46 μg/ml and 1.41μg/ml for MET and 0.30 μg/ml and 0.91 μg/ml for GLB, respectively. In the HPLC method the LOD and LOQ were found to be 0.64 μg/ml and 1.91 μg/ml for MET and 0.02 μg/ml and 0.07 μg/ml for GLB, respectively, Table 1. Obviously, the LOD and LOQ values are lower for the spectrophotometric methods due to the higher sensitivity of this technique.
Assay of Pharmaceutical Preparations
Due to the unavailability of the commercial tablets in the Saudi Arabia market, laboratory-made tablets were prepared and analyzed by the proposed first and second derivative spectrophotometric methods. No interference from commonly encountered tablet excipients such as talc, starch, lactose and magnesium stearate was observed in the analyses. The results, shown in Table 3, agree with nominal content showing reasonable precision and accuracy. This is evident from the low RSD (%) and Er (%) values. For each component, the results obtained by the proposed methods were statistically compared using the single factor analysis of variance (One-way ANOVA) test. The calculated t- test f- test didn’t exceed the critical value for any of the two drugs, indicating that there is no significant difference between the proposed methods 24.
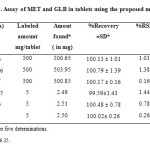 |
Table3: Assay of MET and GLB in tablets using the proposed methodsClick here to View table |
Degradation Behavior
The results of the stress studies indicated the specificity of the method that has been developed. GLB was degraded only in 3% H2O2 and in temperature stress conditions whereas MET was degraded in all conditions. The degraded products appeared at retention time (RTs) 2.18 and 2.48 in 0.1 M HCl, 2.16 and 2.48 in 0.1 M NaOH, 2.57 and 5.17 in 3% H2O2 and 2.15, 2.45 and 5.08 in temperature degradation studies. The result of forced degradation studies are given in Table.4.
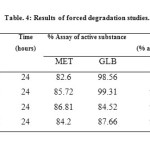 |
Table4: Results of forced degradation studies.Click here to View table |
Conclusion
The 1D, 2D and HPLC methods enable the simultaneous determination of amlodipine and atorvastatin in their binary mixture with good accuracy and precision, either in laboratory prepared samples or in combined dosage form. HPLC method has the advantage of being more sensitive but the spectrophotometric ones are simpler and less expensive but all of the proposed methods are rapid and selective. The good recoveries obtained in all cases as well as the reliable agreement with the reported method proved that, the proposed methods could be applied efficiently for simultaneous determination of MET and GLB with quite satisfactory precision and could be easily used in quality control laboratory for their analysis. The proposed HPLC method is very comparable to the reported HPLC one regarding retention times and limit of quantitation of both drugs. In addition to that, the C18 column used in the proposed HPLC method is more preferred than that used in the reported HPLC method due its availability and lower cost.
Acknowledgements
This work has been supported by Deanship of Sicentifiv Research of Najran University. Project number: NU/MID/13/13.
Refernces
- British Pharmacopoeia, The British Pharmacopoeia Secretariat, London., 1993; p.1/305-1/ 415.
- Prashanth, S.; Pradeep Kumar, Y.; Madhu, B.; Anil Kumar, A.; Int. J. Pharm. Bio. Sci. 2011, 1, 478-485.
- Venkata Rayanm, I.; Lakshman Rao, A.; Ramana, M. V.; Int. J. Res. Pharm. Biomed. Sci, 2011, 2, 856-872.
- Bandarkar, F. S.; Khattab, I. S.; J. Liquid. J. Chromatogr. Related .Technol, 2010, 33,1814–1830.
- Deeb, S. E.; Pren, P.; Watzig, H.; J. Pharm. Biomed. Anal.; 2007, 44, 85-95.
- Cicy, E.; Prasanth, V. G.; Amita, R.; Int. J. Chem. Tech. Res.; 2007, 4, 356-360.
- Indian Pharmacopoeia: Government of India Ministry of Health and Family Welfare, Indian Pharmacopoeia Commission: Ghaziabad, 2007,p. 1165, 1358.
- Brunton, L. L.; Lazo, J. S.; Parker, K. L.; Goodman and Gillman’s The Pharmacological Basis of Therapeutics, 15th ed, McGraw-Hill Medical Publishing division, 2006, p. 1634.
- Kanij, F.; Zakiur, Md. R.; Tasnuva, H.; Abdul, Md. K. A.; Selim, Md. R.; Dhaka. Univ. J .Pharm. Sci, 2010, 9, 83-89.
- Kar, M.; Choudhury, P. K.; Indian. J. Pharm. Sci, 2009,71, 318-319.
- Porta, V.; Schramm, S. G.; Kano, E. K.; Koono, E. E.; J. Pharm. Biomed. Anal, 2008, 46, 143-147.
- Umapathi, P.; Ayyappan, J.; Darlin Quine, S.; Trop. J. Pharm. Res.; 2012, 11, 107-116.
- Mubeen, G.; Noor, K.; Indian. J. Pharm. Sci.; 2009, 71,100–102.
- Patil, S. S.; Bonde, C. G.; Int. J. Chem. Tech. Res.; 2009, 1, 905-909.
- Khanolkar, D. H.; Shinde, V. M.; Indian Drugs, 1999, 36, 739–742.
- Mistri, H. N.; Jangid, A. G.; Shrivastav, P. S.; J. Pharm. Biomed. Anal, 2007, 45, 97–106.
- Chaturvedi, P. K.; Sharma, R.; Acta Chromatogr, 2008, 20, 451–461.
- Aburuz, S.; Millership, J.; McElnay, J.; J. Chromatogr. B. Analyt .Technol. Biomed Life. Sci, 2005, 817,277–286.
- De, A. K.; Dey, A. K.; Biswas, A.; IJSIT2, 2012, 1,98-105.
- Sohrabi, M. R.; Kamali, N.; Khakpour, M,; Anal. Sic, 2011, 27, 1037-1041.
- Georgita, C.; Albu, F.; David, V.; Medevedovici, A.; J. Chromatogr. B, 2007, 54, 211-218.
- Lia, E. P.; Feng, S. Y.; J. Chromatogr. B, 2006, 843, 94-99.
- International Conference on Harmonization, ICH Harmonized Tripartite Guidelines (Nov 2005), Validation of Analytical Procedures, Text and Methodology Q2 (R1). ICH, Geneva, 2005.
- Miller, J. N.; Miller, J. C.; Statistics and Chemometrics for Analytical Chemistry, 5th edition. Pearson Education Limited, Harlow, UK, 2005 p. 39–73, 107–149.

This work is licensed under a Creative Commons Attribution 4.0 International License.
![]()
A New Edition of Web of Science
Journal Impact Factor
2022: 0.5
Five Year: 0.8
Journal is Indexed in

Cabells Whitelist
![]()


