Chelating Competency and Electrochemical Response of a Heterocyclic Phenylhydrazone and its Copper Chelate
Vinod P Raphael, Joby Thomas K*, Shaju K. S., Nimmy Kuriakose
Dept. of Chemistry, St. Thomas’ College (University of Calicut), Thrissur, Kerala, India, 680001
DOI : http://dx.doi.org/10.13005/ojc/300479
Article Received on :
Article Accepted on :
Article Published : 24 Dec 2014
Heterocyclic compound 3-acetylpyridine phenylhydrazone (APPH) and its copper chelate were synthesized and characterized by spectral, elemental, magnetic and conductance measurements. Investigations showed that APPH behaved as bidentate ligand during chelation. The square planar geometry of the chelate was confirmed by magnetic and optical spectral studies. The detailed electrochemical response of the ligand and chelate were evaluated and reported.
KEYWORDS:Phenylhydrazone; chelate; square planar; cyclic voltammetry
Download this article as:| Copy the following to cite this article: Raphael V. P, Thomas K. J, Shaju K. S, Kuriakose N. Chelating Competency and Electrochemical Response of a Heterocyclic Phenylhydrazone and its Copper Chelate. Orient J Chem 2014;30(4). |
| Copy the following to cite this URL: Raphael V. P, Thomas K. J, Shaju K. S, Kuriakose N. Chelating Competency and Electrochemical Response of a Heterocyclic Phenylhydrazone and its Copper Chelate. Available from: http://www.orientjchem.org/?p=6167 |
Introduction
The compounds which possess azomethine linkage or Schiff bases are well-known for its chelating competency. Such molecules and their metal chelates are having wide variety of applications in the pharmaceutical, catalysis, analytical and corrosion field1-15. In the present investigation we explored the structure of the 3-acetylpyridine phenylhydrazone and its copper chelate using various spectroscopic methods. The electrochemical response of these synthesized compounds was also studied using cyclic voltammetry.
Materials and Method
3-acetyl pyridine was purchased from Fluka. Phenylhydrazine hydrochloride and cupric acetate were obtained from E. merck. Shimadzu model FT-IR Spectrometer (Model: IR affinity) and Shimadzu UV-visible-1800 spectrophotometer were used for recording infrared and electronic spectra. Mass spectrum of the hydrazone was recorded using QP 2010 model Shimadzu GCMS. 1Hnmr and 13Cnmr spectral studies were carried out on Bruker Avance III HD.
APPH was synthesized by condensing equimolar mixture of 3-acetylpyridine in ethanol and phenylhydrazine hydrochloride in ethanol water mixture (3:1). The reaction mixture was refluxed for four hours, evaporated nearly to dryness and allowed to cool slowly. The precipitated yellow coloured phenylhydrazone was filtered, washed with ethanol and dried.
The phenylhydrazone APPH (3mmol) in ethanol was heated to reflux, hot ethanolic solution (3mmol) of metal salt was added and the resulting mixture was refluxed for 5 hours, evaporated, cooled and the chelate separated was filtered.
Results and Discussion
Characterization of Phenylhydrazone
In the mass spectrum of APPH, the molecular ion peak was observed at m/z=211. 1Hnmr spectrum displayed nine signals for nine distinguished hydrogen atoms. The signal appeared at 2.28δ was due to the methyl protons (Table 1). A weak but broad signal appeared at 9.86δ was assignable to the NH proton of phenylhydrazine part. Two dimensional 1H-1Hnmr spectrum (COSY) was very helpful in identifying different hydrogen atoms (Figure 1). Nine diagonal contours were appeared in the COSY spectrum, for nine different protons of the molecule. Strong off diagonal peaks for H1-H2 & H1-H3 interactions were emerged in the COSY spectrum, which were originated by the strong ortho coupling. Due to the meta coupling between the protons H5 and H4 in the pyridine ring, weak contours were seen in the spectrum. H6-H7 and H5-H6 ortho coupling was confirmed by the strong off diagonal contours
The signals appeared in 13Cnmr spectrum of APPH were assigned for 11 labelled carbon atoms and given in Table 1. The signal of the azomethine carbon appeared at 137.99ppm. A peak observed at 12.53 ppm was assignable to methyl carbon atom. The quaternary carbon atoms labelled 6 and 4 gave their signals 134.88 and 145.07ppm respectively. On close observation of the molecular structure it is evident that the molecule APPH bear three quaternary carbon atoms, labelled as 4, 5 and 6. In the DEPT-135 spectrum of the molecule, the signals corresponds to these carbon atoms were totally absent, confirming that these peaks are definitely due to quaternary carbons. Since there were no methylene groups in the molecule, the DEPT 135 spectrum not displayed any inverse signals. In the HMQC spectrum of APPH (Figure 2), the 1Hnmr signal was absent corresponds to the C4 (observed at 145.07 ppm), since this carbon atom is not bearing a proton. Similarly the corresponding 1Hnmr signal was not appeared for C6 signal at 13Cnmr axis. The corresponding 13C contours for the proton signal appeared at 9.86δ was not present in the HMQC spectrum. This evidently establishes that this proton is not bearing a carbon atom and it is assigned for NH proton signal.
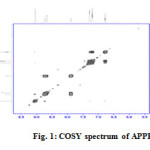 |
Fig1: COSY spectrum of APPH Click here to View figure |
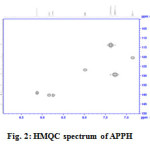 |
Fig2: HMQC spectrum of APPH Click here to View figure |
An intense IR peak appeared at 1593 cm-1 can be assigned to the C=N stretching vibration. A broad band displayed at 3265 cm-1 is due to N-H frequency. υC=N was appeared at 1465 cm-1 and C-H stretching frequencies was shown between 3030-3100 cm-1 and the bands appeared at 621 and 667 cm-1 can be considered as in-plane deformation mode of the pyridine ring. The important electronic transitions occurred in the molecules were observed at 32679 cm-1 and 29239 cm-1 which are attributed to ππ* and nπ* transitions respectively.
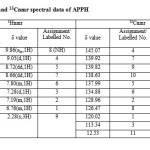 |
Table1: 1Hnmr and 13Cnmr spectral data of APPH Click here to View table |
Characterization of Cu(II) Chelate
Elemental analysis of the metal chelate: Metal %16.82 (16.21); C% 50.99 (51.96); H% 4.33 (4.84); N% 10.44 (10.69). Calculated values are represented in brackets. A square planar geometry was assigned to the Cu(II) chelate (Figure 3) since it displayed µeff of 1.97BM (d9 system)16-18, which was further confirmed by electronic spectroscopic studies. In the optical absorption spectrum, the chelate gave two bands at 27310 and 28998cm-1 which are due to 2B1→2A1 and 2B1→2B2 transitions respectively in addition to intra ligand transitions. Non-electrolytic nature of the chelate was established by the molar conductance data in DMSO (15 Ω-1cm2mol-1).
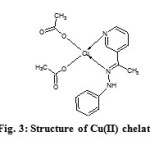 |
Fig3: Structure of Cu(II) chelate Click here to View figure |
Interpretation of the IR spectral data was very helpful for the assignment of the correct probe of the ligand which will make coordinate bonds with the central metal ion in a chelate. The IR spectrum of the phenylhydrazone exhibited a peak at 1593 cm-1, which was due to the stretching vibration of azomethine group. The υC=N of chelate was lowered to 1579 cm-1 which is an indication of the coordination of azomethine nitrogen. A confirmatory evidence for the coordination of heterocyclic nitrogen was also obtained from the IR spectral data. The in-plane deformation modes of pyridine ring shown by the ligand at 621 and 667cm-1 respectively shifted to 625 and 687 cm-1 in chelate, suggesting the coordination of the hetero aromatic nitrogen to the metal19-20. Appearance of new bands at 434 and 411 cm-1 respectively, is an indication of coordination of the heteroaromatic nitrogen and azomethine nitrogen of the ligand APPH to the central metal ion. The IR spectrum of Cu(II) chelate displayed asymmetric and symmetric stretching frequencies C-O bond of acetate ion at around 1597 and 1423 cm-1, respectively showing a difference of about 150 cm-1, which indicates the monodentate behaviour of acetate.
Cyclic Voltammetric Studies On 3-Acetylpyridine Phenylhydrazone
Figure 4a and 4b display the cyclic voltammogram of the phenylhydrazone APPH at scan rate 40mV/s and overlay contours of the voltammograms at various scan rates respectively. The CV diagram of APPH exhibited one reduction and oxidation peak and the redox couple behaved more close to a reversible system. The peak potentials (Ep) were independent of the scan rate, suggesting the behaviour of the reversible system. The peak separation (Epa-Epc) was comparable with the values of reversible redox couples and was independent on the rate of sweep. But the ratio of peak heights was greater than one and showed gradual rise with the scan rate. The cathodic peak current was not strictly proportional to the square root of sweep rate, but the anodic current exhibited fair proportionality to υ1/2 (Figure 5). Even though, some parameters emphasize the reversibility of the redox process, the actual electrochemical response of this system fall in the quasi reversible spectrum of compounds. The voltammetric data of the compound APPH is provided in Table 2.
Cyclic voltammetric Studies on Cu(II)-APPH Chelate
Cyclic voltammogram of Cu(II)-APPH chelate at scan rate 20mV/s is provided in Figure 6. In the forward scan, the voltammogram has two well defined cathodic waves with first peak (Epc1) situated at more negative cathodic potential and the second peak appeared at a less cathodic potential.
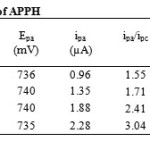 |
Table2: Cyclic voltammetric data of APPH Click here to View table |
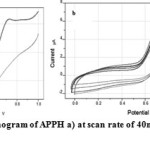 |
Fig4: Cyclic voltammogram of APPH a) at scan rate of 40mV/s b) at scan rates 40-100mV/s Click here to View figure |
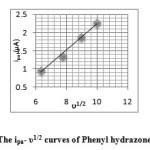 |
Fig5: The ipa– υ1/2 curves of Phenyl hydrazone APPH Click here to View figure |
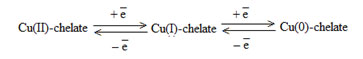
As the sweep increased both cathodic peaks were shifted to more negative potentials and at higher scan rates the Epc1 peak was disappeared. On reverse scan, two oxidation peaks were exhibited in the cyclic voltammogram, whose potentials are designated as Epa1 and Epa2. Epa1 and Epa2 are the genuine counter peaks of cathodic peaks Epc1 and Epc2 respectively. Both counter peaks were shifted to more positive potential as the scan rate was increased. The peak separation values of cathodic and anodic peaks suggest the quasi reversible nature of the redox system. Cyclic voltammetric data of Cu(II)-APPH chelate is given in Table 3. Taking into consideration the cyclic voltammetric response of Cu(II)-APPH chelate, one can propose the mechanism of electrochemical reactions as follows. The first cathodic curve can be assigned to the cathodic reduction of Cu(II)-chelate to the Cu(I)-chelate in a quasi reversible mechanism, since there is a negative shift to cathodic peak potential with increase in the scan rate.
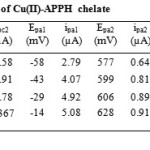 |
Table3: Cyclic voltammetric data of Cu(II)-APPH chelate Click here to View table |
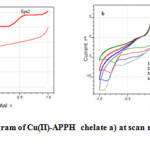 |
Fig6: Cyclic voltammogram of Cu(II)-APPH chelate a) at scan rate of 20mV/s b) at scan rates 20-80 mV/s Click here to View figure |
The second cathodic peak, which arise in the more negative potential to that of the first reduction peak is assignable to the reduction of Cu(I)-chelate to the Cu(0)-chelate. Since the Epc2 was also moved to the higher negative potentials with the scan rate, quasi reversible nature of the electrode process can be assumed. The peak height was not proportional to the square root of scan rate. The stability of Cu(0)–chelate is very low and the ligand molecules may or may not detach (decomplexation) from the metal atom within a short span. So the concentration of Cu(0)-chelate in the immediate vicinity of the carbon electrode will be very low. The first anodic peak in CV can be attributed to the anodic oxidation of Cu(0)-chelate, which is the counter peak of Epc1. The height of this anodic peak was high and showed proportionality with υ1/2 (Figure 7) which may be due to the combined oxidation of unstable Cu(0)-chelate and free Cu atoms adjacent to the electrode. The second anodic peak appeared at high positive potential can be assigned to the anodic oxidation of Cu(I)-chelate to Cu(II)-chelate in a quasi reversible manner. This peak was shifted to more positive potentials with the scan rate and the anodic current was proportional to υ1/2 (Figure 8). The overall mechanism can be represented as follows.
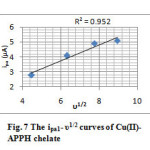 |
Fig7: The ipa1– υ1/2 curves of Cu(II)- APPH chelate Click here to View figure |
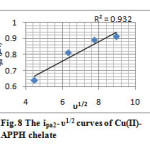 |
Fig8: The ipa2– υ1/2 curves of Cu(II)- APPH chelate Click here to View figure |
Conclusions
- Novel heterocyclic phenylhydrazone (APPH) and its copper chelate were synthesized.
- Structure of the ligand and chelate were established by various analytical methods and it was proved that a 1:1 stoichiometry exist between the ligand and the metal ion. Square planar geometry was suggested for the chelate.
- The electrochemical behaviour of the ligand and chelate were studied using cyclic voltammetry. One redox couple was shown by APPH, while the chelate displayed two redox couples in the voltammogram.
- The quasi reversible nature of the redox process was observed in both APPH and its Cu(II) chelate
References
- Prakash, A.; Singh, B. K.; Bhojak, N.; Adhikari, D.; Spectrochim. Acta. 2010, 76, 356-362
- Siddiqi, K. S.; Kureshy, R. I.; Khan, N. H.; Tabassum, S.; Zaidi, S.; Inorg. Chem. Acta. 1988, 151(2), 95-100
- Laidler, D. A.; Miller, D. J.; J. Organomet. Chem. 1984, 270, 121-129
- Zhu, L.; Li, Chenn, H.; Song, F.; Zhu, X.; Hua. Shif. Dax. Xue. Zirank. 2003, 37, 499-502
- Dash, B.; Mahapatra, P. K.; Panda, D.; Patnaik, J. M.; J. Indian Chem. Soc. 1984, 61, 1061-1064
- Rao, N. R.; Rao, P. V.; Reddy, G. V.; Ganorkar, M. C.; Indian J. Chem.1987, 26A, 887-890
- Mishra, P.; Gupta, P. N.; Shakaya, A. K.; J. Indian Chem. Soc. 1991, 68, 539-541
- Srinivasa. V.; Srivastava, S. K.; Mishra, A. P.; J. Indian Chem. Soc. 1995, 72, 47-78
- Dhakrey, R.; Saxena, G.; J. Indian Chem. Soc. 1987, 64, 685-686
- Rîmbu, C.; Danac, R.; Pui, A.; Chem. Pharm. Bull. 2014, 62 (1), 5-12
- Vinod, P. R.; Joby, T. K.; Shaju, K. S.; Aby, P.; Res. Chem. Intermed. 2014, 40, 2689-2701
- Shaju, K. S.; Joby, T. K.; Vinod. P. R.; Oriental. J. Chem. 2014, 30(2), 807-813
- Joshi, K. T.; Pancholi, A. M.; Oriental. J. Chem. 2000, 16, 287-290
- Singh K.; Barwa, M. S.; Eur. J. Med. Chem. 2006, 41, 147-152
- Ruiz, E.; Alemany, P.; Alvarez, S.; Cano, J.; Inorg. Chem. 1997, 36(17), 3683-3688
- Biradar, N. S.; Havinale, B. R.; Inorg. Chim. Acta 1976, 17, 157-160
- Coles, R. B.; Harris, C. M.; Sinn, E.; Inorg. Chem. 1969, 8 (12), 2607-2612
- Mendes, I. C.; Moreira, J. P.; Mangrich, A. S.; Balena, S. P.; Rodrigues, B. L.; Beraldo, H.; Polyhedron, 2007, 26, 3263-3270
- Mendes, I. C.; Moreira, J. P.; Speziali, N. L.; Mangrich, A. S.; Takahashi, J. A.; Beraldo, H.; J. Braz. Chem. Soc. 2006, 17, 1571-1577
- Recio-Despaigne, A. A.; Da Costa, F. B.; Piro, O. E.; Castellano, E. E.; Louro, S. R. W.; Beraldo. H.; Polyhedron, 2012, 38, 285-290

This work is licensed under a Creative Commons Attribution 4.0 International License.
![]()
A New Edition of Web of Science
Journal Impact Factor
2022: 0.5
Five Year: 0.8
Journal is Indexed in

Cabells Whitelist
![]()


