A Comparative Study of Cellulose Agricultural Wastes (Almond Shell, Pistachio Shell, Walnut Shell, Tea Waste And Orange Peel) for Adsorption of Violet B Dye from Aqueous Solutions
Saeedeh Hashemian
Chemistry Department, Islamic Azad University, Yazd Brunch, Yazd, Iran
DOI : http://dx.doi.org/10.13005/ojc/300478
Article Received on :
Article Accepted on :
Article Published : 16 Dec 2014
Adsorption of violet B azo dye from aqueous solutions was studied by different cellulose agriculturalwaste materials (almond shell (AS), pistachio shell (PS), walnut shell (WS), Tea waste (TW) and orange peel (OP)). Cellulose agricultural waste sorbents characterized by FTIR and SEM methods. The effects of different parameters such as contact time, pH, adsorbent dosage and initial dye concentration were studied.Maximum removal of dye was obtained at contact time of 90 min and pH 11.The adsorption of violet B was fitted by pseudo-second-order kinetic model.The Langmuir isotherm model was better fitted than Freundlichmodel. The results showed that the adsorption efficiency of violet B by cellulose agricultural waste materials is as followed: Almond shell > Orange peel > Pistachio shell > Tea waste> Walnut shell.The maximum adsorption capacity was obtained 96, 82, 71.4, 55.5 and 48.7 mg g−1 for AS, OP, PS, TW and WS, respectively.
KEYWORDS:Adsorption; Agricultural wastes; Cellulose-based wastes; Violet B
Download this article as:| Copy the following to cite this article: Hashemian S. A Comparative Study of Cellulose Agricultural Wastes (Almond Shell, Pistachio Shell, Walnut Shell, Tea Waste And Orange Peel) for Adsorption of Violet B Dye from Aqueous Solutions. Orient J Chem 2014;30(4). |
| Copy the following to cite this URL: Hashemian S. A Comparative Study of Cellulose Agricultural Wastes (Almond Shell, Pistachio Shell, Walnut Shell, Tea Waste And Orange Peel) for Adsorption of Violet B Dye from Aqueous Solutions. Available from: http://www.orientjchem.org/?p=5917 |
Introduction
Many industries such as textile, paint, paper, plastics, leather, food and cosmetic often use dyes and pigments to color their products. Most of synthetic dyes have complex aromatic molecular structures. Dyes can cause allergic dermatitis, skin irritation, cancer, mutation, etc. Dyes also are highly toxic to some organisms and hence disturb the ecosystem [1, 2]. Dyes are usually stable to bio-degradation, photo-degradation, and oxidizing agents [3], which led to intensive investigations on different methods to remove color from dye effluent. These studies include the use of coagulants [4], ultra-filtration [5] and electro-chemical [6, 7]. Adsorption methods, are the most widely used techniques [8–12]. The advantages and disadvantages of each technique have been extensively reviewed. Of these methods, adsorption has been found to be an efficient and economic process to remove dyes, pigments and other colorants and also to control the bio-chemical oxygen demand [13]. Extensive research has been carried out during the last ten years to find low-cost, high capacity adsorbents for the removal of dyes [14-16].
Adsorption has been described as an effective separation process for treating industrial and domestic effluents. It is widely used as effective physical method of separation in order to eliminate or lower the concentration of a wide range of dissolved pollutants (organics or in organics) in the effluent.The use of cheap and ecofriendly adsorbents was studied as an alternative substitution of activated carbon for removal of dyes from wastewater. The agricultural and forestry waste products represent unused resources and also they are widely available.
Different kinds of activated carbon have been achieved from different agriculture wastes and used as low-cost adsorbents for removal of organic compounds and dyes from aqueous solution [17-23]. Almond is one of the important agricultural materials. The shells of almond are waste materials and generally discarded as a waste. It can be collected on community basis for reuse. Almond shells are abundant, inexpensive and readily available lignocellulosic material. Almond shells can be used as sorbent. The cell walls of almond shell consist of cellulose, silica, lignin and carbohydrates which have hydroxyl groups in their structures [24–26]. Orange, as a kind of biological resources is available in large quantities in many parts of the world. Dried orange peel was previously investigated to adsorb acid violet 17 and Direct Red 23 [27,28]. The purpose of this work was to test the possibility and comparative study of using cellulose-based wastes (almond shell, pistachio shell, walnut shell, tea waste and orange peel) for adsorption of violet B dye.
Experimental
Materials and Method
Soft pistachio shell, almond shell, walnut shell, waste tea and orange peel (PS, AS, WS, WT, OP) were used as cellulose agricultural waste materials. Pistachio shell,almond shell and walnut shell were collected from a local center of preparation of shell-removed (IRAN- Yazd). Orange peels were collected from a local fruit field in the south of Iran. The collected biomaterial was extensively washed under tap water to remove any particulate sprayed with distilled water. The tea waste was washed with tap water and distilled water for several times to remove all the dirt particles. It was then boiled with distilled water to remove caffeine, tannin and other dyes and washed with distilled water till the washing water contains no color. The shells were preheated in an oven at 100 °C for about 48 h to reduce the moisture content. Cellulose agricultural wastes were cut into small pieces. After sieving the particle size of materials was remained between 1–5 mm. Some of properties of cellulose agricultural wastes are summarized in Table. 1.
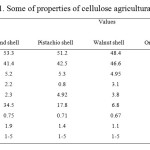 |
Table1: Some of properties of cellulose agricultural wastesClick here to View table |
All chemicals were analytical reagent grade. Distillated waster was used at all of experiments. 1-Naphthalenesulfonic acid, 3-((4′-((2-amino-8-hydroxy-6-sulfo-1-naphthalenyl)azo)(1,1′-biphenyl)-4-yl)azo)-4-hydroxy-, disodium salt (Violet B) was purchased from Merck. Violet B is double azo class with molecular formula of C32H21N5Na2O8S2 (MW=713.65).It was used as received without further purification. The stock solution of 1000 mg L-1 of VB dye was prepared in double distilled water. The dilution was done in distilled water when necessary. Chemical structure of Violet B is shown in Fig. 1. The percent removal of Violet B by the hereby adsorbent is given by:
% Removal = (C0-Ce)/C0 × 100
Where C0, Ce denotes the initial and equilibrium dye concentration (mg L-1).
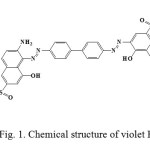 |
Fig1: Chemical structure of violet B Click here to View figure |
IR measurements were performed by FTIR tensor-27 of Burker Co. Pressed pellets were prepared by grinding the powder specimens with spectroscopic grade KBr for FTIR spectra test. UV-Vis spectrophotometer 160 A Shimadzu was used for determination of concentration of dye. Scanning electron microscopy was performed using a Philips SEM model XL30 electron microscope. The pH was adjusted by addition of HCl or NaOH. All pH measurements were carried out with an ISTEK- 720P pH meter. The suspensions containing 1.0 g of the sorbent with varying amounts of dye was shaken in an orbital shaker at 150 rpm.
Result and Discussion
Characterization of Adsorbent
FTIR spectrum of cellulose agricultural wastes (a-Orange peel, b-Almond shell, c-Pstahio shell, d- walnut shell and e- Teawaste) are shown in Fig. 2. The broad peak around 3367-3410 cm-1 correspond to O–H stretching vibrations, due to inter and inter-molecular hydrogen banding of polymeric compounds (macromolecular associations), such as alcohols, phenols and carboxylic acids, as in pectin, cellulose groups on the adsorbent surface. The peaks at 2916 cm-1and 2924 cm-1 are attributed to the symmetric and asymmetric C–H stretching vibration of aliphatic acids. The peak observed around at 1630 cm-1 is the stretching vibration of bond due to non-ionic carboxyl groups (–COOH, –COOCH3), and may be assigned to carboxylic acids or their esters. Broad peak at 1040-1070cm-1 may be due to stretching vibration of C–OH of alcoholic groups and carboxylic acids. [29, 30].
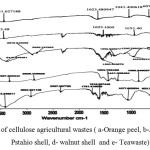 |
Fig2: FTIR of cellulose agricultural wastes ( a-Orange peel, b-Almond shell, c- Pstahio shell, d- walnut shell and e- Teawaste) Click here to View figure |
The SEM images of cellulose agricultural wastes (walnut shell (WS), Pstahio shell (PS), Orange peel(OP), Tea waste(TW) and Almond shell (AS)) are shown in Fig 3.
The SEM images obviously are shown the porous nature cellulose agricultural wastes.
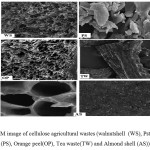 |
Fig3: SEM image of cellulose agricultural wastes (walnut shell (WS), Pstahio shell (PS), Orange peel(OP), Tea waste(TW) and Almond shell (AS)) Click here to View figure |
Adsorption Study
Effect of Contact Time
Effect of contact time on the adsorption of violet B by Almond shell (AS), Pstahio shell (PS), Orange peel (OP), Tea waste(TW) and walnut shell (WS) was studied at different times (0-600 min). 50 mL of 30 mg L-1 of violet B and 1.0 g of waste shells was used. After different agitation times, absorbance of filtrated dye was determined.The effect of contact time on removal of violet B by AS, WS, PS, TW and OP as a function of time is shown in Fig. 4.The adsorption increases with increasing of contact time. Obviously, the adsorption equilibrium was attained after stirring for 90 min. It was found that more than 80% removal of violet B was occurred in the first 90 min of contact time, and thereafter the rate of adsorption was found to be slow.The efficiency of activity of sorbents were as follow: Almond shell > Orange peel > Pistachio shell > Tea waste> Walnut shell. The high activity of almond shell for violet B removal is due to higher its surface area.
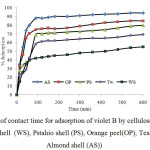 |
Fig4: Effect of contact time for adsorption of violet B by cellulose agricultural wastes (walnut shell (WS), Pstahio shell (PS), Orange peel(OP), Tea waste(TW) and Almond shell (AS)) Click here to View figure |
Effect of pH
The pH of aqueous solution is an important controlling parameter in the adsorption process.To determine the optimum pH, the pH value was changed from 2 to 11 with fixed initial concentration of 30 mg L-1 of violet B and contact time 90 min.Fig. 5 shows the effect of pH on the removal of violet B from aqueous solution by cellulose agricultural wastes (AS, WS, PS, TW and OP).
Results show that the maximum removal of violet B is observed at pH 11.It seems, the mechanisms of adsorption was done by electrostatic interaction between sorbents and dye.Low pH value (2.0–6.0) leads to an increase in H+ ion concentration in the system and the surface of the sorbents acquires positive charge by absorbing H+ ions. As the shells surface is positively charged at low pH value, a significantly strong electrostatic repulsion appear between the sorbent surface and dye molecules leading to minimum adsorption of dyes.On the other hand, increase of the pH value (basic condition) led to increase of the number of negatively charged sites and the number of positively charged sites decreases. A negatively charged surface site on the sorbents is favor for adsorption of violet Bas a cation dye due to the electrostatic attraction.The lowest adsorption occurred at pH 2.0 and the greatest adsorption occurred at pH 11. Therefore, optimum pH value 11 for dye adsorption was determined[31-33].
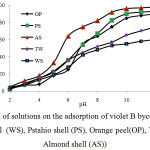 |
Fig5: Effect of pH of solutions on the adsorption of violet B bycellulose agricultural wastes (walnut shell (WS), Pstahio shell (PS), Orange peel(OP), Tea waste(TW) and Almond shell (AS)) Click here to View figure |
Effect of Adsorbent Mass
The adsorption of violet B onto cellulose agricultural wastes was studied by varying of adsorbent quantity (0.1-3g) in the test solution while keeping the initial dye
concentration (30 mg L-1), temperature (25 ± 1°C) and contact time 90 min. The effect of different adsorbent dosages within the range 0.1–3 g on the removal of violet B by cellulose agricultural wastes (walnut shell (WS), Pstahio shell (PS), Orange peel (OP), Tea waste(TW) and Almond shell (AS)) is shown in Figure 6.
The percent adsorption was increased with adsorbent dosage from 0.1- 1.0 g under the optimized conditions.Increase in adsorption with adsorbent dose can be attributed to increased adsorbent surface area and availability of more adsorption sites.The removal more than 1.0 g of adsorbent dosage is only marginal. However, after the attainment of a critical dosage (1.0 g), the percentage removal slowly increased.This may be attributed to over lapping or aggregation of adsorbent surface area available to dye and an increase in diffusion path length.
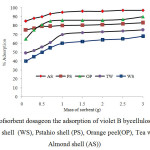 |
Fig6: Effect ofsorbent dosageon the adsorption of violet B bycellulose agricultural wastes (walnut shell (WS), Pstahio shell (PS), Orange peel(OP), Tea waste(TW) and Almond shell (AS)) Click here to View figure |
Effect of Initial Concentration of Violet B
The effect of initial violet B concentration on the adsorption process was investigated at constant concentration of cellulose agricultural waste sorbents (1.0 g) and different initial violet B concentrations (5-50 mg L-1). High percentage removal of violet B dye was observed for lower concentration of dye for all adsorbents. The decrease in adsorption, with increasing of concentration of dye is attributed to the increase in the mass transfer driving force.
Adsorption Kinetic Study
Adsorption kinetic is important from the point of view to control the process efficiency. The adsorption of a solute by a solid in aqueous solution is a phenomenon with often complex kinetics. The adsorption rate is strongly influenced by several parameters related to the state of the solid, generally having very heterogeneous reactive surface, and to the physicochemical conditions under which adsorption is carried out. Various kinetic models have been used by various researchers, where the
pseudo-first-order [34]and pseudo-second-order models were studied [35, 36]. The pseudo-first order model assumes that the rate of change of solute uptake with time is directly proportional to difference in saturation concentration and amount of solid uptake with time [34].
ln (qe – qt) = ln qe – k1 t (1)
Where qe and qt are the amounts of dye adsorbed per unite mass of the adsorbent (mg g-1) at equilibrium and time t, respectively and k1 is the rate constant of adsorption (min-1). When ln (qe – qt) was plotted against time, a straight line should be obtained with a slope of k1, if the first order kinetics is valid.
The pseudo-second order model as developed by Ho and McKay [35, 36] has the following form:
t/ qt = t/qe + 1/(k2qe2) (2)
Where qeand qt represent the amount of dye adsorbed (mg g-1) at equilibrium and at any time. k2 in the rate constant of the pseudo-second order equation (g mg-1 min-1). A plot of t/q versus time (t) would yield a line with a slope of 1/ qe and an intercept of 1/ (k2qe2), if the second order model is a suitable expression.
The plot between ln (qe – qt) versus time t shows the pseudo first order model and the plot of t/q versus time t shows the pseudo second order model (Figs 7 and 8), respectively. The kinetic model with a higher correlation coefficient R2 was selected as the most suitable one (Table 2). The results show that adsorption kinetics of violet B fitted well by pseudo-second-order kinetic model [29].
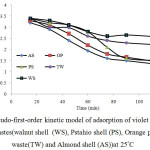 |
Fig7: Pseudo-first-order kinetic model of adsorption of violet B bycellulose agricultural wastes(walnut shell (WS), Pstahio shell (PS), Orange peel(OP), Tea waste(TW) and Almond shell (AS))at 25°C Click here to View figure |
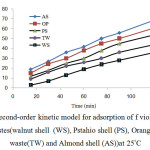 |
Fig8: Pseudo-second-order kinetic model for adsorption of f violet B bycellulose agricultural wastes(walnut shell (WS), Pstahio shell (PS), Orange peel(OP), Tea waste(TW) and Almond shell (AS))at 25°C Click here to View figure |
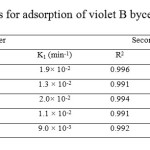 |
Table2: Kinetic parameters for adsorption of violet B by cellulose agricultural wastes Click here to View table |
Adsorption Isotherm
Adsorption capacity and adsorption behavior of violet B by cellulose agricultural wastes can be illustrated by adsorption isotherm.The most widely accepted surface adsorption models for single-solute systems are the Langmuir and Freundlich models. The Langmuir isotherm assumes a surface with homogeneous binding sites, equivalent sorption energies, and no interaction between adsorbed species. Its mathematical form is written as:
Ce/qe = (1/ qmaxkL) + Ce /qmax(3)
Where, qmax and kL represent the maximum adsorption capacity for the solid phase loading and the energy constant related to the heat of adsorption respectively. A plot of Ce /qe versus Ce gives KL and qmax if the isotherm follows the Langmuir equation.
The Freundlich isotherm is an empirical equation based on:
qe=KFCe1/n (4)
Log qe =logKF+1/n log Ce (5)
Where, kF (L g-1) and n are Freundlich constants related to adsorption capacity and adsorption intensity, respectively. The intercept KF obtained from the plot of log qe versus lnCe is roughly a measure of the sorption capacity and the slope (1/n) of the sorption intensity.Results from the Langmuir and Freundlich analysis of the adsorption of violet B by cellulose agricultural wastes are also reported in Table 3. The correlation coefficient values indicate that the Langmuir model describes better the adsorption of violet B by cellulose agricultural wastes.
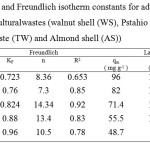 |
Table3: Langmuir and Freundlich isotherm constants for adsorption of violet B by cellulose agricultural wastes (walnut shell (WS), Pstahio shell (PS), Orange peel(OP), Tea waste (TW) and Almond shell (AS)) Click here to View table |
Conclusion
Low-cost agricultural waste material was used as adsorbent for adsorption of violet B from aqueous solutions.The adsorption process was attained equilibrium within 90 min of contact time and pH 11. Kinetic studies were made for the adsorption of violet B from aqueous solutions on to agricultural waste. The kinetic was found to be best-fit pseudo-second- order equation.The Langmuir and Freundlich adsorption models were used to express the sorption phenomenon of violet dye. The data obtained were in good agreement with the Langmuir isotherm model.
Acknowledgements
The authors wish to thank Islamic Azad University of Yazd (IAUY) for the financial support of this work. This thank co-workers and technical staff in the chemistry department help during various stages of this work.
References
- Saha, C.;Text Dyer PrinterXXIX ,1996, 21, 13-26.
- Phillips, D. A. S. ;J. Soc. Dyers Color. 1996, 112, 183-186.
- Ramakrishna, K.R.; Viraraghavan, T.;Water Sci. Technol. 1997, 36,189–196.
- Bozdogan, A.; Goknil, H.; MU Fen. Billimeri.Dergisi.Sayi.1987, 4, 83-90.
- Majewska-Nowak, K.; Desalination, 1989, 71, 127-135.
- Shendrik, O.R.; Kimiyi. Technol. Vody.1989, 11, 467-471.
- Ding, Z.; Min, C.W. ;Hui, W.Q. ;Water Sci. Technol. 1987, 19(3/4), 39-44.
- Abdelwahab, O.; El Nemr, A.; El-Sikaily, A.;Khaled, A.;UlvaLactuca, Chem. Ecol. 2009, 22, 253–266.
- El-Sikaily, A.;Khaled, A.; El Nemr, A.;Abdelwahab, O.;Ulvalactuca, Chem. Ecol. 2009, 22, 149–157.
- Ho, Y.S.; Chiang, T.H.;Hsueh, Y.M.; Process Biochem. 2005, 40, 119–124.
- Ozacar, M.;Engil, I˙.A. S.;Process Biochem. 2005, 40, 565–572.
- Akkaya, G. ;Uzun, I˙.; Guzel, F.; Dyes Pigments, 2007, 73, 168–177.
- Cooper, P.;Soc Dyers and Colorists, Alden Press,Oxford, 1995.
- Elnemr, A., Abdelwahab, O. ; El-sikaily, A.; khaled, A.; J. Hazard.Mater.2009, 161, 102-110.
- Hashemian,S.; Salimi,M.; Chem. Eng. J.2012, 188, 57-63.
- Hashemian, S.; Mirshamsi, M.;J. Indust. Eng. Chem. 2012, 18, 2010- 2015.
- Robinson, T.; Chandran,B.; Nigam, P.; Environ. Int.2002, 28, 29-33.
- Kazemipour,M.; Ansari,M.;Tajrobehkar,S.;Majdzadeh,M.;Kermani,H. R.;J. Hazard. Mater. 2008, 150 (2), 322-327.
- Attia,A. A.; Girgis, B. S.;Khedr,S. A.;J. Chem. Technol. Biotechnol.2003,78 (6), 611-619.
- Annadurai, G.; Juang,R. S.; Lee,D. J.;J. Hazard.Mater. B. 2002, 92, 263-274.
- Mohan,D.; Singh,K. P.;Sinha,S.; Gosh, D.; Carbon,2005, 43, 1680-1693.
- Sundaram,M. M.;Sivakumar, S.; J. Chem. Res.2012, 4(4), 2047-2054.[23]
- Wang, X. S.; Zhou,Y.; Jiang,Y.; Sun,C.;J. Hazard. Mater.2008, 157 (2–3), 374–385.
- Chen,S. H.;Zhang,J.; Zhang, C. L.; Yue,Q. Y.; Li,Y.; Li,C.;Desalination, 2010, 252,149-156.
- Mehrasbi,M. R.;Farahmandkia,Z.; Taghibeigloo, B.; Taromi,A.; Water Air Soil Pollut, 2009, 199, 343–351.
- Ozdes,D.;Gundogdu,A.; Duran,C.;Senturk, H. B.; Separ. Sci. Technol. 2010, 45, 2076–2085.
- Sahranavard,M.;Ahmadpour,A.;Doosti, M. R.; Eur. J. Sci. Res.2011, 58 (3), 392-400.
- Khaled, A.; Elnemr, A.; El-sikaily, A. ;Abdelwahab, O.; J. Hazard. Mater.2009, 165,100-110.
- Hashemian, S.; Salari, K.; Atashi, Z.; J. Indus. Eng. Chem. 2014, 20, 1892–1900.
- Mehrasbi, M. R.; Farahmandkia, Z. ; Taghibeigloo,B.l; Taromi, A.; Water Air Soil Pollut, 2009, 199, 343–351.
- Hashemian, S.; Salari, K.; Salehifar, H.; Atashi, Z.;J. Chem. Volume 2013, Article ID 283274, 10 pages, http://dx.doi.org/10.1155/2013/283274
- Hashemian,S; Inter. J. Phys. Sci. 2011, 6(27),6257-6267.
- Annadurai, G.; Juang, R. S.; Lee, D. J.; J.Hazard.Mater. B, 2002,92 ,263-274.
- Lagergren, S.; Handlingar,1898, 24, 1–39.
- Ho, Y. S.; McKay, G.; Wase, D. A. J.; Foster, C. F.;Ads. Sci. Technol. 2000, 18, 639–650.
- Ho, Y.S., McKay, G., Canadian J. Chem. Eng. 1998, 76, 822–827.
- Hashemian, S.; Salari, K.; Atashi, Z.; J. Indus. Eng. Chem.2014, 20, 1892–1900. 29

This work is licensed under a Creative Commons Attribution 4.0 International License.
![]()
A New Edition of Web of Science
Journal Impact Factor
2022: 0.5
Five Year: 0.8
Journal is Indexed in

Cabells Whitelist
![]()


