Validated Stability Indicating Liquid Chromatographic Method for Simultaneous Estimation of Dosulepin And Methylcobalamin in Combined Pharmaceutical Dosage Form
L. Shiva Kumar Reddy1*, Dr.S.L.N. Prasad Reddy2, G.Srinivas Reddy3
*1, 3Research Scholar, Department of Pharmaceutical sciences, Jawaharlal Nehru Technical University, Hyderabad Andhra Pradesh, INDIA 2Principal, Sanskruthi College of pharmacy, Ghatkesar, Hyderabad, Andhra pradesh, INDIA
DOI : http://dx.doi.org/10.13005/ojc/300340
Article Received on :
Article Accepted on :
Article Published : 01 Sep 2014
A novel stability indicating reversed-phase liquid chromatographic method has been developed and validated for simultaneous estimation of Dosulepin hydrochloride and Methylcobalamin in combined pharmaceutical dosage form. An Inertsil-ODS (250mmx4.6mmx5mic) column with mobile phase containing 0.02 % Orthophosphoric acid and Methanol (400:600 v/v) was used. The flow rate was maintained at 1.0 mL/min, column temperature was 30°C and effluents were monitored by using a photodiode array detector at 223 nm. The retention times of Dosulepin and Methylcobalamin were found to be 2.633 min and 3.794 min, respectively. Correlation co-efficient for Dosulepin and Methylcobalamin were found to be 0.99 and 0.99, respectively. The proposed method was validated with respect to linearity, accuracy, precision, specificity, and robustness. Recovery of Dosulepin and Methylcobalamin in formulations was found to be in a range of 97-103% and 97-103% respectively. Dosulepin hydrochloride and Methylcobalamin were also subjected to the stress conditions of oxidative, acid, base, hydrolytic, thermal and photolytic degradation. The degradation products were well resolved from and peak purity test results confirmed that Dosulepin and Methylcobalamin peaks were homogenous and pure in all stress samples, thus proving stability-indicating power of the method. Due to its simplicity, rapidness and high precision, this method can be applied for regular analysis.
KEYWORDS:Dosulepin; Methylcobalamin; Liquid chromatography; Method validation; Forced degradation
Download this article as:| Copy the following to cite this article: Reddy L. S K, Reddy S. L. N. P. , Reddy G. S. Validated Stability Indicating Liquid Chromatographic Method for Simultaneous Estimation of Dosulepin And Methylcobalamin in Combined Pharmaceutical Dosage Form. Orient J Chem 2014;30(3). |
| Copy the following to cite this URL: Reddy L. S K, Reddy S. L. N. P. , Reddy G. S. Validated Stability Indicating Liquid Chromatographic Method for Simultaneous Estimation of Dosulepin And Methylcobalamin in Combined Pharmaceutical Dosage Form. Orient J Chem 2014;30(3). Available from: http://www.orientjchem.org/?p=4510 |
INTRODUCTION
Dosulepin (INN), formerly known as dothiepin (BAN), is a tricyclic antidepressant (TCA). It is chemically 3-(dibenzo[b,e]thiepin-11(6H)-ylidene)-N,N-dimethylpropan-1-amine (Figure-I). It is sold under the brand names Prothiaden, Dothep, Thaden and Dopress. Dosulepin blocks the reuptake of serotonin and norepinephrine in the brain, thereby increasing their levels. It is believed that this action is responsible for its mood-elevating effects.
Methylcobalamin (mecobalamin, MeCbl, or MeB12) is a cobalamin, a form of vitamin B12. It differs from cyanocobalamin in that the cyanide is replaced by a methyl group. Methylcobalamin features an octahedral cobalt (III) centre (Figure 1). Methylcobalamin is equivalent physiologically to vitamin B12, and can be used to prevent or treat pathology arising from a lack of vitamin B12 (vitamin B12 deficiency), such as pernicious anemia. Methylcobalamin is also used in the treatment of peripheral neuropathy, diabetic neuropathy, and as a preliminary treatment for amyotrophic lateral sclerosis [1-2]. Chemical structures of Dosulepin and methylcobalamin are presented in Figure I.
A literature survey revealed few liquid chromatography (LC) assay methods that have been reported for the determination of Dosulepin hydrochloride in bulk dug and pharmaceutical dosage forms, but there are no reported methods for simultaneous estimation of Dosulepin hydrochloride and Methylcobalamin in combined pharmaceutical dosage forms [3-13].
The present International Conference on Harmonization (ICH) drug stability guidelines suggest that stress studies should be conducted on the drug product to establish its inherent stability characteristics, and the analytical method should able to separate all degradation impurities formed under stress studies to prove its stability-indicating power. In order to monitor possible changes to a product over time, the applied analytical chromatographic method must be stability-indicating. The best case for testing the suitability of a method is using real-time stability samples containing all relevant degradation products that might occur. But due to product development timelines, process characteristics, excipients, and other environmental factors, a forced degradation study (stress test) can serve as an alternative [14-19].
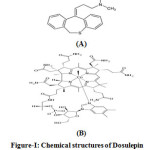 |
Figure1: Chemical structures of Dosulepin and methylcobalamin Click here to View Figure |
The aim of the present work is to focus on the development of an efficient stability indicating liquid chromatographic method for simultaneous estimation of Dosulepin hydrochloride and Methylcobalamin in combined pharmaceutical dosage form such as Tablets in presence of its excipients and degradation products in a short chromatographic run.
The present work concerns the method development, method validation and forced degradation studies of Dosulepin hydrochloride and Methylcobalamin in combined pharmaceutical dosage form. The developed Liquid Chromatographic method was validated with respect to specificity, limit of detection (LOD), limit of quantification (LOQ), linearity, precision, accuracy and robustness. Forced degradation studies were performed on the placebo and drug products to show the stability-indicating nature of the method. These studies were performed in accordance with established ICH guidelines.
EXPERIMENTAL
Instrumentation
Samples were analyzed on Waters alliance 2695 HPLC system (Waters Corporation, Milford, MA) equipped with a with binary HPLC pump, Waters 2998 PDA detector and Waters Empower2 software. The separation was achieved on Inertsil-ODS (250 mm x 4.6 mm x 5 µm) column.
Chemicals and Reagents
Dosulepin hydrochloride and Methylcobalmin standards were supplied by Dr. Reddy’s Laboratories Ltd., Hyderabad. Methanol of HPLC grade was purchased from E. Merck (India) Ltd., Mumbai. Orthophosphoric acid of AR grade was obtained from S.D. Fine Chemicals Ltd., Mumbai and milli Q water. Dosulepin hydrochloride and Methylcobalmin film coated tablets (Abott Laboratories: ProthiadenM) were procured from market.
HPLC Conditions
The mobile phase consisting of 0.2% v/v ortho phosphoric acid and methanol (HPLC grade) were filtered through 0.45 µm membrane filter before use, degassed and were pumped from the solvent reservoir in the ratio of 400:600 v/v into the column at a flow rate of 1.0 ml/min. The column temperature was maintained at 30°C. The detection was monitored at 223 nm and the run time was 8 minutes. The volume of injection loop was 10 µl prior to injection of the drug solution.
Preparation of standard solution
Accurately weighed quantity, 150.0 mg of Dosulepin hydrochloride and 3.0 mg of Methylcobalamin was transferred into 50 ml of volumetric flask and diluted to the volume with mobile phase. From this stock, 5 ml of solution was taken into a 10 ml volumetric flask and diluted to the volume with mobile phase (Concentration of Dosulepin : 0.15mg/ml, Concentartion of Methylcobamin : 0.03mg/ml).
Preparation of sample (drugs from marketed formulations) solution:
Twenty tablets were weighed and the average weight was calculated and crushed in to the fine powder, Tablet powder (Equivalent to two tablets) was transferred into 50 ml of volumetric flask and diluted to the volume with mobile phase. From this stock solution 5 ml was transferred into a 10 ml volumetric flask and diluted to the volume with mobile phase.(Concentration of Dosulepin : 0.15mg/ml, Concentartion of Methylcobamin : 0.03mg/ml).
Forced degradation studies
Forced degradation studies were performed at a 612 mg/mL concentration of Dosulepin hydrochloride and Methylcobalamin in tablets to provide an indication of the stability-indicating property and specificity of the proposed method. A peak purity test was conducted for Dosulepin hydrochloride and Methylcobalamin peaks by using a PDA detector on stress samples. All solutions used in forced degradation studies were prepared by dissolving the drug product in a small volume of stressing agents. After degradation, these solutions were diluted with mobile phase to yield a stated concentration approximately. Conditions employed for performing the stress studies are described below.
Acid degradation
Tablet powder equivalent to 612.20 mg was accurately weighed and dissolved in 5 ml of mobile phase, 5 ml 5 N HCl was added and the mixture was kept at 700C for 5 min. The solution was brought to ambient temperature, neutralized by the addition of 5 ml 5 N NaOH and diluted to 25 ml with mobile phase.
To prepare the blank, 5 mL of 5 N HCl and 5 mL of 5 N NaOH were diluted to 25 mL with mobile phase.
Base degradation
Tablet powder equivalent to 612.20 mg was accurately weighed and dissolved in 5 ml of mobile phase, 5 ml 5N NaOH was added and the mixture was kept at 700C for 5 min. The solution was brought to ambient temperature, neutralized by the addition of 5 ml 5 N HCl and diluted to 25 mL with mobile phase.
To prepare the blank, 5 mL of 5 N NaOH and 5 mL of 5 N HCl were diluted to 25 mL with mobile phase.
Oxidation degradation
Tablet powder equivalent to 612.20 mg was accurately weighed and dissolved in 5 mL of mobile phase, 5 mL of 3% hydrogen peroxide was added and the mixture was kept at 700C for 10 min. The solution was brought to ambient temperature and diluted to 25 mL with mobile phase.
To prepare the blank, 5 ml of 3% hydrogen peroxide was diluted to 25 mL with mobile phase.
Thermal degradation
Tablet powder equivalent to 612.20 mg was stored at 1050C for 9 h, dissolved and diluted to 25 mL with mobile phase.
Photolytic degradation
The susceptibility of the drug product to the light was studied; Tablet powder for photo stability testing was placed in a photo stability chamber and exposed to a white florescent lamp with an overall illumination of 1.2 million lux hours and near UV radiation with an overall illumination of 200 watt/m2/h at 250C. Following removal from the photo stability chamber, the sample was prepared for analysis as previously described.
RESULTS AND DISCUSSION
Method Development
The analytical procedure for the estimation of Dosulepin hydrochloride and Methylcobalamin in marketed formulation was optimized with a view to develop a precise and accurate assay method. Agilent Eclipse XDB (4.6*150mm*3.5mic), Agilent Zorbax C8 (4.6*150mm*5mic) and Inertsil-ODS (4.6*250mm*5mic) were used to provide an efficient separation but appropriate chromatographic separation was achieved on Inertstil-ODS (4.6*250mm*5mic). Various mobile phase systems were prepared and used to provide an appropriate chromatographic separation, but the proposed mobile phase containing 0.2% v/v Orthophoshoric acid: Methanol in the ratio of 400:600 (v/v) gave a better resolution. Using UV-visible PDA detector at 223 nm carried out the detection. Amongst the several flow rates tested, the flow rate of 1 ml/min was the best suited for both the drugs with respect to location and resolution of peaks. The retention time of Dosulepin and methylcobalmin was found to be 2.633 min and 3.794 min respectively. The chromatograms of standard and sample solution of Dosulepin hydrochloride and Methylcobalmin were shown in Figure II. The asymmetry factor of Dosulepin hydrochloride and methylcobalmin was 1.158 and 1.149 found to be respectively, which indicates symmetrical nature of the peak. The USP resolution of 7.957 was achieved between Dosulepin hydrochloride and methylcobalmin. The USP plate count of Dosulepin hydrochloride and methylcobalmin was 7190 and 8590 found to be respectively, which indicates column efficiency for separation. System suitability parameters such as Peak asymmetry, Resolution and Number of theoretical plates are meeting ICH requirements. The percentage label claim of individual drugs found in formulations were calculated and provided in Table I. The results of analysis shows that the amounts of drugs estimated were in good agreement with the label claim of the formulations [20-21].
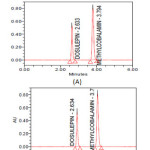 |
Figure2: Typical chromatograms of Dosulepin hydrochloride and Methylcobalamin (A) Standard (B) Formulation Click here to View Figure |
Table I: Assay results
|
sample |
Label claim (mg/tab) |
Amount present (mg/tab) |
%Label claim (%w/w) |
|
Dosulepin hydrochloride |
75 |
74.24 |
98.99 |
|
Methylcobalamin |
1.5 |
1.45 |
99.77 |
Method Validation
System Suitability Studies
System suitability was determined before sample analysis from duplicate injections of the standard solutions of Dosulepin hydrochloride and Methylcobalamin.The column efficiency, resolution and peak asymmetry were calculated for the standard solutions. Resolution between Dosulepin hydrochloride and Methylcobalamin peaks was found to be 7.957. USP tailing (Peak Asymmetry) for Dosulepin hydrochloride and Methylcobalamin were found to be 1.158 and 1.149 respectively. Number of theoretical plates (USP plate count) for Dosulepin hydrochloride and Methylcobalamin were found to be 7190 and 8590 respectively.
The values obtained demonstrated the suitability of the system for the analysis of this drug combinations, system suitability parameters may fall within ± 3 % standard deviation range during routine performance of the method [22, 23].
Specificity
Specificity is the ability to assess unequivocally the analyte in presence of components which may be expected to be present. Typically these might include impurities, degradants, matrix, etc. Placebo interference was evaluated by analyzing the placebo prepared by the test method. No peak due to placebo was detected at the retention time of Dosulepin hydrochloride and Methylcobalamin. The specificity of the developed method was also conducted in presence of its degradation products.
Precision
The precision of method was verified by repeatability and intermediate precision. Repeatability was checked by injecting six individual sample preparations of Dosulepin hydrochloride and Methylcobalamin tablets. Percent relative standard deviation (RSD) of the area for each drug was calculated. The intermediate precision of the method was also evaluated using different analysts and different instruments and performing the analysis on different days. The results of precision study are provided in Table II.
Accuracy
The accuracy of the method was determined by recovery experiments. The recovery studies were evaluated in triplicate using three concentration levels 50%, 100% and 150%. The percentage recovery data was obtained, added recoveries of standard drugs were found to be accurate (Table III & IV).
Linearity and Range
The linearity of the method was determined at five concentration levels (50%, 75%, 100%, 125% and 150%). Linearity test solutions were prepared by diluting the stock solutions to the required concentrations. The calibration curves were plotted between the responses of peak area versus concentration of analyte. The slope and intercept value for calibration curve was y = 16616 x (r2=0.99) for Dosulepin and y = 19288 x (r2=0.99) for Methylcobalamin. The result
(Table V) shows that an excellent correlation exists between areas and concentration of drugs within the concentration range. Calibration curves are presented in Figure III.
Table-II: Precision studies of Dosulepin and Methyl cobalamin
|
S. No |
Sample Wt |
Area of Dosulepin |
Area of Methylcobalmin |
% Assay of Dosulepin |
% Assay of Methylcobalamin |
|
1 |
612.20 |
2561486 |
5107686 |
99 |
100 |
|
2 |
612.20 |
2566264 |
5109813 |
99 |
100 |
|
3 |
612.20 |
2567259 |
5103460 |
99 |
100 |
|
4 |
612.20 |
2565597 |
5109276 |
99 |
100 |
|
5 |
612.20 |
2560401 |
5109631 |
99 |
100 |
|
6 |
612.20 |
2563067 |
5107125 |
99 |
100 |
|
Average |
99 |
100 |
|||
|
STD |
0.11 |
0.05 |
|||
|
%RSD |
0.11 |
0.05 |
|||
Table-III: Accuracy of Dosulepin
|
Spiked Level |
Sample Weight |
Sample Area |
µg/ml added |
µg/ml found |
% Recovery |
Mean |
|
50% |
306.10 |
1289463 |
742.500 |
748.53 |
101 |
100 |
|
50% |
306.10 |
1280085 |
742.500 |
743.09 |
100 |
|
|
50% |
306.10 |
1283479 |
742.500 |
745.06 |
100 |
|
|
100% |
612.20 |
2564970 |
1485.000 |
1488.96 |
100 |
100 |
|
100% |
612.20 |
2567326 |
1485.000 |
1490.33 |
100 |
|
|
100% |
612.20 |
2564724 |
1485.000 |
1488.82 |
100 |
|
|
150% |
918.30 |
3847770 |
2227.500 |
2233.63 |
100 |
100 |
|
150% |
918.30 |
3842991 |
2227.500 |
2230.86 |
100 |
|
|
150% |
918.30 |
3841600 |
2227.500 |
2230.05 |
100 |
Table-IV: Accuracy of Methylcobalamin
|
Spiked level |
Sample weight |
Sample Area |
µg/ml added |
µg/ml found |
% Recovery |
Mean |
|
50% |
306.10 |
2550202 |
15.000 |
14.95 |
100 |
100 |
|
50% |
306.10 |
2558483 |
15.000 |
15.00 |
100 |
|
|
50% |
306.10 |
2554898 |
15.000 |
14.98 |
100 |
|
|
100% |
612.20 |
5103632 |
30.000 |
29.92 |
100 |
100 |
|
100% |
612.20 |
5102094 |
30.000 |
29.91 |
100 |
|
|
100% |
612.20 |
5106737 |
30.000 |
29.93 |
100 |
|
|
150% |
918.30 |
7657401 |
45.000 |
44.89 |
100 |
100 |
|
150% |
918.30 |
7658443 |
45.000 |
44.89 |
100 |
|
|
150% |
918.30 |
7657613 |
45.000 |
44.89 |
100 |
Table-V: Linearity of Dosulepin and Methylcobalamin
|
Dosulepin |
Methylcobalamin |
||||||||
|
% Conc. |
Area |
ug/ml |
LOD |
LOQ |
% Conc. |
Area |
ug/ml |
LOD |
LOQ |
|
50 |
1288348 |
750 |
S/N |
1634 |
50 |
2556443 |
15 |
S/N |
31 |
|
75 |
1920207 |
1125.00 |
2.754 |
9.180 |
75 |
3827829 |
22.5 |
2.9032 |
9.6774 |
|
100 |
2563766 |
1500.00 |
100 |
5103999 |
30 |
||||
|
125 |
3206208 |
1875 |
125 |
6377989 |
37.5 |
||||
|
150 |
3844192 |
2250 |
150 |
7659637 |
45.00 |
||||
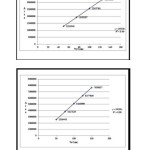 |
Figure3: Linearity graphs of Dosulepin and methyl cobalamin Click here to View Figure |
Limit of detection & Limit of quantification (LOD & LOQ):
Limit of quantification and detection were predicted by plotting linearity curve for different nominal concentrations of Dosulepin and Methylcobalamin (Table V). Relative standard deviation (σ) method was applied, the LOQ and LOD values were predicted using following formulas. Precision was established at these predicted levels.
(a) LOQ = 10 σ / S
(b) LOD = 3.3 σ / S
Where σ = residual standard deviation of response
S = slope of the calibration curve.
LOQ and LOD values for Dosulepin and methylcobalamin were found to be 9.180, 2.754 and 9.677, 2.903 respectively.
Robustness
Robustness of the method was determined by making slight changes in the chromatographic conditions and system suitability parameters for Dosulepin hydrochloride Methylcobalamin standard and the resolution, USP Tailing and USP Plate count were recorded. The variables evaluated in the study were column temperature (±50C), flow rate (±0.2 mL/min). It was observed that there were no marked changes in the chromatograms, which demonstrates that the method developed is rugged and robust (Table VI & VII).
Table-VI: Robustness of Dosulepin
|
Sample Name |
Rt |
Area |
USP Tailing |
USP Plate count |
S/N |
|
TEMP-1 |
2.578 |
3877749 |
1.183 |
6769 |
464.05 |
|
TEMP-2 |
2.562 |
3646231 |
1.185 |
7342 |
472.87 |
|
FLOW-1 |
3.005 |
5268944 |
1.179 |
7848 |
599.76 |
|
FLOW-2 |
2.268 |
3675385 |
1.176 |
6222 |
499.61 |
Table-VII: Robustness of Methyl cobalamin
|
Sample Name |
Rt |
Area |
USP Tailing |
USP Plate count |
S/N |
|
TEMP-1 |
3.897 |
7425147 |
1.177 |
7989 |
635.11 |
|
TEMP-2 |
3.802 |
6964485 |
1.174 |
8811 |
670.73 |
|
FLOW-1 |
4.548 |
10059395 |
1.171 |
8911 |
816.17 |
|
FLOW-2 |
3.433 |
7024245 |
1.193 |
7317 |
688.34 |
Forced Degradation Studies
Based on the results of the stress studies, the degradation behavior of Dosulepin hydrochloride and Methylcobalamin is as follows.
Acid degradation
Dosulepin and Methylcobalamin were undergoing degradation in 5 N HCl at 700C for 10 min moderately. The impurities formed during this study are well separated from main drug peaks and mass balance is found to be in acceptable limit. Peak purity of drugs also matches (Table VIII, Figure IV (A).
Base degradation
Dosulepin and Methylcobalamin were found to be slightly unstable in 5 N NaOH at 700C for 5 min. The major degradation peaks are well separated from drug peaks and well resolved. Mass balance is found to be in acceptable limit. Peak purity of drugs also matches (Table VIII, Figure IV (B).
Oxidation degradation
Dosulepin and Methylcobalamin were found to be slightly unstable under conditions of 3% hydrogen peroxide at 700C for 10 min. The major impurities in the study were resolved with drug peaks. Mass balance is found to be in acceptable limit. Peak purity of drugs also matches (Table VIII, Figure IV (C).
Thermal degradation
Dosulepin and Methylcobalamin were found to be stable to thermal exposure. Partial degradation was take place. Impurities formed well resolved from main drug peaks.
Table-VIII: Degradation studies for Dosulepin and Methylcobalamin
|
Stress condition |
Sample weight |
Dosulepin |
Methylcobalamin |
||||
|
Area |
% Assay |
% Deg. |
Area |
% Assay |
% Deg. |
||
|
Acid |
612 |
2434079 |
94 |
5 |
4662402 |
91 |
9 |
|
Base |
612 |
2429039 |
94 |
5 |
4843956 |
95 |
5 |
|
Peroxide |
612 |
2421056 |
94 |
5 |
4759184 |
93 |
7 |
|
Heat |
612 |
2470776 |
96 |
3 |
4979080 |
98 |
2 |
|
Light |
612 |
2468072 |
95 |
4 |
4977156 |
98 |
2 |
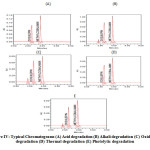 |
Figure4: Typical Chromatograms (A) Acid degradation (B) Alkali degradation (C) Oxidative degradation (D) Thermal degradation (E) Photolytic degradation Click here to View Figure |
Mass balance is found to be in acceptable limit. Peak purity of drugs also matches (Table VIII, Figure IV (D).
Photolytic degradation
Upon subjecting the Dosulepin and methylcobalamin sample to both UV and visible light, only partial degradation of was observed. Testing of a placebo containing preservative leads to formation of number of different impurities with respect to an unstressed placebo. The amount of preservative decreased mainly by influence of oxidation, light and acid. Mass balance of preservative shows almost 100%. The active ingredients remain almost stable within tested period and mass balance matches (Table VIII, Figure IV (E).
CONCLUSION
The proposed HPLC method for the simultaneous estimation of Dosulepin hydrochloride and Methylcobalamin in pharmaceutical dosage forms was found to be simple, sensitive, precise, accurate, linear, robust and rugged during validation. Further this method is stability indicating and can be used for routine analysis of production samples .Hence, this method can easily and conveniently adopt for routine quality control of Dosulepin hydrochloride and Methylcobalamin in pure and its pharmaceutical dosage forms.
ACKNOWLEDGEMENT
Authors are thankful to Department of Pharmaceutical Sciences, Jawaharlal Nehru Technological University, Hyderabad and Rainbow Pharma training lab, Kukatpally, for providing instruments and analytical support. Authors are also thankful to Dr.Reddy’s Laboratories Ltd. for providing Dosulepin hydrochloride and Methylcobalamin standards as gift samples.
REFERENCES
- Sweetman, S. C., (ed), Martindale, The Complete Drug Reference, 37th ed., The pharmaceutical press, London, 2011.
- Budavari, S, (ed), The Merck Index, 13th ed. NJ: Merck & Co, Inc; Whitehouse station, 2006.
- Pawlak, Z., Clark, B.J. J. Pharm. Biomed. Anal. 1989, 7, 1903-1907.
- Kawahara, K., Awaji, T., Uda, K., Sakai, Y. J. Pharm. Biomed. Anal. 1987, 5, 183–189.
- Sameer, A., Abdulrahman, M., Basavaiah, K., Cijo, M. X., Vinay, K. B. J. Appl. Spectrosc. 2012: 79, 780-787.
- Walash, M. I., Belal, F., El-Enany, N., Elmansi, H. Int. J. Biol. Sci. 2010: 6, 327-34.
- Abdel Ghani, N. T. A., El-Nashar, R.M., Bioumy, A.A. Analyt. Lett. 2004, 37, 3237–3254.
- Taha, E. A., Soliman, S.M., Abdellatef, H.E., Ayad, M.M. Mikrochim. Acta. 2002, 140, 175–182.
- Taha, E.A. Anal. Bioanal. Chem. 2003, 376, 1131–1136.
- Taylor, P. J., Charles, B.G., Norris, R., Salm, P., Ravenscroft, P.J. J Chrom B Biomed Sci Appl. 1992, 581, 152–155.
- Saravanan, J., Shajan, A., Joshi, N.H., Varatharajan, R., and Valliappan, K. A. Int. J. Che. and Pharm., 2010: 1, 13-16
- ICH (Q2 (R1); Validation of Analytical Procedures: Text and methodology. International Conference on Harmonization, Geneva, (2005).
- ICH, Q6A; Specifications: Test Procedures and Acceptance Criteria for New Drug Substances and New Drug Products: Chemical Substances, Geneva, (1999)
- FDA, Guidance for Industry on Analytical Procedures and methods Validation Chemistry, Manufacturing, and Controls Documentation (draft), Rockville, MD, (2000).
- ICH, Q1A (R2) Stability Testing of New Drug Substances and Products, International Conference on Harmonization, Geneva, (2003).
- ICH, Q1B Stability Testing: Photostability Testing of New Drug Substances and Products, International Conference on Harmonization, Geneva, (1996).
- Maheshwaran, R., FDA Perspectives: Scientific Considerations of Forced Degradation Studies in ANDA Submissions, Pharmaceutical Technology, 2012: 36, 73-80.
- Snyder, L.R., Introduction to modern liquid chromatography, 3rd Ed., Wiley, Newyork, (2010).
- Snyder, L.R., Kirkland, J.J., Glajch, J.L., Practical HPLC Method Development, 2nd ed., Wiley, New York, (1997).
- United States Pharmacopeial convention: United States Pharmacopoeia 36; National Formulary 31, US Pharmacopoea Convention, Rockville, MD, (2013).
- European Pharmacopeia 7.0, European Directorate of Quality Medicine.

This work is licensed under a Creative Commons Attribution 4.0 International License.
![]()
A New Edition of Web of Science
Journal Impact Factor
2022: 0.5
Five Year: 0.8
Journal is Indexed in

Cabells Whitelist
![]()


