Ultra-Trace Determination of Methyl Carbamate and Ethyl Carbamate in Local Wines by GC-FID Following Pre concentration with C18-SPE
DOI : http://dx.doi.org/10.13005/ojc/300313
Download this article as:
![]()
An analytical method is described for ultra-trace determination of methyl carbamate and ethyl carbamate in locally produced fruit wines. The quantitative analysis involves with dichloromethane extraction followed by 30-fold preconcentration using C18 SPE prior to measurement by capillary GC-FID. Under the optimized conditions, a good linearity of their calibration curves was obtained in the range of 0.1-50.0 mg/L with r2 > 0.994. LOD and LOQ were 3.3-16.7 µg/L and 11.1-55.6 µg/L, respectively. The averaged recovery of these carbamates was ranged of 82.2-95.2% with RSD < 8.76%. The procedure was applied to determine both carbamate residues in various local wine samples. It was found that the concentration range of methyl carbamate (6.9-24.1 µg/L) was rather fluctuated and higher than that of ethyl carbamate (2.6-4.3 µg/L), suggesting that is a certain residual background contamination naturally occurring in the wine fermentation.
KEYWORDS:Methyl carbamate; Ethyl carbamate; Wine; Preconcentration; Solvent extraction; Solid-phase extraction; Gas chromatography
INTRODUCTION
Ethyl carbamate, commonly called urethane, occurs naturally in most fermented foods and beverages1-19. Previous studies indicate that urea is the main precursor and that it reacts with ethanol under specific conditions to form ethyl carbamate during wine ageing and storage20. Due to its carcinogenic effects in humans, maximum allowable levels in beverages were set by the United States (recommended only) and Canada (30 mg/L for table wines; 100 mg/L for ports and sherries; 150 mg/L for distilled spirits; and 400 mg/L for fruit brandies, cordials, and liqueurs). The determination of ethyl carbamate in alcoholic beverages faces some difficult problems due to its low concentration and also high matrix interferences. Most of the reported methods for ethyl carbamate analysis employ solid-phase extraction, liquid-liquid extraction and preconcentration prior to gas chromatographic separation21,22. Some methods still include an additional extraction cleanup step4,15. Ethyl carbamate detection is usually performed by mass spectrometry1-4,7,8,15, either on electron or chemical ionization23,24. Other detection techniques such as Hall electrolytic conductivity detection and thermal energy analyzer in nitrogen detection have also been applied25,26. GC-FTIR was selectively applied to determine ethyl carbamate in alcoholic beverages and foods 17. HPLC with fluorescence detection of ethyl carbamate in samples was also carried out13.
Concerning on pesticide residues in agricultural fields and their products, one may focus to pay attention on such local vegetables and fruits that are subject to provide raw material for food and beverage production, possibly originated from water consumption and/or wastewater drainage27-32. Besides, naturally occurring ethyl carbamate, cyanide conversion into ethyl carbamate can be catalyzed by Cu(II) 29. Ethyl carbamate precursor is known to be genetically related lactic acid bacteria12. However, trace amount of methyl carbamate residue in those samples is still limited. Thus, an analysis of both carbamates in commercially available wine products would be an important subject for quality control of such alcoholic beverages consuming worldwide.
The aim of this study was to determine both methyl carbamate and ethyl carbamate residues in local Thai wines using a simple but reliable technique that may be easily used in laboratories with a large throughput of samples. Since the amount of the carbamates residues in wine is in ultra-trace level, solvent extraction with dichloromethane for the selectivity of analyte and followed by C18 solid-phase extraction for the preconcentration was carried out prior to separation by GC-FID. Method validations of the extraction and separation procedures were also investigated.
MATERIALS AND METHODS
Chemicals
The standard compounds of methyl carbamate and ethyl carbamate both analytical grade were from Sigma Aldrich (USA). Dichloromethane, diethyl ether, methyl alcohol, t-butanol (used as internal standard) and sodium sulfate all analytical grade were purchased from Carlo Erba (Italy). Ethyl acetate and hexane were also analytical grade from Lab Scan (Thailand). Solid-phase cartridge (Vertical C-18, 500 mg) was used. Deionized water was obtained by using Milli-Q water purification system from Millipore (Massachusetts, USA).
Instruments
The quantitative analysis of both carbamates in the extracts of wine samples was conducted by GC–FID (Trace GC 2000, Thermo Finnigan, Italy). The capillary column was DB-5 (30 m × 250 μm i.d., 0.25 μm film thickness). Helium was used as carrier gas at a flow rate of 1 mL/min. The column temperature program was investigated in details including split ratio of the injection port and carrier gas flow rate. Other operating conditions used were as follows: injection temperature 150°C, detector temperature 250°C and injection volume 1 μL. Other instruments including pH meter (Denver Instrument model 251, USA), centrifuge machine (Hermle Z300, Germany), rotary evaporator (Büchi rotary R-200, Germany), analytical balance (Sartorius AC211S, Germany) and drying oven (Fisher Scientific, Australia) were also used.
Wine samples
Wine samples, both white and red wines, locally produced from various kinds of typical Thai fruits and herbal plants were purchased from supermarkets and the “OTOP” (One Tumbon One Product) centre in Khon Kaen and other provinces in Thailand including five samples of selected white wines: green grape wine, pineapple wine, lychee wine, pandanus leave wine and rice grain wine, and five samples of selected red wines: red grape wine, roselle flower wine, Thai herbal plant Krashine-dum wine), Thai blueberry fruits Mao wine, and strawberry wine.
Sample preparation
Extraction of methyl carbamate and ethyl carbamate residues from the selected wine samples was carried out. This procedure was based on liquid-liquid extraction (LLE) followed by cleanup and preconcentration with solid-phase extraction (SPE). In the first step, the optimum conditions for LLE were investigated in detail including the effects of solvent type (hexane, diethyl ether, dichloromethane (DCM) and ethyl acetate), volume of the solvent used (5-20 mL), sample volume (5-50 mL), extraction time (5-60 min) and concentration of NaCl (1-20%, m/v). Next, SPE (C18; 500 mg, 3 mL) was performed by using 3 mL of dichloromethane used for sample elution. Finally, 1 mL of the extract was filtered through 0.45 µm nylon membrane prior to injecting into GC-FID.
Method validation
Linearity was investigated from the calibration plots of standard mixtures of methyl carbamate and ethyl carbamate. All standard mixtures were prepared by dilution of stock standard solution. Limit of detection (LOD) and limit of quantitation (LOQ) were investigated by linear regression. Linear least-squares regression parameters were calculated based on the analysis of ten replicates of both carbamates at five different concentration levels.
The precision of the proposed method was presented as the repeatability and reproducibility of retention time and peak area. For intra-day precision, the standard mixtures of methyl carbamate and ethyl carbamate were analyzed in five replicates within a day. For inter-day precision, the standard mixtures of methyl carbamate and ethyl carbamate were analyzed in five replicates for three different consecutive days.
RESULTS AND DISCUSSION
Optimum conditions for solvent extraction and solid-phase extraction
Since wine samples contained high total solids contents as their matrix effect which can be obscured or interfered the analyte target, particularly at ultra-trace level, in the sample pretreatment prior to determination by GC-FID. Some experimental parameters including type of organic solvent, volume of the extraction solvent, sample volume, extraction time, salt concentration, and volume of the elution solvent for sample cleanup/preconcentration were thus optimized consequently in details using real wine sample as a model for both solvent extraction and solid-phase extraction/preconcentration.
Effect of organic solvents
Four kinds of organic solvents with different polarity including hexane, diethyl ether, dichloromethane (DCM) and ethyl acetate were an alternative choice of the common extraction solvents used in this study. It was found that, besides hexane and diethyl ether, both of DCM and ethyl acetate gave rather high peak area ratios of methyl carbamate (MC) and ethyl carbamate (EC) with similar results as shown in Fig. 1. However, ethyl acetate was known as one of major aroma constituents commonly found in wine samples, at which still appeared in GC chromatogram (data not shown). Thus, DCM was used as the extraction solvent.
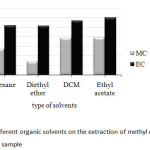 |
Fig1: Effect of different organic solvents on the extraction of methyl carbamate and ethyl carbamate in wine sample Click here to View Figure |
Effect of volume of the extraction solvent
For 25 mL of wine sample, the effect of volume of DCM was varied between 5 and 25 mL while other conditions were kept constant. Figure 2 shows that an increasing of the volume of the extraction solvent between 5 mL and 20 mL resulted in higher peak area ratios of both MC and EC, except for 25 mL of DCM their response signal decreased. Therefore, using 20 mL of dichloromethane could be suitable extraction solvent and was used for further study.
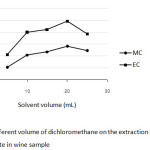 |
Fig2: Effect of different volume of dichloromethane on the extraction of methyl carbamate and ethyl carbamate in wine sample Click here to View Figure |
Effect of sample volume
In contrary, the effect of sample volume of wine was also investigated between 5 mL and 50 mL when using 20 mL DCM as the extraction solvent. It was found that the optimum sample volume, expressed as the peak area ratio in this case, was about 25 mL for both kinds of the carbamates (Fig. 3).
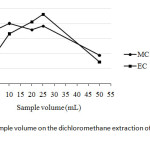 |
Fig3: Effect of sample volume on the dichloromethane extraction of methyl carbamate and ethyl carbamateClick here to View Figure |
Effect of the extraction time
The extraction time by using any extraction technique is one important factor to be concerned, since it mostly affects directly to remove all the target analytes from the sample matrices. In this study, the extraction time was varied between 5 and 60 min as shown in Fig. 4. It was clearly shown that the extraction time of 15 min was the suitable choice as fast step as for the optimum conditions.
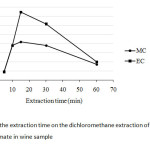 |
Fig4: Effect of the extraction time on the dichloromethane extraction of methyl carbamate and ethyl carbamate in wine sample Click here to View Figure |
Effect of the salt concentration
In any separation between two kinds of nonpolar and polar solvents, the ionic strength of the electrolyte in aqueous phase depends on salt concentration. Thus, to get better separation it is needed to try to use NaCl as a common salt. As shown in Fig. 5, 10% (m/v) NaCl was chosen at which it give rising of the peak area ratio of ethyl carbamate, while that of methyl carbamate kept no change in its response.
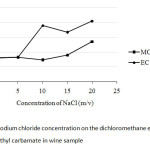 |
Fig5: Effect of sodium chloride concentration on the dichloromethane extraction of methyl carbamate and ethyl carbamate in wine sample Click here to View Figure |
Effect of volume of the elution solvent
For SPE, the elution volume of the solvent used was also studied according to get the highest preconcentration factor of both the analytes. Since it was aimed to find out at ultra-trace level of the carbamate residues in wine samples, the experimental trial was conducted with C18-SPE with a minimal eluate between 1 mL and 10 mL of DCM (Fig.6). It was found that 3 mL of DCM was practically chosen in this study due to rather high peak area ratios of both the carbamates.
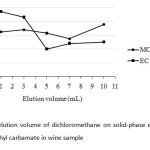 |
Fig6: Effect of elution volume of dichloromethane on solid-phase extraction of methyl carbamate and ethyl carbamate in wine sample Click here to View Figure |
Optimum conditions for GC-FID
Although the separation by GC is based on volatile property of the analyte, the column temperature program of these carbamates and its internal standard (I.S.), t-butyl alcohol, should be carried out between 50 °C and 220 °C (Table 1). It was found that single gradient temperature from 50 to 100 °C with 8 °C/min ramp rate was a suitable condition, resulting in a reasonable analysis time within 10 min. While other temperature ranges did not give good high resolution between methyl carbamate and I.S. used. Since capillary GC always limits its injection volume of sample (1 µL), the effect of split ratio of the injection port ranging from 10:1, 30:1, and 60:1 is also optimized as well (Table 2) . At the split ratio of 30:1 the peak area ratios of MC and EC were rather higher than the other ones. Thus, the higher peak area ratio was obtained, the better accuracy and precision was a subject to perform the method validation. In addition, an analysis time of the separation by GC can be minimal, if flow rate of the carrier gas is controlled to deal with linear velocity of the analytes. Thus, the flow rates higher than 1.0 mL/min i.e. 1.5, 2.0 and 2.5 mL/min were also performed (Table 3). It was found that the resolution between methyl carbamate and I.S. was not well done even though it gave shorten the last peak, ethyl carbamate, within about 6 min.
The operating conditions of GC-FID were thus ready to run with reliable and accuracy output which consisted of the split ratio, 30:1; 1 µL injection volume; temperature programming from 50°C for 5 min; 8°C/min to 100°C for 1 min with injector temperature, 150°C; detector temperature, 250°C; helium gas for the carrier gas with flow rate 1.0 mL/min. The optimum GC operating conditions are shown in Table 4. Under the optimized conditions of LLE and SPE, the analytical separation of methyl carbamate (MC) and ethyl carbamate (EC) by GC-FID was achieved within 10 min. The retention times of MC, t-butanol as internal standard (I.S.) and EC were 6.11, 6.40 and 8.36 min, respectively, (GC chromatogram not shown).
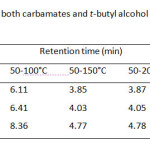 |
Table1: Retention time of both carbamates and t-butyl alcohol as I.S. with different column temperature programs Click here to View table |
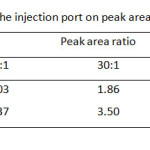 |
Table2: Effect of split ratio of the injection port on peak area ratio of both carbamates Click here to View table |
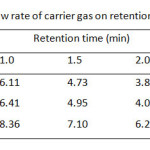 |
Table3: Effect of different flow rate of carrier gas on retention time of the compounds used Click here to View table |
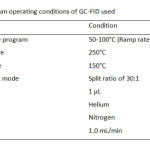 |
Table4: The optimum operating conditions of GC-FID used Click here to View table |
Analytical figures of merit
For quantitation analysis of both MC and EC by GC-FID after the preconcentration method with C-18 SPE, the method validation including selectivity, linearity, precision and accuracy was investigated. Precision of the proposed method gave the relative standard deviation (%RSD) less than 0.5 and 9.0 for retention time and peal area, respectively (Table 5). Linearity of calibration curve was extensively wide over range from 0.1 to 50.0 mg/L with the correlation coefficient greater than 0.994. Limits of detection and quantitation of MC and EC were found to be 3.3-16.7 µg/L and 11.1-55.6 µg/L (Table 6) expressed as an analytical signal three times and ten times of the standard deviation of background signal, respectively. The recoveries of real samples were found in the range of 82-95% (Table 7). The proposed method was successfully applied to determine methyl carbamate and ethyl carbamate in local wine samples at ultra-trace level (Table 8).
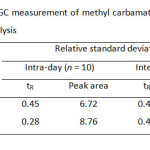 |
Table5: Precision for the GC measurement of methyl carbamate and ethyl carbamate for intra-day and inter-day analysis Click here to View table |
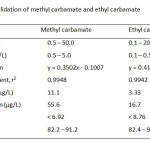 |
Table6: Method validation of methyl carbamate and ethyl carbamate Click here to View table |
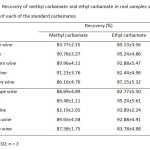 |
Table7: Recovery of methyl carbamate and ethyl carbamate in real samples spiked with 200 µg/L of each of the standard carbamates Click here to View table |
Mean ± RSD; n = 3
This procedure was based on liquid-liquid extraction (LLE) followed by cleanup and preconcentration with solid-phase extraction (SPE). In the first step, LLE was done under the optimum conditions: kind of solvent for extraction (dichloromethane), volume of solvent (20 mL), sample volume (25 mL), extraction time (15 min) and concentration of NaCl in salting out (10% m/v). Next, SPE (C18; 500 mg, 3 mL) was performed by using 3 mL of dichloromethane used for sample elution. Finally, 1 mL of the extract was filtered through 0.45 µm nylon membrane prior to injecting into GC-FID.
In the present study, liquid-liquid extraction in association with solid-phase extraction method for the analysis of methyl carbamate and ethyl carbamate in local Thai wine samples by GC-FID was carried out. The GC-FID system was used in order to achieve the optimum conditions for simple and rapid determination of trace amounts of the carbamate compounds. Under the optimized extraction conditions, the sample pretreatment method was accounted as preconcentration factor of 30-fold, even if the contents of methyl carbamate was still not detectable. The obtained results are shown in Table 8.
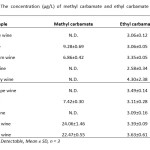 |
Table8: The concentration (µg/L) of methyl carbamate and ethyl carbamate in wine samples |
N.D.: Not Detectable, Mean ± SD, n = 3
CONCLUSION
In conclusion, both of methyl carbamate and ethyl carbamate are important organic compounds commonly found in the fermentation process of wine, besides other compounds including trace metals and pesticides were also occurred as background contamination at trace and/or ultra-trace level. Therefore, their quality control of these compounds particularly the carbamates must be done being either in the standard level or not excess the maximum residue limits (MRLs) of wine. In this study, the contents of both carbamates in these local wine samples were still found less than the standard level of MRLs (200 µg/L for carbamate in wine).
ACKNOWLEDGEMENTS
This study was financially supported by the Centre for Innovation in Chemistry (PERCH-CIC), Commission on Higher Education, Ministry of Education, Thailand and the Hitachi Scholarship Foundation, Tokyo, Japan.
REFERENCES
- Cairns, T.; Siegmund, E.G.; Luke, M.A.; Doose, G.M. Anal. Chem. 1987, 59, 2055-2059
- Clegg, B.S.; Frank, R. J. Agric. Food Chem. 1988, 36, 502-505
- Brumley, W.C.; Canas, B.J.; Perfetti, G.A., Mossoba, M.M.; Sphon, J.A.; Corneliussen, P.E. Anal. Chem. 1988, 60, 975-978
- Fernandez, M.; Pico, Y.; Manes, J. J. Chromatogr. A 2000, 871, 43-56
- Labanca, R.A.; Gloria, M.B.A. J. Agric. Food Chem. 2008, 56, 5211-5215
- Esti, M.; Fidaleo, M.; Moresi, M.; Tamborra, P. J. Agric. Food Chem. 2007, 55, 2590-2596
- Sen, N.P.; Seaman, S.W.; Weber, D. Food Additive Contamin. 1992, 9(2), 149-160
- Sen, N.P.; Seaman, S.W.; Boyle, M.; Weber, D. Food Chem. 1993, 48(4), 359-366
- Lachenmeier, D.W.; Lima, M.C.P.; Nobrega, I.C.C.; Pereira, J.A.P.; Kerr-Correa, F.; Kanteres, F.; Rehm, J. BMC Cancer 2010, 10, 266-280
- Lachenmeier, D.W.; Kanteres, F.; Kuballa, T.; Lopez, M.G.; Rehm, J. Int. J. Environ. Res. Public Health 2009, 6, 349-360
- Lachenmeier, D.W.; Hoang Anh, P.T.; Popova, S.; Rehm, J. Int. J. Environ. Res. Public Health 2009, 6, 2090-2101
- Araque, I.; Gil, J.; Carrete, R.; Bordons, A.; Reguant, C. J. Agric. Food Chem. 2009, 57, 1841-1847
- Santos, P.H.; Bastos, M.; Barros, P.; Alves, A. J. Food Sci. 2002, 67(5), 1616-1620
- Hasnip, S.; Crews, C.; Potter, N.; Christy, J.; Chan, D.; Bondu, T.; Matthews, W.; Walters, B.; Patel, K. J. Agric. Food Chem. 2007, 55, 2755-2759
- Jagerdeo, E.; Dugar, S.; Foster, G.D.; Schenck, H. J. Agric. Food Chem. 2002, 50, 5797-5802
- Walker, G.; Winterlin, W.; Fouda, H.; Seiber, J. J. Agric. Food Chem. 1974, 22 (6), 944-947
- Mossoba, M.M.; Chen, J.T.; Brumley, W.C.; Page, S.W. Anal. Chem. 1988, 60, 948-950
- Matsudo, T.; Aoki, T.; Abe, K.; Fukuta, N.; Higuchi, T.; Sasaki, M.; Uchida, K. J. Agric. Food Chem. 1993, 41(6), 352-356
- Ough, C.S. J. Agric. Food Chem. 1976, 24(2), 323-328
- Stevens, D.F.; Ough, C.S. Am. J. Enol. Vitic. 1993, 44, 309-312
- Canas, B.J.; Joe Jr, F.L.; Diachenko, G.W.; Burns, G. J. Assoc. Off. Anal. Chem. Int. 1994, 77, 1530-1536
- Ma, Y.-P.; Deng, F.-Q.; Chen, D.-Z.; Sun, S.-W. J. Chromatogr. A 1995, 695, 259-265
- Breme, K.; Fernandez, X.; Meierhenrich, U.J.; Brevard, H.; Joulain, D. J. Agric. Food Chem. 2007, 55, 1932-1938
- Crespo-Corral, E.; Santos-Delgado, M.J.; Polo-Diez, L.M.; Sanz-Perucha, J. J. Chromatogr. A 2006, 1132, 241-247
- De Melo Abreu, S,; Alves, A.; Oliveira, B.; Herbert, P. Anal. Bioanal. Chem. 2005, 382(2), 498-503
- Dyer, R.H. J. Assoc. Off. Anal. Chem. Int. 1994, 77, 64-67
- Saraji, M.; Esteki, N. Anal. Bioanal. Chem. 2008, 391, 1091-1100
- Alvarez-Rodriguez, L.; Monferrer-Pons, L.I.; Esteve-Romero, J.S.; Garcia-Alvarez-Coque, M.C.; Ramis-Ramos, G. Analyst 1997, 122, 459-463
- Aresta, M.; Boscolo, M.; Franco, D.W. J. Agric. Food Chem. 2001, 49, 2819-2814
- Zang, S.; Li, C.; Song, S.; Feng, T.; Wang, C.; Wang, Z. Anal. Methods 2010, 2, 54-62
- Crespo-Corral, E.; Sanos-Delgado, M.J.; Polo-Diez, L.M.; Soria, A.C. J. Chromatogr. A 2008, 1209, 22-28
- Guengerich, F.P.; Kim, D.-H. Chem. Res. Toxicol. 1991, 4, 413-421


![]()


