Electrochemical Behavior Of Copper Electrode In Potassium Sulfide Solutions
I. Zaafarany¹ and H. Boller²
¹Department of Chemistry, Faculty of Applied Science, Umm Al-Qura University, P.O.Box: 118 Makkah Al-Mukaramha, Saudia Arabia.
²Institute of Inorganic Chemistry, Johannes-Kepler-UniversiHit Linz,A-4040 Linz, Austria
DOI : http://dx.doi.org/10.13005/ojc/300309
Article Received on :
Article Accepted on :
Article Published : 25 Sep 2014
The electro chemical behavior of copper electrode in 2M potassium sulfide solution was studied using cyclic voltammograms and potentiostatic polarization techniques. The morphology studies were applied using scanning electron microscope (SEM) and energy dispersive analysis of X-rays (EDAX) and X-ray powder diffraction. Three anodic peaks were observed in the anodic scan of cyclic voltammograms. SEM and EDAX analysis show the formation of an anodic copper sulfide layer on the surface of copper. Chemical sulfidization of the copper shown to be an important layer growth pathway. The sulfide layers do not passivate copper and the formation of passivating oxide layer is suppressed. The sulfide layer on copper has a Cu2S stoichiometry with roxybyite and digenite structure and it grows by a nucleation. A small patches were consistent with a CuS composition. The formation of KCu7S4 or any other ternary compound could not be observed. Only a presumable polysulfide phase very similar to KCuS4 could be detected.
KEYWORDS:Copper; potassium sulfide; Electrochemistry
Download this article as:| Copy the following to cite this article: Zaafarany I, Boller H. Electrochemical Behavior Of Copper Electrode In Potassium Sulfide Solutions. Orient J Chem 2014;30(3). |
| Copy the following to cite this URL: Zaafarany I, Boller H. Electrochemical Behavior Of Copper Electrode In Potassium Sulfide Solutions. Orient J Chem 2014;30(3). Available from: http://www.orientjchem.org/?p=5087 |
Introduction
Copper has been one of the preferred materials in industry owing to its excellent electrical and thermal conductivities, good mechanical work ability and relatively noble properties. It is commonly used as a material in heating and cooling system. There are several authors studied the electrochemical behavior of copper in alkaline environments [1-8] but there is lack to study the electrochemical behavior of copper in potassium sulfide solutions.
The ternary K-Cu-S system presents a rich structural chemistry that merits intensive experimental and theoretical studies of transport phenomena of low, dimensional solids [9]. In the potassium copper I. sulfide system, not counting polysulfides, the known phases include KCuS [10], KCu4S3 [11], K3Cu8S6 [12], KCu3S2 [13] and KCu7S2 [14]. All of these phases, are structurally wellcharacterized by single crystal X-ray diffraction methods. The KCuS structure consists of one-dimensional Cu-S chains while KCu4S3, K3Cu8S6 and KCu3S2 exhibit two dimensional Cu-S layer.
The KCu7S4 lattice is composed of three-dimensional Cu-S framework which contains pseudo one dimensional channels in which the K+ cations reside.
The present work aims to study the electrochemical behavior of copper electrode in potassium sulfide solutions using cyclic voltammogram and potentiostatic polarization techniques. The film formed was investigated by scanning electron microscope (SEM) and energy dispersive analysis of X-ray (EDAX).
Experimental
The working copper electrode was prepared from high purity (99.98o/o) copper rod. A small piece of copper rod, diameter 6 mm, length 6 mm was placed in a “Kel-F” shielf, secured by epoxy resin. The bottom electrode was screwed onto a polyethylene holder with a contact wire in order to obtain good electrical contact. The electrodes are successively abraded with finest grade emery paper and degressed with acetone. Complete wetting of the surface was taken as indication of its cleanliness, when rinsed with hi-distilled water. All chemicals used were of A.R. quality. The solutions were prepared using hi-distilled water, no attempts were made to deareate them. The electrolytic cell was all Pyrex and is described elsewhere [15].
Table (1) Crystallographic data and Guinier diagram of Roxbyite, Syn Cu7S4
|
H |
K |
I |
dabs |
Iobs |
H |
K |
dobs |
Iobs |
|
4 |
4 |
0 |
6.720 |
vw |
1.500 |
mw |
||
|
12 |
2 |
0 |
4.250 |
mw |
1.463 |
vw |
||
|
10 |
0 |
2 |
4.240 |
mw |
||||
|
3 |
7 |
2 |
3.600 |
mw |
||||
|
16 |
0 |
0 |
3.3 50 |
mst |
||||
|
8 |
0 |
4 |
3. 000 |
m |
||||
|
18 |
2 |
1 |
2.864 |
st |
||||
|
20 |
0 |
1 |
2.630 |
st |
||||
|
20 |
4 |
0 |
2.537 |
m |
||||
|
1 |
5 |
5 |
2.452 |
mw |
||||
|
2.374 |
vst |
|||||||
|
0 |
16 |
0 |
1.938 |
vst |
||||
|
8 |
8 |
6 |
1.861 |
vst |
||||
|
1.679 |
m |
|||||||
|
1.628 |
mw |
Cyclic voltammograms curves (CVs) were performed using auto lab (ECO Chemie) combined with the software package GPES (General purpose Electrochemical System) was used. This is a computer controlled electrochemical measurements system. It consists of data acquisition system and potentio stat-glvanostat. CV’ s were used to study the electrochemical behavior of copper in potassium sulfide solutions sweeping from hydrogen evolution -1.8 V to +0. 8 V oxygen evolution. All measurements were taken at 25±1 °C.
Table 2. Crystallographic data and Guinier diagram of Digenite Cu9S5
| h | K | I | dabs | lobs | h | k | I | dabs | lobs |
| 0 | 0 | 9 | 5.333 | vw | 1 | 1 | 12 | 1.759 | vw |
| 0 | 0 | 12 | 4.000 | vw | 2 | 0 | 5 | 1.671 | vw |
| 1 | 0 | 1 | 3.385 | vw | 0 | 2 | 7 | 1.647 | vw |
| 0 | 0 | 15 | 3.200 | mw | 2 | 0 | 8 | 1.632 | vw |
| 1 | 0 | 7 | 3.042 | mw | 0 | 1 | 26 | 1.621 | vw |
| 0 | 1 | 8 | 2.954 | mw | 0 | 2 | 10 | 1.599 | vw |
| 1 | 0 | 10 | 2.771 | mw | 2 | 0 | 11 | 1.581 | vw |
| 0 | 1 | 11 | 2.679 | vw | 1 | 1 | 18 | 1.579 | vw |
| 1 | 0 | 13 | 2.499 | vw | 0 | 2 | 13 | 1.541 | vw |
| 0 | 1 | 14 | 2.412 | vw | 2 | 0 | 14 | 1.520 | vw |
| 1 | 0 | 16 | 2.248 | mw | 0 | 2 | 16 | 1.477 | vw |
| 0 | 1 | 17 | 2.171 | vw | 0 | 2 | 19 | 1.408 | vw |
| 1 | 0 | 19 | 2.027 | vw | 2 | 0 | 20 | 1.385 | vw |
| 1 | 1 | 0 | 1.959 | vst | 0 | 1 | 32 | 1.372 | vw |
| 0 | 0 | 27 | 1.777 | vw | 2 | 0 | 23 | 1.316 | vw |
Scanning electron microscope (SEM) of the type (XL 30) was used to examine the surface of copper in absence and presence of potassium sulfide solution. All micro graph of corroded specimens were taken at magnification of (X-500). Energy dispersive analysis X-ray examination using a Traktor TV-2000 energy dispersive spectrometer was used in this work. Guinier powder photographs were used for the crystallographic phase analysis of the products.
Table (3) Crystallographic data and Guinier diagram of Covellite, Syn CuS
| H | K | l | dabs | Iobs | h | k | l | dabs | Iobs |
| 0 | 0 | 2 | 8.180 | vw | 2 | 1 | 3 | 1.210 | vw |
| 1 | 0 | 0 | 3.285 | vw | |||||
| 1 | 0 | 0 | 1.094 | vw | |||||
| 1 | 0 | 1 | 3.220 | mw | 2 | 1 | 8 | 1.060 | vw |
| 1 | 0 | 2 | 3.048 | st | 3 | 0 | 6 | 1.015 | vw |
| 1 | 0 | 3 | 2.813 | vst | |||||
| 0 | 0 | 6 | 2.724 | mst | |||||
| 1 | 0 | 5 | 2.317 | vw | |||||
| 0 | 0 | 8 | 2.040 | vw | |||||
| 1 | 0 | 7 | 1.902 | mw | |||||
| 1 | 1 | 0 | 1.896 | st | |||||
| 1 | 0 | 8 | 1.735 | m | |||||
| 2 | 0 | 3 | 1.572 | vw | |||||
| 1 | 1 | 6 | 1.556 | m | |||||
| 1 | 1 | 8 | 1.390 | vw | |||||
| 2 | 0 | 8 | 1.820 | vw |
The potassium sulfide solutions were always freshly prepared from potassium hydroxide solutions of known concentrations by bubbling with H2S gas pure. The hydroxide solution was degassed with N2 prior to preparing the sulfide, in order to preventair azidation of the H2S which would lead to the information of polysulfide and subsequently sulfur.
Table 4: Crystallographic data and Guinier diagram of complex similar to KCuS4
| H | k | l | dabs | Iobs |
| 8.8 | v | |||
| 6.3 | v | |||
| 5.8 | v | |||
| 3.7 | m | |||
| 2.6 | m | |||
| 2.5 | m | |||
| 2.95 | m | |||
| 2.36 | m | |||
| 2.25 | m | |||
| 2.15 | m | |||
| 2.05 | m | |||
| 2.08 | m | |||
| 1.92 | v | |||
| 1.82 | v | |||
| 1.66 | w |
Results and Discussion
Cyclic voltammogram curves
Fig. ( 1) represents the cyclic voltammograms of copper electrode in 2M K2S solution in the -1.8V to 0.8V at a voltage scan rate of 50 mV sec-1. An inspection of this figure it is clear that three regions were obtained the first region involves an anodic peak (peak I) located at -0.9V which is related to the formation of black anodic layer of cuprous sulfide Cu2-xS (Roxbyrite) on the surface of electrode. The second region corresponds to the anodic hump (peak II) appearing at the positive side of peak I. When the current reaches the minimum value at -0.25V, a block thick adhered layer covers the metal surface. There are differences between the first cycle and the following one, e.g. shifts of peaks to more positive values. Finally the third region located at potentials greater than 0 V (peak III), corresponds to the copper oxide electroformation. Super imposed by covellite deposition.
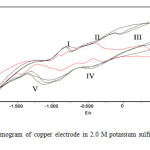 |
Fig1: Cyclic voltammogram of copper electrode in 2.0 M potassium sulfide solution at sweep rate 50 mv/s. Click here to View Figure |
Potentio static polarization measurements
Current transients recorded in 3M K2S at different potential in the -0.8 to +0. 8V range show a rapid initial decrease in current to attain later practically a constant value. In this case two different regions can be distinguished in the current transients Figs. 2(a,b &C) Inspection of these figures it is clear that, in region A at potential +0.8V (Fig. 2a) the current is similar to that seen in Fig. (2b) at low negative potential, and after the corrosion products are removed no pitting of copper is detected. In region B, the current transient corresponds to both the breakdown of the adherent sulfide layer and the formation of poorly protective copper sulfide with the simultaneous occurs of small patches [16].
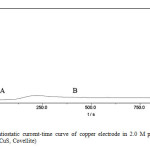 |
Fig2(a): Potentiostatic current-time curve of copper electrode in 2.0 M potassium sulfide at potential 0.8 V (CuS, Covellite) Click here to View Figure |
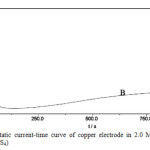 |
Fig2(b): Potentiostatic current-time curve of copper electrode in 2.0 M potassium sulfide at potential 0.6 V (KCuS4) Click here to View Figure |
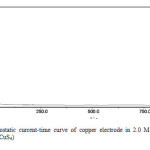 |
Fig2(c): Potentiostatic current-time curve of copper electrode in 2.0 M potassium sulfide at potential 0.2 V (KCuS4) Click here to View Figure |
The voltammetric results of copper electrode m potassium sulfide solutions show a multiplicity of anodic and cathodic current peaks related to already well established electrochemical reactions [16]. This allows a reasonable interpretation of the current transients run under a constant potential step and the evaluation of the various contribution participating in the copper anodization in alkaline sulfide solution. When the positive potential going scan starts from a potential sufficiently low to prevent copper sulfidization, the first process corresponds to the formation of an initial thin Cu2S layer which probably comprises at very early stage a non-stoichiometry such as Cu18S [17]. The cuprous sulfide formation is assigned to the decreasing portion of the current transients recorded in the potential range of peaks I and II (Fig. 1 ). The influence of the double layer charge in the current transients appears at times shorter than those recorded. The initial current maximum suggests the nucleation and growth is involved in the current transient behavior. The corresponding process is the formation of another copper sulfide layer on the initial cuprous sulfide leading to a thick and adherent complex copper sulfide layer. As the current maximum is detected at potential close to the equilibrium potential of the Cu/CuS reversible electrode [18], it is reasonable to assume that the layer resulting from the nucleation and growth mechanism is mainly cupric sulfide. This reaction probably occurs a the pores of the Cu2S layer [18] and it is result in a certain degree of passivation. The rupture of this layer yields a poorly adherent CuS layer and corrosion of the base metal. These two processes depend on the concentration of the potassium sulfide, the potential applied to the electrode and the anodizing time. finally, the electroformation of copper oxide (Peak III) is delayed, and simultaneously the electrodissolution of copper is strongly accelerated, although the presence of copper oxide on the metal surface hinders the sulfidization process.
At potential 0.4V, the nucleation and growth of the copper sulfide complex layer and the rupture of the layer occur simultaneously seen by SEM [photo 1-4].
The various current contributions entering into these current transient are depicted in Figs. (2c ). The EDAX results showing mainly that a cuprous sulfide layer appears on the metal surface due to poorly adherent characteristics of the cupric sulfide layers formed during corrosion.
From 0.2V to -0.6 V (formation of KCuS4) the current increases with deceasing potential. At potential 0.8V Cu2S (Roxbyite formation) the current sharp decreases.
In the chronocoulometric measurements taken at a potential-0.4V two distinct region can be observed (Fig. 3). A very steep increase of the charge within few seconds and a steady, linear increase up to 1 000 sec. The first steep increase is probably due to the formation of thin primary layer followed by a steady slow growth of the second layer.
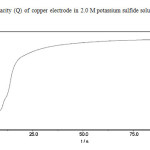 |
Fig3: Charge capacity (Q) of copper electrode in 2.0 M potassium sulfide solution at potential -.04 (KCuS4) Click here to View Figure |
Galvanostatic measurements
Galvanostatic curves on a Cu electrode in the presence of sulphide ions were recorded. Figs. 4a & b represent the galvanostatic curves recorded in K2S solution at constant current. Again the measurement at zero current is most interesting. After switching on the current, the potential rapidly increases towards more negative values, as a consequence of active Cu dissolution. The shoulder in the step indicates some change in the layer build up. The potential arrest, which is believed to correspond solely to the monolayer of cuprous sulphide, is observed, and is denoted as the nucleation potential, En. The potential plateau reached thereafter approximately -0.9V, corresponding to the peak potential (I) in cyclic voltammetry measurements, see Fig. 1. This potential is denoted as the formation potential Ef. The periods of time corresponding to the potential plateau are denoted as transition times.
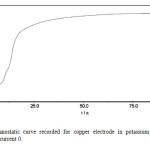 |
Fig4 (a): Galvanostatic curve recorded for copper electrode in potassium sulfide solution concentration 2M current 0. Click here to View Figure |
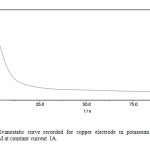 |
Fig4 (b): Galvanostatic curve recorded for copper electrode in potassium sulfide solution concentration 2M at constant current 1A. Click here to View Figure |
Surface analysis
The layer formed after immersed the copper electrode in 2M K2S was investigated by scanning electron microscope (SEM) and energy dispersive analysis ofX-rays (EDAX).
Analysis of the copper surface by SEM (Photo 1-4) showed two distinctive area. Most of the electrode was covered with dry looking layer for which the elemental composition was layer for which the elemental composition was consistent with CuzS. Therefore, copper should be expected to corrode producing Roxbyite. In fact, this is the most common product found, the electrode surface appeared completely covered by the black layer. Analysis of the surface by EDAX analysis showed negligible amounts of sulfur except for some very small amorphous deposits. These tiny deposits were found to be almost pure sulfur, where the patches were consistent with a CuS composition.
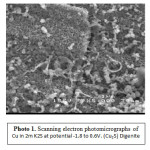 |
Photo1: Scanning electron photomicrographs of Cu in 2m K2S at potential -1.8 to 0.6V. (Cu2S) Digenite Click here to View Photo |
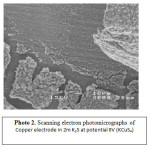 |
Photo2: Scanning electron photomicrographs of Copper electrode in 2m K2S at potential 0V (KCuS4)Click here to View Photo |
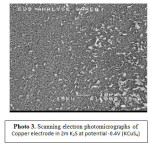 |
Photo3: Scanning electron photomicrographs of Copper electrode in 2m K2S at potential -0.4V (KCuS4) Click here to View Photo |
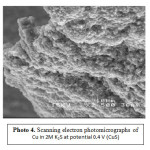 |
Photo4: Scanning electron photomicrographs of Cu in 2M K2S at potential 0.4 V (CuS) Click here to View Photo |
During the anodic potentiodynamic scan, the current decreased slowly with time showing some electrochemical noise. This suggests a competition between passivation process and active dissolution. SEM and EDAX analysis showed concentration of potassium except for core deposits of elements some shallow deposits were found (Photo 1-4 ), K, S and Cu inside the deposits were found by EDAX analysis as shown in Fig. (5a,b & c).
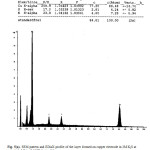 |
Fig5(a): SEM pattern and EDAX profile of the layer formed on copper electrode in 2M K2S at potential -1.8 to -0.6 VC during 1 h. Click here to View Figure |
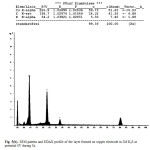 |
Fig5(b): SEM pattern and EDAX profile of the layer formed on copper electrode in 2M K2S at potential 0V during 1h. Click here to View Figure |
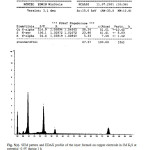 |
Fig5(c): SEM pattern and EDAX profile of the layer formed on copper electrode in 2M K2S at potential -0.4V during 1 h.Click here to View Figure |
This investigation shows that, it is possible, indeed, to form a KCuS4 layer anodically the morphology of these layer is different from that of Cu2S layer as shown in the pictures.
Conclusions
In the absence of sulphide, a dual oxide layer is formed. When sulphide is present, oxide growth is inhibited. At sufficiently anodic potentials the oxide layer is attacted, leading to a breakdown of passivity.
The resistance of passive copper to localized corrosion in sulfide solutions is strongly dependent on the thickness and composition of the passive layer, and to the experimental technique used for its determination.
The evidence from voltammetry for an anodic copper sulfide layer growth that is compositionally heterogeneous in depth has been verified by XRD.
Additionally the formation of an initial complex layer during the electrodissolution step involving the oxidation of Cu to the Cu(I) state can be observed . Chemical sulfidization of the copper has also been shown to be an important layer growth pathway. The sulfide layers do not passivate copper and the formation of passivating oxide layer is suppressed.
The sulfide layer on copper has a Cu2S staichiometry with Roxbyite and digenite structure and it grows by a nucleation. A small patches were consistent with a CuS composition. It is also proved that potentiostatic and galvanostatic experiments give comparable results.
The formation of KCu1S4 or any other ternary compound could not be observed. Only a presumable polysulfide phase very similar to
KCuS4 could be detected.
References
- L.E.A. Berlouis, D.A. Marnrnan and I.G. Azpuru: Surface Science, 1998, 408, 173.
- M.R. Gennerode de Chialvo, S. L. Marchiano and A.J. Arvia: J.Appl. Electrochern. 1984, 14, 165.
- S. T. Mayer and R.H. Muller: J. Electrochern. Soc., 1992, 139(2), 426.
- G. M. Brisard, J.D. Rudnicki, F. Mclarnon and E.J. Cairns: Electrochirn. Acta, 1995, 40(7), 859.
- A.D. Modestov, G. Dingzhourn H. Huage and B.H. Loo: J. Electroanal. Chern. 1995; 380(1-2), 63.
- Y.A. El-Tanawy, F.M. Al-Kharafi and A. Katrib, J. Electroanal. Chern. 125(1980) 321.
- L.D. Burke, M.L.G. Ahern and T.G.Ryan. J. Electrochern. Soc. 1996, 137, 553.
- H. H. Trehblow and B. Titze: Electrochirn. Acta 25(1980) 839.
- G. Vajenine: Inorganic Chern., 1996, 35, 451.
- G. Savelsberg: Naturforsch, 1978, 33B, 711.
- W. Rudorff: Anorg. Allg. Chern., 1952, 269, 141.
- C. Burschka: Naturforsch, 1979, 34B, 675.
- C. Burschka: Naturforsch, 1977, 324 B, 11.
- T. Ohtani: Solid State Cornrnun, 1991, 78, 913.
- A.M. Shmns El-Din and S.M. Abd El-Haleern Workstoffe. Korros., 1973, 24, 389.
- M. Larnache: Anal. Che1n. 1979, 51, 1320.
- B.C. Yrett: Corrosion, 1977, 33, 257.
- E.M. Khairy: Corros. Sci. 1973, 13, 141.

This work is licensed under a Creative Commons Attribution 4.0 International License.
![]()
A New Edition of Web of Science
Journal Impact Factor
2022: 0.5
Five Year: 0.8
Journal is Indexed in

Cabells Whitelist
![]()


