A green analytical method for the simultaneous estimation of Levofloxacin hemihydrate and ambroxol hydrochloride using hydrotropy and first derivative UV spectroscopy
Ceema Mathew1,2, B. Suman1, M. Ajitha2, P.R.Sathesh Babu1
1Gokaraju Rangaraju College of Pharmacy,Osmania University, Bachupally, Hyderabad-90, India. 2Jawaharlal Nehru Technological University, Hyderabad-85, India.
DOI : http://dx.doi.org/10.13005/ojc/300359
Article Received on :
Article Accepted on :
Article Published : 24 Sep 2014
A simple, economical and ecofriendly method for simultaneous quantification of Levofloxacin hemihydrate (LVF) and ambroxol hydrochloride (ABH) has been developed which is found to be accurate and precise. The method is based on the first derivative spectrophotometric method and the two wavelengths selected for the quantification of ABH and LVF were 255.70nm (zero crossing point for LVF) and 353nm (zero crossing point for ABH) respectively. 0.1N urea is used as solvent for dissolving the sample as well as for dilution. The first derivative amplitude-concentration plots were linear over the range of 5-40µg/ml and 3-10.5µg/ml with detection limits of 0.25 and 0.3025 µg/ml and quantification limits of 0.833 and 1.008µg/ml for LVF and ABH respectively. The % assay value was within the range of 99.57-102.0%. Since the % relative standard deviation for precision and accuracy of the method was found to be less than 2%, the method can be employed for the quality control tests of studied drugs in their formulations.
KEYWORDS:Levofloxacin hemihydrate; ambroxol hydrochloride; Derivative Spectrophotometry; Hydrotropy
Download this article as:| Copy the following to cite this article: Mathew C, Suman B, Ajitha M, Babu P. R S. A green analytical method for the simultaneous estimation of Levofloxacin hemihydrate and ambroxol hydrochloride using hydrotropy and first derivative UV spectroscopy. Orient J Chem 2014;30(3). |
| Copy the following to cite this URL: Mathew C, Suman B, Ajitha M, Babu P. R S. A green analytical method for the simultaneous estimation of Levofloxacin hemihydrate and ambroxol hydrochloride using hydrotropy and first derivative UV spectroscopy. Orient J Chem 2014;30(3). Available from: http://www.orientjchem.org/?p=4976 |
Introduction
The technique of derivative spectroscopy can be used with minimum error for the quantification of analytes whose spectra are overlapping by one another. It is a simple and cost effective analytical method for the simultaneous estimation of drugs in multicomponent samples that do not require the separation of the individual drugs nor any complicated extraction procedure. Since the quantitation can be done at the zero crossing point of the other drug there is little interference either from the second drug or from formulation additives.
LVF, a second generation fluoroquinolones is (−)-S-9-fluoro-2,3-dihydro-3-methyl-10-(4-methyl)-1-piperazinyl)-7-oxo-7H-pyrido[1,23-de]-1,4-benzooxazine-6-carboxylic acid1 and is a broad spectrum antibiotic that exhibits greater activity toward Gram-(+) bacteria2.. ABH chemically, 4-[(2-amino-3,5-dibromophenyl)-methyl]- amino] cyclohexanol hydrochloride is a mucolytic expectorant and used to reduce the viscosity of mucous secretions3.The combination of LVF and ABH are used for upper and lower respiratory tract infections. A thorough literature search shows very few methods such as HPLC4,5, TLC6 and UV spectrophotometry by Q analysis7 for this combination. To the best of our knowledge no method has been reported for the analysis of this combination by derivative spectroscopy. So an urgent need was felt to develop a UV derivative spectoscopic method which reduces the cost of analysis on comparing with HPLC or HPTLC method.
In the present manuscript a derivative methodology is developed based on first derivative UV spectroscopy for the simultaneous estimation of levofloxacin hemihydrate (LVF) and ambroxol hydrochloride (ABH). As the use of any environmentally toxic organic solvents is avoided throughout the analysis, a green analytical method is developed by adopting hydrotopic dissolution method. Apart from the ecofriendly method, it has the added advantage of being a more economical method
Materials and methods
Double beam UV-visible spectrophotometer (Shimadzu, 1800), assisted by a PC and loaded with UV-probe software was used for the analysis. The samples of LVF and ABH were available as gratis samples from Dr. Reddy’s laboratory, India. The tablets were purchased from local market.
Preparations of stock solution and standard solution
10mg of each standard drug of LVF and ABH were dissolved separately in 10 ml of 0.1N urea to obtain stock solution (1000µg/ml) of each drug. These solutions were diluted suitably with 0.1N urea to obtain the standard solutions of LVF and ABH.
Optimisation of derivative conditions and the selection of wavelengths
Different solvents were tried and either zero crossing points were not available for either drug or for both drugs. Zero crossing points were available for both the drugs when 0.1N urea was used and hence selected as the solvent. Standard solutions of LVF (10 µg/ml) and AMH (10 µg/ml) prepared in 0.1N urea were scanned in the spectrum mode between 200 nm to 400 nm using 0.1N urea as blank and later converted into first-derivative spectra by selecting suitable Δλ and scaling factor. The overlapped spectra was analysed for the presence of the zero-crossing point (ZCP) for both the drugs. ie ZCP of ABH at which LVF showed the derivative absorbance and vice versa for LVF were recorded.
Method validation
The method was validated for linearity, accuracy, precision, linearity, LOD and LOQ by the following procedures
Calibration curves for LVF and ABH
Calibration standards of LVF (5-40 µg/ml) and ABH solutions (3-10.5 µg/ml) were prepared in 0.1N urea. The first-derivative spectra were recorded for each drug and the first-derivative absorbance were measured at the zero crossing point of each drug. The values of first-derivative absorbance were plotted against corresponding concentrations to construct the calibration curves for each drug.
Accuracy
The accuracy of the method was determined by calculating recoveries of LVF and ABH by standard addition method. Tablet powder equivalent to 10 mg of LVF was transferred into three different 10 ml volumetric flasks and to it, 80%, 100% and 120% of LVF standard drug was added respectively and diluted with 0.1N urea. Similarly, tablet powder equivalent to 1.50 mg of ABH was transferred into another three different 10 ml volumetric flasks and to it 80%, 100% and 120% of pure ABH standard drug was added respectively and diluted with 0.1N urea. The derivative responses at the selected wavelengths were measured and the amounts of LVF and ABH were estimated using the regression equation resulting from the linearity studies. The recovery was performed in triplicate at each specified concentration level.
Precision
The intraday precision was determined by estimating the corresponding response three times on the same day for three different concentrations of LVF (10, 20, 30 µg/ml) and ABH (10, 20, 30 µg/ml). The interday precision was determined by estimating the response three times on 3 different days for the same concentrations as that of intraday precision. The degree of precision was reported as % relative standard deviation (% RSD).
Limit of detection (LOD) and limit of quantification (LOQ)
The limit of detection (LOD) and limit of quantitation (LOQ) for the procedure were performed on sample containing very low concentrations of the analyte. From the linearity data the limit of detection and quantitation can be calculated using the following formula.
LOD = 3.3 σ/S equation 1
LOQ = 10 σ/S equation 2
σ = standard deviation of the response and S= slope of calibration curve
Analysis of the dosage form (assay)
Twenty tablets of marketed formulation, each containing 500 mg of LVF and 75 mg of ABH were taken and accurately weighed to determine the average weight. An accurately weighed quantity of tablet powder equivalent to 10 mg of LVF was dissolved in 0.1N urea with the aid of sonicater. Later it was filtered through whatmann filter paper (No.41). The filtrate was diluted in a suitable manner to get a final solution containing 30µg/ml LVF and 4.5µg/ml ABH. The derivative responses were measured for each drug and the amount of LVF and ABH present in the sample solution was determined by substituting the derivative responses into the regression equation resulting from the linearity studies.
Results and Discussion
Analytical method development
The overlapped D0 spectra of LVF and ABH (fig.1) showed the complete overlapping of the spectra and hence cannot be used for the quantification of each drug without derivatisation.The overlaid D1 spectra (fig.1) with Δλ= 4nm and scaling factor = 1, were inspected for the presence of zero crossing points for both the drugs. LVF showed zero absorbance at 255.70 nm, whereas ABH gives the derivative response and the latter had zero absorbance at 353 nm, and the former gave the derivative response. Therefore, 255.70nm and 353nm were selected for estimation of ABH and LVF respectively. The suitability of the zero crossing points were confirmed by varying the concentrations of both drugs.
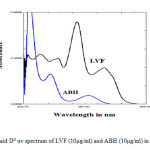 |
Fig1: Overlaid D0 uv spectrum of LVF (10µg/ml) and ABH (10µg/ml) in 0.1N urea Click here to View Figure |
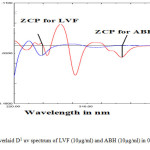 |
Fig2: Overlaid D1 uv spectrum of LVF (10µg/ml) and ABH (10µg/ml) in 0.1N urea Click here to View Figure |
Linearity studies
The studies were showing the linear relationship between concentration (µg/ml) and derivative absorbance for LVF and ABH in the range, 5-40 µg/ml and 3.0-10.5 µg/ml respectively (fig.3). From the linear regression analysis, correlation co-efficient value (r2) for LVF and ABH was 0.9998 and 0.9999 respectively. From the fig 3.2.2 and fig 3.2.3, it was observed that with the increase in LVF concentration, the derivative response at 353 nm was increased. Similarly the derivative response for ABH at 255.70 nm was increased with the increase in its concentration. The regression equation for LVF was found to be y = 0.0012x – 0.0003 and for ABH is y =-0.0016x + 0.0000.
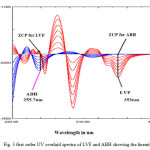 |
Fig3: first order UV overlaid spectra of LVF and ABH showing the linearity Click here to View Figure |
Accuracy (Recovery studies)
Three different levels (80%, 100% and 120%) of standards were spiked to sample solutions prepared from commercial tablets in triplicate. The mean of percentage recoveries and % RSD values were calculated and reported in table-3.3.1. The % recoveries of LVF and ABH were found to be in the range 99.55 – 101.60 and 99.39 – 101.33, respectively and found to be satisfactory.
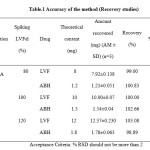 |
Table1: Accuracy of the method (Recovery studies) Click here to View table |
Precision
The repeatability (intra-day precision) of the method was determined by intraday (n=3) analysis of three standard solutions of LVF and ABH at the concentration of 10, 20 and 30 µg/ml and 3, 6 and 9 µg/ml respectively. The %RSD of repeatability was less than 2.0 for both the drugs. Intermediate precision was determined by the analysis on three different days on three different concentrations as that of intraday precision and the data is presented in table 2. The %RSD for inter-day analysis was less than 2.0 for both the drugs. These statistical data were indicative of good precision.
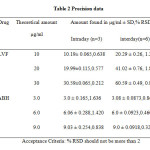 |
Table2: Precision data |
Limit of detection (LOD) and limit of quantitation (LOQ)
From the linearity plot the LOD and LOQ of LVF was found to be 0.25µg/ml and 0.833µg/ml respectively. For ABH, LOD was found to be 0.3025µg/ml and LOQ was found to be 1.008µg/ml.
Analysis of commercial tablets (assay)
The accuracy of proposed method was evaluated by the assay of commercially available tablets (L-CIN-A) containing LVF (500 mg) and ABH (75 mg). The amount of LVF and ABH found in the tablet was 499.125 mg and 75.78 mg respectively. These amounts were within the limits. The % assay in commercial formulations was found to be 99.57 for LVF and 102.0 for ABH by the proposed method. The % RSD for the assay value was less than 2, which indicated the accuracy of the proposed method.
Conclusion
In the present manuscript, an economical and ecofriendly analytical method was developed for the simultaneous analysis of LVF and ABH in the tablet dosage form, IPQC samples or dissolution samples. The validation study results indicated that the presence of excipients does not interfere with the analysis and hence the method can be employed for bulk drugs as well as formulations. Moreover the method has some advantages as neither it require any sophisticated instruments like HPLC or HPTLC nor costly reagents or solvents. It also require less time for analysis. Above all, urea which is used as solvent in this method is a nature friendly chemical.
References
- Sweetman, S. C.; Martindale – The Complete Drug Reference, Pharmaceutical Press, London, 33rd ed, (2002).
- Lafredo,S.C.; Foleno, B.D.; Fu, K.P. Chemotherapy. 1993, 39, 36–39.
- Budavari, S. The Merck Index, Merck and Co. Inc, Whitehouse Station, NJ, 12th ed, (1996).
- Kothekar, K.; Balasundaram, J.; Khandhar, A.; Mishra, R. Eurasian J. Anal. Chem. 2007, 2, 21- 31.
- Fathalla F Belal, Mohie K Sharaf El-Din, Nahed M El-Enany and Samar Saad. Chemistry Central Journal. 2013,7,162.
- Agrawal, O.D.; Shirkhedkar, A.A.; Surana S.J. J. Anal. Chem..2010. 65,418-422.
- Tabassum Patil and Yogesh Pore., J. Korean Chem. Soc., 2008, 52, 622-629.

This work is licensed under a Creative Commons Attribution 4.0 International License.
![]()
A New Edition of Web of Science
Journal Impact Factor
2022: 0.5
Five Year: 0.8
Journal is Indexed in

Cabells Whitelist
![]()


