Studying the Effect of Nicl2 Addition on the Optical Properties of Synthesized Chitosan
Angham G.Hadi
Chemistry Department, College of Science, Babylon University, Iraq.
DOI : http://dx.doi.org/10.13005/ojc/300208
Article Received on :
Article Accepted on :
Article Published : 01 May 2014
Polymer; Nickel Chloride; Optical properties; Absorbance and Chitosan
Download this article as:| Copy the following to cite this article: Hadi A. G. Studying the Effect of Nicl2 Addition on the Optical Properties of Synthesized Chitosan. Orient J Chem 2014;30(2). |
| Copy the following to cite this URL: Hadi A. G. Studying the Effect of Nicl2 Addition on the Optical Properties of Synthesized Chitosan. Orient J Chem 2014;30(2). Available from: http://www.orientjchem.org/?p=3206 |
Introduction
In recent years, polymers with different optical properties have been attracted much attentions due to their applications in the sensors 1, light-emitting diodes 2–4, and others 5, 6. The optical properties of these materials can be easily tuned by controlling contents of the different concentrations. Though a great deal of excellent work has been reported on such materials 7–9, it is still meaningful to extend the research of these polymers.
A polymer of a particular group is characterized by the molecular weight of the monomer unit. To study the interactions in the solid state of the polymers of few models have been suggested. One such model treats a polymer as an aggregate of fairly stiff tubes held together in approximately parallel bundles of forces arising from particle–particle potentials. The structure of polymers has been related to internal pressure and the same study has been extended to polystyrene solutions. Some of the interesting properties of polystyrene like the Gruneissen parameter, specific heat and bulk modulus have also been reported 10.Chitosan (CS) is a natural carbohydrate biopolymer derived by deacetylation (DA) of chitin, a major component of the shells of crustacea such as crab, shrimp, and crawfish. After cellulose, chitin is the second most abundant natural biopolymer found in nature 11. Chitosan is a non-toxic, biodegradable and biocompatible polymer. Over the last several years, chitinous polymers, especially chitosan, have received increased attention as one of the promising renewable polymeric materials for their extensive applications in the pharmaceutical and biomedical industries for enzyme immobilization and purification, in chemical plants for wastewater treatment, and in food industries for food formulations as binding, gelling, thickening and stabilizing agent 12. Chitosan has many properties that have generated interest in its use such as biodegradability, biocompatibility and its nontoxic nature 13. The deacetylated product, chitosan, has an amine functional group, which is strongly reactive with metal ions.
The objective of this study was the synthesis of the chitosan and studies the effect of addition of NiCl2concentration on optical properties of chitosan.
Experimental
Raw Material
Crawfish shells were obtained from commercial crawfish shells that separated, and washed under running warm tap water to remove soluble organics, adherent proteins and other impurities, and then they were dried and ground through a grinding mill.
Isolation of Chitosan
Traditional isolation of chitosan consists of three traditional steps (Figure 1): demineralization (DM), deproteinization (DP), and deacetylation (DA).
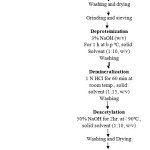 |
Figure1: Traditional Chitosan Production 14. |
The polymer (chitosan) was dissolved in 2% acetic acid by using magnetic stirrer in mixing process to get homogeneous solution at 900c , then the solution was cooled at room temp. , after which solution was transferred to clean glass Petri dish of (5.5cm) in diameter placed on plate form. The dried film was then removed easily by using tweezers clamp. The polymer systems were evaluated spectra photo metrically by using UV/160/Shimadzu spectrophotometer.
Results & Discussion
The absorbance of composites
Figure(2) shows the spectral dependence of the absorbance of the composites with different quantities of impurities .The figure shows that the absorbance decay exponentially with an increase of the wavelength .the absorbance is very large in the UV- region , this decay becomes relatively slower in the visible and near infrared regions15.
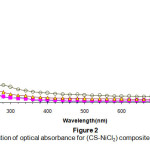 |
Figure 2: The variation of optical absorbance for (CS-NiCl2): Click here to View Figure |
The Absorption coefficient and energy gap of compos
Figure (3) shows the relation between the absorption coefficients of the composite with photon energy. High absorption coefficient with impurities concentration may be due to the absorption by the impurities .The absorption coefficient is smaller and stable in the low photon energy because of the scattering of the photon energy15.
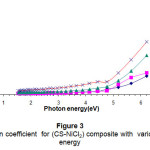 |
Figure 3: The absorption coefficient for (CS-NiCl2) composite with various photon energy Click here to View Figure |
Figures(4) & (5) give an indication that the composites have an indirect transition , by using these figures wecan calculate the energy band gap in the range corresponds to higher than 4.5 ev of the observed variation of the composite band gap this gives an indication about the effect of the differentiation in the molar concentration of the additives 15-16.
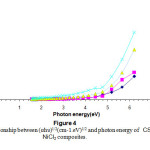 |
Figure 4: The relationship between (αhυ)1/2(cm-1.eV)1/2 and photon energy of CS-NiCl2 composites. Click here to View Figure |
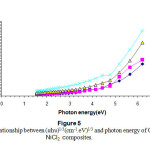 |
Figure 5: The relationship between (αhυ)1/3(cm-1.eV)1/3 and photon energy of CS-NiCl2 composites. Click here to View Figure |
Refractive Index and Extinction Coefficient
Figure (6) shows the variation of the extinction coefficient (K) as a function of the incident photon energy from this figure the values of the (k) is low in the low photon energy and increases with the increasing of the photon energy depending on conformation condition of the composite .By increasing the concentration of the additives the deviation from the chemical equilibrium increases too, so the absorption and (k) will increase as a result of the scattering centers in the composites.
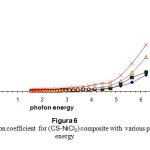 |
Figure 6: The extinction coefficient for (CS-NiCl2) composite with various photon energy Click here to View Figure |
Figure (7) shows the variation in the refractive index (n) of the composites within a given incident photon energy. The values increase exponentially with increasing photon energy. This indicates that the electromagnetic radiation pass though the material is slower in the VIS and UV regions however the speed is higher in the visible and near Infrared region .
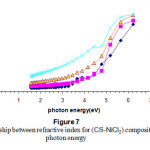 |
Figure 7: The relationship between refractive index for (CS-NiCl2) composite with photon energy Click here to View Figure |
dielectric constant
Figures (8) & (9) are used to illustrate the real and imaginary dielectric constant respectively .Both show the exponential increase with increasing the incident photon energy (from high values in the UV- regions) .The concentration of the additives plays an important role in both cases due to the electronic polarization. The effect is very clear in the high photon energy region15-16.
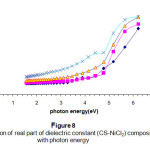 |
Figure 8: The variation of real part of dielectric constant (CS-NiCl2) composite with photon energy Click here to View Figure |
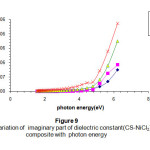 |
Figure 9: The variation of imaginary part of dielectric constant(CS-NiCl2) composite with photon energy Click here to View Figure |
Conclusion
- The absorbance is very large in the uv, region.
- The absorption coefficient is smaller and stable in the low photon energy.
- The absorption and (k) will increase as a result of the scattering centers in the composites.
- The values of the refractive index (n) of the composites increase exponentially with increasing photon energy.
- The real and imaginary dielectric constants show the exponential increase with increasing the incident photon energy.
References
- McQuade D. T., Pullen A E, Swager T. M., ,Conjugated Polymer-based Chemical Sensors. Chem. Rev., 100(7): p. 2537―2574,(2000).
- Grazulevicius J.V., Strohriegl P., Pielichowski J., (2003).Carba-zole-containing Polymers:Synthesis, Properties and Applications. Prog. Polym. Sci., 28(9): p. 1297―1353.
- Akcelrud L., Electroluminescent Polymers. Prog. Polym. Sci., 28(6): p.875-962, (2003).
- Kim D. Y., Cho H. N., Kim C. Y., Blue Light Emitting Polymers. Prog. Polym. Sci., 25(8): p.1089―1139. (2000).
- Lo S. C., Burn P. L., Development of Dendrimers: Macromolecules for Use in Organic Light-Emitting Diodes and Solar Cells. Chem. Rev., 107(4):p.1097 – 1116,(2007)
- Cravino A., Sariciftci N.S., Double-cable Polymers for Fullerene Based Organic Optoelectronic Applications. J. Mater. Chem., 12: p.1931―1943. (2002).
- Luo J., Li X., Hou Q., et al., High-Efficiency White-Light Emission from a Single Copolymer: Fluorescent Blue, Green, and Red Chromophores on a Conjugated Polymer Backbone,Adv Mater., 19(8):p.1113-1117,(2007)
- Liu J., Shao S., Chen L., et al., White Electroluminescence From a Single Polymer System: Improved Performance By Means of Enhanced Effi-Ciency and Red- Shifted Luminescence of the Blue-Light-Emitting Species. Adv. Mater. 19(14):p.1859―1863. (2007).
- Zhen H. Y., Xu W., King W., et al., White-Light Emission from a Single Polymer with Singlet and Triplet Chromophores on the Backbone., Macromol. Rapid. Commun, 27(24): p.2095―2100. (2006)
- Durai S., Ramadoss P., A Fresh Study of Optical and Thermal Properties of Polystyrene Solutions, Bull. Mater. Sci., 27(1): p. 57–58. (2004)
- No, H.K., Meyers, S.P., Crawfish Chitosan as a Coagulant in Recovery of Organic Compounds from Seafood Processing Streams. J. Agric. Food Chem. 37(3): 580-583.(1989)
- Knorr, D., Use of chitinous polymers in food- A challenge for food research and Development. Food Technol. 38(1): 85-97.(1984)
- Varma, A.J., Deshpande, S.V., Kennedy, J.F. Metal complexation by chitosan and its derivatives: a review. Carbohydrate Polymers. 55, 77-93.. (2004)
- Meyers, S.P. and No, H.K. Utilization of crawfish pigment and other fishery processing by-products. Ch. 20. In “Nutrition and Utilization Technology in Aquaculture,” Lim, C.E and Sessa, D.J. (Eds.), p. 269-277.(1995).
- Falah Ali Jasim, Angham G. Hadi, Preparation of (Pomegranate Peel- Polystyrene)Compositesand Study their Optical Properties, Advances in Physics Theories and Applications,IISTE, 18, 22-27.(2013)
- Hani NajmObaid, Angham G. Hadi, Optical Properties of (Polystyrene-Wood buckthorn Peel) Composites,Journal of Energy Technologies and Policy, IISTE, 3,5, 56-61.(2013).

This work is licensed under a Creative Commons Attribution 4.0 International License.
![]()
A New Edition of Web of Science
Journal Impact Factor
2022: 0.5
Five Year: 0.8
Journal is Indexed in

Cabells Whitelist
![]()


