Isolation and characterization of flavone from the aerial parts of Avicennia alba Blume
1School of Pharmaceutical Sciences, Siksha ‘O’ Anusandhan University, Bhubaneswar, Odisha-751030, India.
DOI : http://dx.doi.org/10.13005/ojc/300242
Download this article as:
![]()
The present work deals with the isolation and structure elucidation of new flavones from methanol extract of Avicennia alba aerial parts. Isolation of the compound was carried out by chromatographic techniques, followed by different spectral analytical methods. The spectral data of UV-Vis, FT-IR, 1H NMR, 13C NMR and GC-MS of the isolated compound is in support of presence of flavone nucleus. The compound has been characterized as 2-[3'-(3"-(hydroxymethyl)oxiran-2"-yl)-2'-methoxy-4'-(methoxymethyl)phenyl]-4H-chromen-4-one.
KEYWORDS:Avicennia alba; aerial parts; flavones; spectral characterization
INTRODUCTION
Plant-based drugs play an important role in both traditional and modern system of medicine1. Now a day, plant extracts are used in traditional system of medicine and still continue to provide health coverage over 80% of the world’s population in the developing countries2. Avicennia alba Blume. (A. alba) is a type of tropical mangrove and classified to the family Avicenniaceae. The plant is distributed in India, Burma, Malacca and Ceylon3. The plant is commonly grown in intertidal zones of tropical and sub-tropical area4.
It is used for the treatment of several types of diseases such as sexual disorders, scabies, rheumatism, paralysis, asthma and snake-bites and ulcer5. The resin of seeds and leaves is used in traditional medicine as contraceptive6. Various studies have reported that the extract of Avicennia alba shows broad range of biological activities, such as anti-cancer, anti-inflammatory, anti-microbial, antidiarrhoeal and analgesic7-9.
Previous phytochemical studies on the plant have reported in the isolation of steroids, triterpenes, saponins, flavonoids, alkaloids and tannins10. Three naphthoquinones and their analogues such as avicequinone-A, avicequinone-B, avicequinone-C and avicenol-A, avicenol-B, avicenol-C respectively, were isolated from stem bark of Avicennia alba11. In our present study, we have investigated on the aerial parts of Avicennia alba and reported the isolation and structural elucidation of new the flavone.
MATERIALS AND METHODS
Plant Materials
The aerial parts of Avicennia alba were collected from Sundarban area, South 24 Parganas, West Bengal, India, in the month of October, 2011 on the basis of Ethnomedicinal uses. The plant was identified & authenticated by the taxonomist from the botanical survey of India, Botanical Garden, Howrah, West Bengal. A voucher specimen (CNH/128/2011/TECHII/637) has been deposited in the herbarium of the Department of Pharmacognosy, School of Pharmaceutical Sciences, Siksha O Anusandhan University, Odisha, India.
Extraction and isolation of compound
The air-dried plant materials (500 g) of Avicennia alba were coarsely powdered and extracted in a Soxhlet apparatus with methanol for 48 hours. The methanolic extract was concentrated to obtain a dark viscous mass (64 g). A little amount of the extract was screened chemically for determination of different phytoconstituents. The concentrated extract was dissolved in little quantity of methanol and adsorbed on silica gel (60–120 mesh) for preparation of slurry. The slurry was then air-dried and chromatographed over a silica gel (60–120 mesh) column. The column was eluted with n-hexane initially, then eluted with n-hexane-ethyl acetate mixtures of increasing polarity (95:5, 90:10, 80:20, 70:30, 60:40 and 50:50). Various fractions were collected separately and matched by TLC to check their homogeneity. The fractions with same Rf values were combined together and crystallized. The compound was then recrystallized with methanol and finally purified by preparative TLC. The isolated compound was subjected to various physical and spectral studies for characterization.
Experimental Section
A Soxhlet extractor was used for extraction. The melting point was determined in open capillary tube (Sisco) and is uncorrected. The spectra were recorded with the following instruments, IR: Bruker -FTIR-8400S spectrophotometer using KBr powder; NMR: 1H NMR and 13C NMR spectra on Bruker DRX-500 NMR spectrometer using MeODas the solvent at 500 MHz and 125 MHz respectively; GC-MS: Shimadzu-Mass spectrophotometer; TLC with silica gel GF254; column chromatography silica gel (60-120 mesh, Merck) and elemental analysis: Perkin Elmer-2400 Auto system.
RESULTS
UV-VIS
λ max : 228, 312nm
FTIR (KBr) cm-1study
The IR absorption spectrum showed absorption peaks at 3154.97 (OH str), 1710.56 (C=O str.), 2853.48 (CH2 str.), 1610.27 (C=C str.), 1468.53, 1175.40 (C-O-C str.), 1092.48(C-O str.).
![Fig.1: 2-[3'-(3"-(hydroxymethyl) oxiran-2"-yl)-2'-methoxy-4'-(methoxymethyl) phenyl]-4H-chromen-4-one](https://www.orientjchem.org/wp-content/uploads/2014/05/Vol30_No2_Isola_D.R.K._Fig1-150x150.jpg) |
Fig1: 2-[3′-(3″-(hydroxymethyl) oxiran-2″-yl)-2′-methoxy-4′-(methoxymethyl) phenyl]-4H-chromen-4-one |
1HNMR (MeOD, 500 MHz) study
1HNMR has given signals at δ 6.41 (1H, s, H-3), 8.19 (1H, m, ArH-5), 7.47 (1H, m, ArH-6), 7.56 (1H, m, H-7), 7.55 (1H, d, H-8), 3.83 (3H,s.OCH3-2′),6.72 (1H, s, H-5′), 7.12 (1H, s, H-6′), 4.83 (2H, s, CH2-4′), 3.31 (3H, s, O-Me-4′), 3.86 (1H, d, H-2”), 2.85 (1H, d, H-3”), 3.79 (2H, d, CH2-3”), 4.57 (1H, s, OH-3”).
13CNMR (CDCl3, 125 MHz) study
13C NMR (CDCl3): δ 162.76 (C-2), 110.3 (C-3), 177.85 (C-4), 125.9 (C-5), 123.9 (C-6), 135.1 (C-7), 116.1 (C-8), 156.4 (C-9), 123.8 (C-10), 109.5 (C-1′), 154.6 (C-2′), 128.33 (C-3′), 137.9 (C-4′), 119.54 (C-5′), 124.8 (C-6′), 56.6 (OCH3, C-7′), 58.9 (OCH3, C-4′), 56.01 (oxirane, C-2”), 56.51 (oxirane, C-3”), 64.0 (-CH2OH,C-3”).
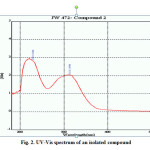 |
Fig 2: UV-Vis spectrum of an isolated compound |
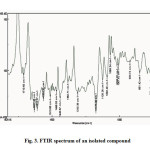 |
Fig 3: FTIR spectrum of an isolated compound |
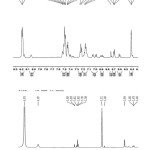 |
Fig 4: 1HNMR spectrum of an isolated compound |
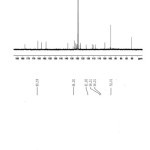 |
Fig 5: 13C NMR spectrum of an isolated compound |
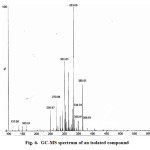 |
Fig 6: GC-MS spectrum of an isolated compound |
DISCUSSION
The compound (Fig1.) was obtained as a dark yellow compound from n-hexane–ethyl acetate (7:3) eluants with melting point of 215-218 0C. The structure was confirmed by comparison of its spectral data with the corresponding authentic drug or literature based data. The UV absorption (λmax: 228, 312nm in MeOH) exhibited the characteristic absorption maxima for a flavonoid12.
Addition of few drops of cerric ammonium nitrate reagent; it produced red coloration suggesting the presence of alcoholic groups13. The FTIR spectroscopic analysis exhibited characteristic broad peak centered at 3154.97 cm-1 that is characteristic of O-H stretching suggesting the presence of hydroxyl group which was substantiated by chemical identification test. The absorption bands at 2853.48 corresponds to CH2– stretching, at 1710.56 cm-1 as a result of C=O stretching, at 1610.27 cm-1 as a result of CH=CH stretching, absorption band at 1175.40 cm-1 is due to the presence of C-O-C stretching. The structure of isolated flavone was elucidated by H1 NMR and13C-NMR techniques as by comparison of spectral data with that of reported earlier14.
The 13C-NMR spectrum of flavone revealed the presence of approximately 21 peaks; twelve aromatic carbon, four active methylene, two methoxy and α-β unsaturated hydro carbon atom attached to ketone system. The presence of aromatic hydrocarbon of the flavone were structurally proved by sharp signal at 125.9, 123.9, 135.1, 116.1, 156.4, 123.8, 109.5, 154.6,115.1,131.9,128.4 and 126.5 which were attributed to the position of (C-5),(C-6),(C-7), (C-8), (C-9), (C-10), (C-1′), (C-2′), (C-3′), (C-4′), (C-5′) and(C-6′) respectively. The absorption signal at 64.0 ppm, due to the presence of O-H attached to the carbon at C-3′′and also exhibited characteristic broad peak at 3154.97 cm-1 appeared in FTIR spectrum.
The 13C-NMR showed most recognizable down field sharp signal at δ 177.5 ppm, corresponds to the presence of γ carbonyl group of flavone, which may be assigned to C-4 position. The absorption peaks at δ 56.01 and 56.6 ppm that may correspond to epoxy in form of angular C-O-C atoms at C-2′′ and C-3′′ positions. The peaks at δ 61.00 ppm showed a sharp signal, assigned at C-4′ due to presence of electron donating groups like (-OCH3) in this structure. The 13C-NMR signals at δ 162.6 and 104.6 were attributed to unsaturation of C-2 and C-3 in isolated flavones structure.
The 1H-NMR spectrums displayed sharp aromatic proton signals δ H: 8.18 (1H, m, ArH-5), 7.47 (1H, m, ArH-6), 7.56 (1H, m, H-7), 7.55 (1H, d, H-8), suggested a flavone skeleton. The singlet proton signal also observed at δ 6.54 which may be contributed due to presence of H-3 cyclic unsaturated ketone system. The singlet proton signal observed at δ 3.31 ppm may be attributed due to the presence of the group of methoxy at the position H-4. Two functional ether groups present in same structure were distinguished by H1NMR spectra as methoxy and epoxy groups. The epoxy protons signal appeared at δ 2.89 and 3.81 which were assigned to H-2”and H-3” positions which was also supported by IR stretching at 1175.40 cm-1.
GC‐MS spectroscopy showed a molecular ion [M] + peak at 368.13 m/z value corresponding [C21H20O6] which confirms the proposed molecular formula. The Chemical name of this flavones derivative is 2-(5-(3-(hydroxymethyl) oxiran-2-yl)-2-methoxy-4-(methoxymethyl) phenyl)-4H-chromen-4-one and were supported by the molecular weight 368.38 calculated by Rast’s procedure. It also showed a series of peaks at 137, 163, 252, 271, 268, 297, 337 and 368 amu corresponding to various fragments. Fragmentation ion peaks at m/z 337 correspond to the loss of -CH2OH (M-31) group from the C-3′′ position of the epoxy substituent of parent molecule. The next fragment ion peak at m/z297(M-40)corresponds to the removal of epoxy ethane from the C-5′ of the parent molecule. Moreover, the two signals exhibited at m/z 271 and 268, from which one should be attributed either due to the loss of -CH2OCH3 moiety from the 4′-carbon atom position or attribute the de-methoxylated fragment ion (M-31) from the 2′-carbon atom position peak. The fragment signals at m/z 252 appeared due to an equatorial cleavage of isolated flavones structure.
Conclusion
Hence from the above discussion, it was concluded that the isolated molecule contains flavone moiety attached to substituted hydroxyl methyl oxirane at C-5′ position and methoxy methyl at the C-4′ position. The reported experimental results and 13C-NMR, 1H-NMR and the Mass spectra reported in the present study led us to formulate the molecular formula of the compound as C21H20O6, bearing the IUPAC nomenclature 2-[3′-(3″-(hydroxymethyl)oxiran-2″-yl)-2′-methoxy-4′-(methoxymethyl)phenyl]-4H-chromen-4-one.
REFERENCE
- Das, P. K., Goswami, S., Chinniah,A., Panda, N., Banerjee, S., Sahu, N. P and Achari, B. J.Ethnopharmacol., 110: 189-199 (2007).
- Sharma, A.K., Gangwar, M., Tilak, R., Nath, G., Sinha, A.S.K., Tripathi Y.B and Kumar, D. Pharmacog. Journal, 4(30): 34-40 (2012).
- Rahman, M.A., Biswas, S., Bala, V., Shill, A.K and Bose U. Pharmacologyonline, 1: 492-500 (2011).
- Qureshi, R and Bhatti, G.R. Pak. J. Bot., 40: 979-992 (2008).
- The wealth of India, Raw Materials, C.S.I.R. New Delhi, India, Vol-I: A, pp. 502-503 (1985).
- Bandaranayake, W.M. Mangroves and Salt Marshes, 2: 133– 148 (1998).
- Ross, S.A., Megalla, S.E., Bisby, D.W and Awad A.H. Fitoterpia, 5: 303-308 (1980).
- Itoigawaa, M., Itoa, C., Hugh, T.W and MasatoOkudad T. Cancer Letters, 174: 135–139 (2001).
- Rahman, M.A., Bala, S. V., Shill A. K and Bose U. Pharmacologyonline, 1: 492-500 (2011) .
- Bandaranayake, W.M. Curr. Topic. Phytochem., 14: 69-78 (1995).
- Ito, C., Katsuno, S., Kondo,Y., Hugh, T., Tan, T and Furukawa H. Chem. Pharm. Bull., 48: 339-343 (2000).
- Fu, M.Q., Feng, S.X., Zhang, N.L., Zhou, X.J and Huang, H.J. Helv. Chim. Acta., 95: 598-605 (2012).
- Selvaraj, S.J., Alphonse, I and Britto, S.J. Indian. J. Chem., 47: 942-94 (2008).
- Kupeli, E and Yesilada, E. J. Ethnopharmacol., 112: 524-530 (2007).


![]()


