Determination of Bendamustine Hydrochloride in Pure and Dosage Forms by Ion-Associative Complex Formation
Katare Kiran Kumar1, Ratnakaram Venkata Nadh2*, K.E.V. Nagoji3
1Department of Chemistry, Nalanda P.G. College, Vijayawada-520001, A.P., India,
2*School of Biotechnology, Vignan University, Vadlamudi-522213, India.
3Department of Pharmacy, Sri Venkateswara College of Pharmacy, Etcherla, Srikakulam-532410, A.P., India,
DOI : http://dx.doi.org/10.13005/ojc/300272
Article Received on :
Article Accepted on :
Article Published : 28 Jun 2014
The present study is aimed to develop visible spectrophotometric methods for the determination of Bendamustine hydrochloride. The developed methods involve the formation of chloroform extractable colored ion-association complexes of Bendamustine hydrochloride with tropaeolineo-oo (Method A) and Alizarin Red S (Method B). The chloroform extracted coloured complexes showed absorbance maxima at wavelengths 480 and 460nm in methods A and B respectively. Beer’s law obeyed in the concentration range of 2.5–12.5μg/mL in both the cases. Correlation coefficients were found to be 0.9991 and 0.9998 for methods A and B respectively. In addition molar absorptivity, Sandell sensitivity and the optimum conditions for quantitative analysis of the Bendamustine hydrogenchloride were determined. The developed ion-association complex methods were rapid, simple and economically viable compared to other reported analytical methods which require expensive instruments and are not available in common laboratories. Thus the proposed methods for Bendamustine determination in bulk and pharmaceutical formulations can be used in commercial laboratories.
KEYWORDS:Bendamustine; hydrochloride; TPooo; ARS; Ion-association complex; Validation.
Download this article as:| Copy the following to cite this article: Kumar K. K, Nadh R. V, Nagoji K. E. V. Determination of Bendamustine Hydrochloride in Pure and Dosage Forms by Ion-Associative Complex Formation. Orient J Chem 2014;30(2). |
| Copy the following to cite this URL: Kumar K. K, Nadh R. V, Nagoji K. E. V. Determination of Bendamustine Hydrochloride in Pure and Dosage Forms by Ion-Associative Complex Formation. Orient J Chem 2014;30(2). Available from: http://www.orientjchem.org/?p=4050 |
Introduction
Bendamustine hydrochloride {(4-{5-[bis-(2-chloroethyl) amino]-1-methyl-1Hbenzimidazol-2-yl} butanoic acid)} (Fig. 1) is a bifunctional alkylating agent that is used to treat chronic lymphocytic leukemia (CLL) and non-Hodgkin lymphomaand may be used for other types of cancer1,2 . Literature survey revealed that one each UV spectrophotometric3, HPLC4, LC–MS5 and capillariy GC method6 have been developed for its determination in various biological fluids. Though, the above methods have vivid benefits like multi component determination, rapidness, precision etc., they suffer from noteworthy disadvantage – expensive equipments which unavailable for common laboratories7. Hence, currently simpler and lower cost alternative techniques are employed for the quality control (QC) of the drug in commercial preparations. Among such techniques, spectrophotometric method is the generally used method of choice for routine analysis in industrial QC laboratories, especially in developing countries8. Therefore, in the present study, an attempt has been made to develop sensitive visible spectrophotometric methods for the determination of Bendamustine hydro chloride in pure and dosage formulations using the acidic dyes (TPooo and ARS).
EXPERIMENTAL
Instruments
A double beam UV-VIS spectrophotometer (UV-1800, Shimadzu, Japan) with 1.0cm matched quartz cells were used for the spectral and absorbance measurements. An Elico LI-120 digital pH meter was used for pH measurements.
Materials and Methods
TPooo solution was prepared by dissolving 200mg of tropaeolineo-oo in 100ml of distilled water. ARS solution was prepared by dissolving 200mg of Alizarin Red-S in 100ml of distilled water. HCl (0.1M) was prepared by diluting 8.6ml of concentrated hydrochloric acid to 1000ml with distilled water and standardized. All the chemicals used in this study were of AR grade.
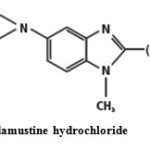 |
Fig1: Bendamustine hydrochloride Click here to View Figure |
Preparation of standard solution
The standard stock solution of Bendamustine hydrochloride was prepared by dissolving 100mg of the drug in 10mL of the methanol and diluted to 100ml with distilled water to get 1.0mg/mL solution. Final working standard solution of 50μg/mL of Bendamustine hydrochloride was prepared by diluting 5.0mL solution of the above solution to 100mL with distilled water.
Preparation of Marketed formulations
Bendit (lyophilized powder – marketed formulations of Natco Pharma Limited, Hyderabad), an amount equivalent to 50 mg of Bendamustine hydrochloride was dissolved into 10ml of methanol and filtered through a Whatman filter paper (No.42). The filterate was transferred into 100mL volumetric flasks and made up to the mark with distilled water.
Proposed Procedures for Methods – A and B
Into a series of 125ml separating funnels containing aliquots of standard bendamustine solution (0.5 – 2.5ml, 50mg/ml), 5.0ml of 0.1M HCl solution and 2.0ml of 0.2% dye solution [TPooo in method-A / ARS in method-B] were added successively. The total volume of aqueous phase in each separating funnel was adjusted to 10ml with distilled water. To each separating funnel 10ml of chloroform was added and the contents were shaken for 2 min. The two phases were allowed to separate and the chloroform layer was passed through anhydrous sodium sulfate for the removal of moisture content. The absorbances of the separated chloroform layers were measured at lmax 480nm / 460 nm against reagent blank for methods A and B respectively. All spectroscopic measurements were carried out at room temperature (25 ± 2oC).
RESULTS AND DISCUSSION
Absorption spectra of coloured complex
In the present investigation, the presence of positively charged tertiraty nitrogen in Bendamustine hydrochloride in acid medium is expected to attract negatively charged part of the acidic dyes (TPooo and ARS) forming colored ion association / ion-pair complexes (Fig. 4) exhibiting absorption maxima at 480nm and 460nm respectively. The so formed complexes are more stable due to electrostatic interactions.
Chemistry of the colored chromogens
The aim of the proposed study is the usage of TPooo/ARS as the anionic components for the spectro photo metric determination of Bendamustine which forms ion association complexes. TPooo is an azo dye and chemically named as 4-[(4-hydroxy-1-napathalenyl azo] benzene sulfonic acid monosodium salt. Alizarin red S (sodium salt of 3,4-dihydroxy-9,10-dioxo-2-anthracene sulfonic acid) ionizes in aqueous solution and thus develops a negative charge on it. Presence of several functional groups in Alizarin Red S (ARS) facilitates its use in complexation reactions and its selectivity can be altered by changing the reaction conditions in various assay procedures9.
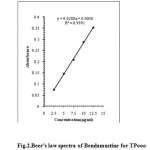 |
Fig2:Beer’s law spectra of Bendamustine for TPooo Click here to View Figure |
Due to lack of primary amino group in the Bendamustine, it cannot participate in disadvantageous reactions viz., diazotization, azocoupling, gelatin gel, Schiff base formation, indo phenol reaction etc., which require long reaction time as well as form instable coloured products. But extraction photo metric determination can be adopted for its determination due to presence of tertiary nitrogen10,11. Intensively colored associates are formed between the negative ions of acid dyes (TPooo / ARS) and oppositely charged ions of basic organic compound (Bendamustine). The produced colored associates are poorly water soluble and are easily extracted into organic solvents. The coloured associates have lower dissociation in the organic phase12 due to their lower dielectric coefficient in comparison with water. This helps us for extraction spectrophotometric analysis of basic organic compound10. A number of low concentrated compounds can be determined by extraction spectrophotometry using anion dyes like TPooo/ARS which are having high molar absorption coefficients 10.
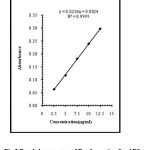 |
Fig3:Beer’s law spectra of Bendamustine for ARS Click here to View Figure |
Optimised conditions for methods A and B
The optimum conditions for the color development of methods (A and B) were established by varying the parameters one at a time, keeping the others fixed and observing the effect on the absorbance of the colored species. The effect of dye volume was studied by varying in the range 0.5- 3.0 ml, where the intensity of the colour was maximum at 2.0 ml and the intensity continued till 3.0 ml and hence, 2.0ml dye was considered as optimum volume. The selection of the extracting solvent was done by studying its effect both on extraction efficiency and color intensity. Out of the proved useful solvents (toluene, dichloromethane, dichloroethane, chloroform, and carbon tetrachloride), chloroform was selected due to its lower extraction abilities of the reagent blank and higher stability of the colored species produced. The effect of shaking time of aqueous coloured solution with chloroform was studied in the range 1 to 5 minutes and 2minutes was found to be the optimum. The colored species after separation into the organic phase were found to be stable for 60 min & 120 min in the methods – A & respectively, and afterwards the intensity gradually decreased. Hence, all the absorbance measurements were carried out within 30 minutes from the extraction of coloured species into chloroform. Similarly, for acidic conditions maintenance, the most favorable condition was found to be 5.0ml of 0.1M HCl solution.
Method Validation
Validation of the proposed spectrophotometric method was done according to ICH guidelines13.
Linearity and Range
The absorbance was determined at five concentration levels ranging from 2.5μg / ml to 12.5.0μg/mL of Bendamustine hydrochloride. The calibration curve was constructed by plotting response factor against various concentrations of Bendamustine hydrochloride. The regression equation for calibration curve of Bendamustine hydrochloride was Y=0.028X–0.00030 (R2=0.9991) for TPooo and Y=0.0236X–0.0024 (R2=0.9998) for ARS (Fig. 2 and 3). The results show that an excellent correlation exists between response factor and concentration of drugs within the studied concentration range (Table.1).
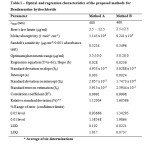 |
Table1: Optical and regression characteristics of the proposed methods for Bendamustine hydrochloride Click here to View table |
Sensitivity (LOD and LOQ)
The limit of detection (LOD) is defined as the lowest concentration of an analyte that an analytical process can reliably differentiate from back-ground levels. The limit of quantification (LOQ) is defined as the lowest concentration of the standard curve that can be measured with an acceptable accuracy, precision and variability. In this study, LOD and LOQ for the two proposed methods were calculated using standard deviation of the response and the slope of the calibration curves (Table 1).
Precision and Accuracy
The precision of the method was demonstrated by intraday variation studies. In the intraday studies, response factor for six repeated concentrations of standard and sample solutions were determined, and percentage RSD for two methods were calculated. The accuracy of the methods was determined by recovery experiments. The recovery studies were carried out six times. The percentage recovery and standard deviation for the two methods were calculated and presented in (Table.1). From the data obtained, the mean recovery was found to be 99.95 % for Bendamustine hydrochloride, indicating very good reproducibility of the developed method
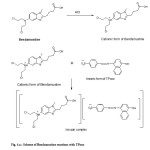 |
Fig.4a: Scheme of Bendamustine reactions with TPooo Click here to View Figure |
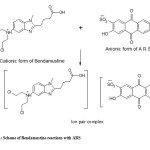 |
Fig4b: Scheme of Bendamustine reactions with ARS Click here to View Figure |
Analysis of pharmaceutical preparations
Commercially available lyophilized powder of Bendamustine hydrochloride (Bendit) was subjected to analysis by the proposed methods and amount of Bendamustine was deduced from the calibration curves (Fig.2 and 3). Recovery of Bendamustine hydrochloride by the suggested methods was satisfactory with standard deviations with in limit (Table 2).
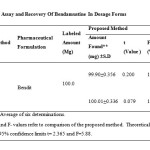 |
Table2: Assay and Recovery Of Bendamustine In Dosage Forms Click here to View table |
CONCLUSION
The proposed method made use of a simple reagent, which most ordinary analytical laboratories can afford. The present method involve the formation of highly stable colored species which makes it easier for the determination of Bendamustine hydrochloride in pharmaceutical dosage forms as low as 5.0μg/mL for Bendamustine hydrochloride drug at the given optimum conditions. Further statistical parameters and the recovery study data clearly indicate the reproducibility and accuracy of the proposed method. There it is concluded that the proposed method is suitable and valid for application in laboratories lacking liquid chromatographic instruments.
References
- Kath, R.; Blumenstengel, K.; Fricke, H. J.; Höffken, K. J. Cancer Res. Clin. Oncol. 2001, 127, 48–54.
- Bagchi, S. Lancet Oncol. 2007, 8, 674–679.
- Mathrusri, A. M.; Pavani, S.; Anusha, S.; Harika, M.; Venkatesh, B. J. Chem. Pharm. Res. 2012, 4, 1696–1701.
- Ivanka, P.; Anita, B.; Neli, K.; Danka, O.; Kolio, T. J. Pharm. Biomed. Anal. 2008, 48, 1143-1150.
- Dubbelman, A.C.; Tibben, M.; Rosing, H.; Gebretensae, A.; Nan, L.; Gorman, S.H.; Robertson, P. Jr,; Schellens, J.H.; Beijnen, J.H.; J. Chromatogr. B Anal. Technol. Biomed. Life Sci.2012, 893-894, 92–100.
- Weber. H.; Marko.V.; Kallay, Z.; Trnove, Tc.; Amlache, Rr. R. J. Chromatogr. B Biomed. Sci. Appl. 1990 5, 459–463.
- Subrahmanya Sudhir, M.; Madan Mohan, P., Venkata Nadh, R. Orient. J. Chem. 2013, 29 (1), 235–240.
- (a) Subrahmanya Sudhir, M.; Venkata Nadh, R. Res. J. Pharm. Biol. Chem. Sci. 2013, 4(1), 609–617. (b) Subrahmanya Sudhir, M.; Venkata Nadh, R. Orient. J. Chem. 2013, 29(4), 1507-1514.
- Kiran Kumar, K.; Venkata Nadh, R.; Nagoji, K.E.V. Orient. J. Chem. 2013, 29(1), 263–269.
- Korenman, I.M., Ekstraktsiya v analize organicheskikh veshchestv (The Extraction Process in the Analysis of Organic Substances), Moscow: Khimiya, (1977).
- Kramarenko, V.F. and Popova, V.I., Fotometriya v far matsevticheskom analize (Photometry in Pharmaceutical Analysis), Kiev: Zdorovya, (1972).
- Kuznetsov VI., Khimicheskie osnovy ekstraktsionno fotometricheskogo analiza (Chemical Principles of the Extraction and Photometric Analytical Methods), Moscow: Goskhimizdat, (1963).
- International Conference on Harmonization, ICH Harmonized Tripartite Guidelines (Nov 2005), Validation of Analytical Procedures, Text and Methodology Q2 (R1). ICH, Geneva (2005).

This work is licensed under a Creative Commons Attribution 4.0 International License.
![]()
A New Edition of Web of Science
Journal Impact Factor
2022: 0.5
Five Year: 0.8
Journal is Indexed in

Cabells Whitelist
![]()


