Carotenoid Contents in Anoxygenic Phototrophic Purple Bacteria, Marichromatium Sp. and Rhodopseudomonas Sp. of Tropical Environment, Malaysia
1Kulliyyah of Science,
2Institute of Oceanography and Maritime Studies (INOCEM), International Islamic University Malaysia, Jalan Sultan Ahmad, Bandar InderaMahkota, 25200 Kuantan, Pahang, Malaysia
DOI : http://dx.doi.org/10.13005/ojc/300228
Download this article as:
![]()
Carotenoid; Contents; Marichromatium Sp; Tropical Environment
INTRODUCTION
Carotenoids are a class of unsaturated hydrocarbons and their oxygenated derivatives, which consist of eight isoprenoid units (Cogdell& Frank, 1987). Generally,the photosynthetic organisms lacking carotenoids, the cell will die. Theapplication of carotenoids as a key ingredient in high-performance functional beverages is especially helping drive growth in food industry. Growing demand for wellness drinks against a backdrop of rapid socio-economic growth, rising standard of living, increase in discretionary spending, and stronger emphasis and health and well-being, is therefore expected to benefit demand for carotenoids.Recently, carotenoids have gained biotechnological interest as nutritional supplement as this can contribute to maintenance of cell function and disease prevention (Rafiqul et al., 2005; Klassen & Foght, 2008). Anoxygenic phototrophic purple bacteria are the major group of phototrophic bacteria that convert light energy into chemical energy by anoxygenic photosynthesis with the presence of photosynthetic pigments. These pigments appear in cell suspension in various colors from brown, red, pink, beige, purple and these pigments have characteristic absorption spectra. Photosynthetic pigments (bacteriochlorophylla or b and carotenoids) are located in the cytoplasmic membrane and internal membrane systems (vesicles, lamellae or membrane stacks) (Imhoff, 2006).
Anoxygenic phototrophic bacteria represent such a group that has the potential to be used in the aquaculture as feed supplement. The bacterial biomass is not only rich in protein, fat and vitamin but also contain a significantly amount of carotenoids and biological cofactors that are useful in fish feed formulation (Jalal, et al, 2001); Shapawi et al., 2012). Phototrophic bacteria are one of the naturally available carotenoid rich sources. Phototrophic bacteria exist in rice fields and lakes, and everywhere on Earth. In practical terms, the potential of phototrophic bacteria is particularly seen in the environmental fields. Because it decomposes organic materials well, among these applications is its use in wastewater treatment. Research has also reported on the carotenoid and its effectiveness in applied use in agriculture, aquaculture, and animal husbandry. Carotenoids from microbes can be used as aquaculture feed has been intensively studied nowadays (Gupta et al., 2007; Sujjat et al, 2002; Jalal et al, 2001).
The source of carotenoids obtained from phototrophic bacteria is much cheaper, safe and easy to acquire from them. The inclusion of carotenoids in the fish diets is not only found to improve skin color but also improve growth, metabolism, reproduction and increase the value of ornamental fishes (Gupta et al., 2007). In these contexts, growth profiling of Rhodopesudomonas sp. and Marichromatium sp. were investigated to analyze the dry cell weight and total carotenoid contents of these two potential bacteria obtained from the tropical environment.
MATERIALS AND METHODS
Microorganism and media
Marichromatium sp. was isolated from the mangrove sediments, Kuantan Pahang. While Rhodopseudomonassp. was collected from fish rearing tanks, INOCEM, IIUM Malaysia respectively. The bacteria were cultivated and monitored by using 112 media under anaerobic light conditions at 2500-lux light intensity of continuous illumination of 60-watt tungsten bulb at 30±2°C (Shapawi et al., 2012). Two isolates each from Rhodopseudomonassp. and Marichromatiumsp. were selected to compare the growth profiling from day 0 to day 5. IIUM-JHR and IIUM-JHM are identification codes given to Rhodopseudomonas sp. and Marichromatium sp. respectively.
Preparation of standardized culture
The method was adopted according to Ainon et al., (2006). A single colony of the isolate was inoculated in 15 ml of 112 broth media and incubated anaerobically for three days. The optical density of the bacteria was adjusted to 660 nm using UV-VIS spectrometer. About 5 ml of the culture were added to 15 ml of newly made 112 broth media to be used for the test. The cultures were incubated for 24, 48, 72, 96, 120 hours. Three bottles from each isolates were taken out daily to screen the dry cell weight and total carotenoid content.
Determination of photopigments
The type of pigments was determined according to Sojka et al., (1970). The standardized culture was centrifuged and the pellet was mixed with 3 ml of 25 % (w/v) bovine serum albumin. The mixture was inverted gently 3 to 5 times. Then, it was measured in wavelength ranges from 250 to 1000 nm using UV spectrometer.
Determination of dry cell weight
The method was followed according to Ainon et al., (2006). About 10 mL of the bacterial broth culture was added in triplicate to pre-weighed eppendorf tubes and centrifuged for 20 min at 8000 rpm. After a subsequent washing step with sterile water, cell pellets were dried until constant mass at 105°C for 24 hours. The final weight was taken and dry cell weight (DCW) was calculated according to:
DCW (g/L): [(Final weight – initial weight)/10] x 100
Determination of total carotenoid content
About 3 ml of bacterial broth cultures were extracted using acetone-methanol according to the method described by Jensen and Jensen (1971). The culture was centrifuged at 5000 rpm for 25 minutes and the pellet was suspended in 0.1 ml of distilled water. About 4.9 ml of acetone-methanol (7:2 v/v) were added. After vortexing, the mixture was covered in aluminum foil and stored at 4 °C for 30 minutes. Then, it was centrifuged again before the supernatant was measured at 480 nm using UV spectrometer.
C = D.V.F (10/2500)
Dry weight of the sample (g)
Where,
C= Total carotenoid (mg/g)
D= Absorbance at 480 nm
V= Total volume sample used (5 ml)
F= Dilution factor of sample
2500= Average extinction co-efficient for carotenoids
Statistical analysis
Experimental data were analyzed with two ways of ANOVA for dry cell weight and total carotenoid content. Levene’s test was used to test the homogeneity of variances and multiple comparisons amongst treatments were performed with a Turkey HSD post hoc test. Significance level was set at p<0.05. SPSS statistical Package v.22.0 was used for all statistical analyses(Shapawi et al., 2012).
RESULTS
Photopigments
A feature common to all Rhodopseudomonas sp. is their red pigmentation. While, brown pigmentation is common for Marichromatium sp. Analyses of IIUM-JHR and IIUM-JHM by UV-VIS spectroscopy revealed the common presence of absorption maxima of three major peaks at 326-389, 470-591 and 800-900 indicating the presence of bacteriochlorophyll a as shown in Figure 1, Table 1 and Table 2. While absorption maxima of 480-550 nm in IIUM-JHR and IIUM-JHM is consistent with the presence of carotenoids belonging to the normal spirilloxanthin series as described by Imhoff, (2006).
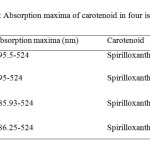 |
Table 1,A: Absorption maxima of carotenoid in four isolates Click here to View table |
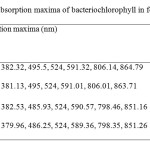 |
Table1b: Absorption maxima of bacteriochlorophyll in four isolates Click here to View table |
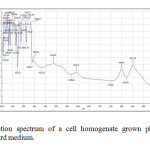 |
Figure 1: Absorption spectrum of a cell homogenate grown phototrophically in standard medium. Click here to View Figure |
Figure 1 above shows the growth of isolate from day 0 to day 5 of incubation. All the isolates were observed for dry cell weight and total carotenoid content. The color of culture for IIUM-JHR1 and IIUM-JHR2 changed from light yellow to darker red in five days of inoculation. While for IIUM-JHM1 and IIUM-JHM2, the color changed from light brown to darker brown in five days. These cultures were used for evaluation of dry cell weight (g/L) and total carotenoid content (mg/g).
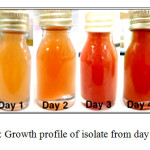 |
Figure 2: Growth profile of isolate from day 0 to day 5 : Click here to View Figure |
Dry Cell Weight (g/L)
There is no significant differences p>0.05 in dry cell weight among four isolates. The highest dry cell weight was obtained by isolate IIUM-JHM1 at 48 hours of culture, which was 3.83 g/L. The isolate that showed the lowest dry cell weight was IIUM-JHR2 (0.68 g/L) at 24 hour of culture. However, IIUM-JHR2 started to increase at maximum level at 72 hour. Most of the strain showed the sigmoid curve of graph. The graph declined rapidly after 24 hours of inoculation but then they increased as they entered exponential phase until reached their maximum peak. After reaching their maximum peak, they started to decline again at 96 hours.
Total carotenoid content (mg/g)
Total carotenoid content of four isolateshas shown in the Figure 2. There was no significant differences p>0.05 in the production of carotenoids among four isolates. IIUM-JHR2 showed the highest value of total carotenoid, which was 4.08 mg/g at 72 hour of culture. The lowest value of total carotenoid was obtained by strain IIUM-JHR1 (1.53 mg/g). All the isolates showed their maximum production of carotenoid at different days of culture, which are between 48 to 72 hours. IIUM-JHR1, IIUM-JHR2 and IIUM-JHM2 reduced rapidly after reaching their maximum peak and increased a little towards 120 hours while IIUM-JHM1 keep decreasing after its maximum peak. Even though IIUM-JHM1 showed the highest dry cell weight (Figure 3) but the total carotenoid content was not the highest. This showed a possible correlation between the increases of dry cell weight with the decrease in carotenoid production.
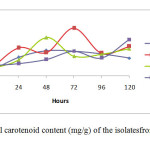 |
Figure 4: Total carotenoid content (mg/g) of the isolatesfrom day 0 to day 5 Click here to View Figure |
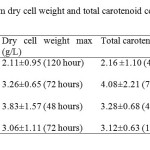 |
Table 2: Maximum dry cell weight and total carotenoid content for the isolates |
DISCUSSION
Dry cell weight and total carotenoid content
The role in metabolism of carotenoid has importance because of its diverse functions in biotechnological applications such as in pigmentation, antioxidant activity, reproduction and in dietary supplementation. The present study found that different isolates of the same species of phototrophic bacteria produced different values of dry cell weight and total carotenoid content. This can be observed in the Table 3 that among all the four isolates, IIUM-JHM1 obtained the highest dry cell biomass (g/L) at 48 hours of culture. Optimum production of cell biomass for IIUM-JHM1 and IIUM-JHR2 was at 48-hour inoculation and 72 hours was the optimum time for IIUM-JHR1 and IIUM-JHM2 as can be observed by the highest peak achieved the isolates in the Figure 3. After reaching their maximum peak, they started to decline again at 96 hours. This might be due to the insufficient level of nutrient and increased biological demand (Getha, et al, 1998). Poor heat dissipation also could be the reason of the declining growth of the isolates after reaching their maximum peaks.
Different species of phototrophic bacteria have different dry cell biomass at different period of culture as observed in their findings (Prasertsan et al., 1993). Certain isolates can achieve maximum dry cell weight at 48 hours of culture and some species even take a week time to grow. Rhodopseudomonas palustris grown in the modified MYC yielded 2.65 g/L of dry cell weight (Kim & Lee, 2000). While in other studies reported that Rhodocyclus gelatinosus produced lower dry cell weight biomass, which was, 1.4 to 1.5 g/L at 35 hours of culture using G5 media. It can be remarked that dry cell weight also differs in different culture medium used.
As shown in Table 3, IIUM-JHM2 produced the highest dry cell weight. However, it did not produce the highest total carotenoid content. The highest total carotenoid content was produced by IIUM-JHR2 that was 4.08±2.21 at 72 hours of inoculation while isolate IIUM-JHM2 produced the second highest total carotenoid content 3.28±0.68 mg/g. Bacterial cell needs a constant source of light to grow well. However, it can be seen that when dry cell weight increased, the carotenoid content reduced. This is might be due to the increased temperature from the heat dissipated from the light source. Carotenoid synthesis shows sensitivity to both high and low temperatures. Prasertsan et al., (1993) stated that when the light intensity increased, the production of the carotenoid and bacteriochlorophyll reduced. After reaching the optimum day of inoculation, production of carotenoid started to decline and the reddish color intensity also reduced.
Thus, bacterial cells need to be replenished by adding newly prepared broth media so that the cells start to revitalize again to avoid this regressing process. In the presence of light, it is possible that the carotenoid disintegrated, dehydrated or isomerized due to acidic condition (Britton and young, 1993). As described in the Figure 4,
each of isolate showed a maximum content of carotenoid at different period of culture. However, it can be observed after reaching their maximum production, they started to decline greatly as postulated by IIUM-JHR1, IIUM-JHR2, and IIUM-JHM1. The decreasing of carotenoid content might be due to the inhibiting factor of light saturation. After a long period of incubation, it can be seen that the color of culture reduced from dark red to light red indicating the reduction of the carotenoid in the cells. Getha et al., (1998) reported that the continuous supply of light by the tungsten’s lamp could suppress the production of pigment. 
CONCLUSION
The findings of this study postulated that the carotenoids from phototrophic bacteria could have potential in nutritional supplementation of culture based aquatic organisms. The study also accomplished that IIUM-JHM1 showed the best growth for dry cell weight and IIUM-JHR2 showed the best production for total carotenoid contents. Further studies are recommended to investigate the effect of different light source on the growth profile of the bacteria. Nevertheless, Rhodopseudomonas sp. and Marichromatium sp. could be recognize as potential candidates to be incorporated in aquaculture activities to enhance the growth and survival of commercial and ornamental fishes in Malaysia and South East Asian countries as well.
ACKNOWLEGMENTS
This is on offshoot of our study on the growth and survival of recreational fish Tor tambroides fry by using phototrophic bacteria in indoor cultured conditions. The authors are grateful to the Research Management Centre, IIUM for giving financial support through Endowment B (EDW B -12-355-0833) and Ministry of Higher Education to award FRGS (13-036-0277) to fulfill this study. The authors are thankful to staffsof Faculty of Science and Institute of Oceanography and Maritime Studies(INOCEM) for their assistance and guidance throughout these research activities and study period.
REFERENCES
- Ainon, H., Tan, C. J. and Vikineswary, S. (2006). Biological Characterization of Rhodomicrobium vannielii Isolated from a Hot Spring at Gadek , Malacca , Malaysia, Malaysian Journal of Microbiology. 2(1), 15–21.
- Britton, G. and Young, A.J. (1993). Methods for the isolation and analysis ofcarotenoids. In: Carotenoids in Photosynthesis. Young, A. and Britton,G.(eds.). Chapman and Hall, London. p. 409-457.
- Cogdell, R.J. & Frank, H.A. (1987). How carotenoids function in photosynthetic bacteria. BiochimicaetBiophysicaActa. 63-79.
- Getha, K., Chong, V. C., & Vikineswary, S. (1998). potential use of phototrophic bacterium: Rhodopseudomonas palustris as an aquaculture feed. Asian Fisheries Science, 10, 223–232.
- Gupta, S. K., Jha, A. K., Pal, A. K., & Venkateshwarlu, G. (2007). Use of natural carotenoids for pigmentation in fishes, 6(1), 46–49.
- Imhoff, J. F. (2006). The Phototrophic Alpha-Proteobacteria Without Abstract Introduction Phylogeny. Springer.p.1–31.
- Jalal, K.C.A., Sorgeloos, P., Mohd. Zaki, M. Said and Saad, C.R.(2001) Effects of Spirulinaon the growth and carotenoid position in tropical sport fish Tor Tambroidesfry. Journal of European Aquaculture Society. Special Publication No. 30. p. 258-261.
- Jensen, S.L. and Jensen, A. (1971). Quantitative determination of carotenoids in photosynthetic tissues. In Pietro, A.S.(ed.) Methods in Enzymology, Volume 23, Photosynthesis, p.586-602. New York:Academic Press.
- Kim, J. K., & Lee, B. (2000). Mass production of Rhodopseudomonas palustris as diet for aquaculture. Aquacultural Engineering.23, 281–293.
- Klassen, J.L. & Foght, J.M. (2008). Differences in carotenoid composition among Hymenobacter and related strains support a tree-like model of carotenoid evolution. Applied and Environmental Microbiology. 74(7): 2016-2022.
- Prasertsan, P., Choorit. W., and Suwanno, S. (1993). Isolation, identification and growth conditions of photosynthetic bacteria found in seafood processing wastewater. World Journal of Microbiology and Biotechnology. 9:590-592.
- Rafiqul, I. .M., Jalal, K.C.A. and M. Z. (2005) Environmental Factors for Optimisation of Spirulina Biomass in Laboratory Culture. Biotechnology. 2005. 4(1):19-22.
- Shapawi, R., Ting, T. E., & Azad, S. Al. (2012). Inclusion of purple non sulfur bacterial biomass in formulated feed to promote growth, feed conversion ratio and survival of asian Seabass Lates calcarifer juveniles. Journal of Fisheries and Aquatic Science, 7, 475–480.
- Sojka, G. A. Freeze, H.H. & Gest, H. (1970). Quantitative estimation of bacteriochlorophyll in situ. Achieves of Biochemistry and Biophysics. 136:578-580.
- Sujjat Al Azad, Ving C. Chong and S. Vikineswary (2002) Phototrophic Bacteria as Feed Supplement for Rearing Penaeus monodon Larvae. Journal of the World Aquaculture Society. Volume 33 (2):97–219.


![]()


