High Performance Thin Layer Chromatographic Quantification Domperidone and Paracetamol in Tablets Forms Domperidone, Paractamol, Silica gel HPTLC Plate, HPTL
Amar Singh , M H Khan
Domperidone, paractamol, silica gel HPTLC plate, HPTL
DOI : http://dx.doi.org/10.13005/ojc/300157
Article Received on :
Article Accepted on :
Article Published : 02 Apr 2014
A simple, precise, rapid, selective, (HPTLC) method has been established for simultaneous analysis of Domperidone (DMP) and paractamol (PAR) in tablet dosage forms. The Chromatographic separation was performed on per coated silica gel 60 GF254 .plate with acetone -methanol- carbon tetrachloride 5:5:1(V/V) as mobile phase. The plates were developed to a distance of 8.0 cm at ambient temperature. The developed plate were scanned and quantified at their single wavelength of maximum absorption at approximately 280 and 245nm for Domperidone and paractamol, respectively. Experimental conditions such as band size, chamber saturation time, migration of solvent front, slit width, etc .were critically studied and the optimum condition were selected .The drugs were satisfactorily resolved with Rf 0.53±0.02 for domperidone and 0.73± 0.02 for paracetamol.The method was validated for linearity, accuracy, precision and specificity. The calibration plot was linear between 15-45 ng per band for DMP and 850-2500 ng per band for PAR. The limit of detection and quantification for DMP were 0.23 and 0.189 ng per band. respectively ;forPAR they were 0.308 and0.938 ng per band. This HPTLC procedure is economic, sensitive, and less time consuming than other Chromatographic procedures. It is a user –friendly and important tool for analysis of combined tablets forms.
KEYWORDS:Domperidone Literature survey reveals that method; reported for analysis .
Download this article as:| Copy the following to cite this article: Singh A, Khan H. M. High Performance Thin Layer Chromatographic Quantification Domperidone and Paracetamol in Tablets Forms Domperidone, Paractamol, Silica gel HPTLC Plate, HPTL. Orient J Chem 2014;30(1). |
| Copy the following to cite this URL: Singh A, Khan H. M. High Performance Thin Layer Chromatographic Quantification Domperidone and Paracetamol in Tablets Forms Domperidone, Paractamol, Silica gel HPTLC Plate, HPTL. Orient J Chem 2014;30(1). Available from: http://www.orientjchem.org/?p=2738 |
INTRODUCTION
Domperidone (DMP, 5-chloro-1-[1-[3-(2-oxo-2,3-dihydro-1H behzimidazol-1-yl)propyl]piperidine-4-yl]-1,3-dihydro-2H-benzimidazol-2-one; Figure 1) is used as an antiemetic drug [1] paractamol (PAR;4-hydroxyacetanilide; Figure2 ) is a centrally and peripherally acting non –opioid analgesics and antipyretic drug [2]. The combination of these drugs (9mg DMP and 450 mg PAR) is used for antiemetic and pain associated with gastrointestinal (GTH) disorders. It is also to relived the symptoms of migraine including headache, the feeling of sickness, and also vomiting. Paractamol helps to ease the pain of the migraine headache. Domperidone works by increasing the contractions of the stomach and intestine, which aids in rapid absorption of paractamol Literature survey reveals that method reported for analysis of DMP and PAR individually or in combination with other drugs include high –performance liquid chromatography [3], liquid chromatography-electro spray quadrupole linear ion –trap mass spectrometry [4], voltammeter with a boron- droped diamond electrode [5], solid –phase molecular fluorescence[6], and many other [7-14]. However, review HPTLC method is reported for simultaneous analysis of these drugs as active pharmaceutical ingredient or in tablets forms .This paper reports a simple, precise, and accurate HPTLC method for simultaneous estimation of PAR and DMP in combined tablets forms
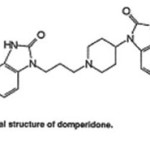 |
Figure 1 Click here to View Figure |
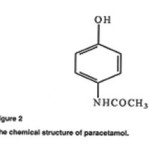 |
Figure 2 Click here to View Figure |
Experimental
Reagents and materials
Domperidone and paractamol standards were obtained forms SUN Pharma, MUMBAI, India. (9mg DMP and 540 PAR) tablets forms manufactured by Torrent Pharma were purchased locally. Analytical- grade acetone and methanol –carbon tetra chloride were from S .D. Fine chemicals, Mumbai, India and silica gel 60 GF254 plates were obtained from E Merck, Mumbai, India.
Domperidone (4mg) and paractamol (240mg) reference substances were accurately weighed and transferred to a250ml volumetric flask. The power was dissolved in 60:60(V/V) acetone –methanol and the solution was diluted to volume with the same solvent mixture to furnish concentrations of 20µgml-1 Domperidone and 1000µgml-1 paractamol. This solution (10ml) was diluted to20ml with the same solvent mixture to furnish a solution containing 8µgml-1 Domperidone and 400µgml-1 paractamol.
sample preparation
Ten tablets were weight and ground to a fine power A quantity of power equivalent to 4mg Domperidone and 240mg paractamol was weight and transferred to a250ml volumetric flask. The power was dissolved in 60:60(v/v) acetone –methanol and the solution was diluted to volume with the same solvent mixture to furnish a solution containing 20µgml-1 Domperidone and 1000µgml-1 paractamol . The solution was filtered through whatman filter paper No41 Then10mlof the solution was diluted to 25ml with the same solution mixture to furnish a solution containing 9µmgml-1 Domperidone and 450µgml-1 paractamol.
Chromatography
Chromatography was performed on 10cm×10cm aluminium foil plates coated with 250µm layer of silica gel 60F254 (E Merck, Darmstadt, Germany; supplied by Anchorman Technologies, Mumbai, India) Slandered and sample solution of Domperidone and paractamol (4µL) were applied to the plates as 7-mm bands ,11mmbands apart and 16mm from the bottom and left edges of the plate, by use of a CAMAG (Muttenz Switzerland) Linomate V sample applicator fitted with a 100µL syringe (Hamilton Reno, Nevada, USA ,Japan ) .The constant application rate was 15s µL-1and a nitrogen aspirator was used .plates were developed with acetone-methanol –carbon tetrachloride 5:5:1(v/v)as mobile phase. Linear ascending development was performed in a 10cm×10cm twin tough glass chamber (CAMAG) previously equilibrated with mobile phase vapour for 30min at room temperature (the optimum chamber –saturation condition).The development distance was 7cm. Approximately 10mL mobile phase (5mL in the through containing the plate and 5mLin other trough) was used for each development, which required 15minAfter development the plate were dried in an oven at 60 0c for 4min. Densitomeritic Scanning was performed with a CAMAG TLC scanner III in reflectance mode at the wave lengths of maximum absorption of 280nm for Domperidone 245nm for paractamol .The slit dimension were length 5mm and width 0.45mm and the scanning rate was 20mms-I.The source of radiation used was the deuterium lamp. Evaluation was liner regression of peak area response against amount of drugs. Win CATs software was used for peak-area measurement and data processing.
Result and discussion
Domperidone and paractamol were separated at RF 0.55 and 0.73 respectively. The method was validated for assay of Domperidone and paractamol in accordance with ICH guidelines [15]
Linearity
Amount of standard solution equivalent to 15,25,33,41,and 45 ng Domperidone per band and 850,1300,1700,2100,and 2500ng paractamol per band were applied to an HPTLC plate .The plate was developed ,dried, and scanned. A calibration plot was constructed by plotting peak areas against amount of Domperidone and paractamol and the linearity of the response to Domperidone and paractamol was assessed in the concentration range 15-45and 850-2500ng per band respectively. The slope, intercept, and correlation coefficient were also determined. Over the calibration range studied the correlation coefficient for the calibration plots were 0.999 and 0.999 for Domperidone paractamol respectively (Figures3&4)
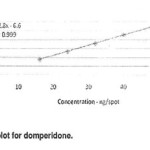 |
Figure 3 Click here to View Figure |
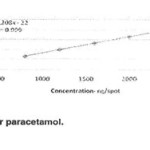 |
Figure 4 Click here to View Figure |
Sensitivity
The sensitivity of measurement of DMP and PAR using the proposed method was estimated as the limit of quantification (LOQ) and the lowest concentration detected under these chromatographic conditions as the limit of detection (LOD). The LOQ and LOD were calculated by using the equations LOQ =3.4×N/B and LOQ=10.1×N/B, where N is the standard deviation of the peak area of the drugs (n=3), taken as a measure of noise, and B is the slops of the corresponding calibration plot. The limits of detection and quantification for DMP were 0.23 and 0.189 ng per band, respectively; those for PAR were 0.308 and 0.933 ng per band.
Precision
Precision was measured by analysis of sample solution at three different concentrations. The precision of the method, as inter day variation (CV [%]) was determined by analysis of Domperidone and paractamol slandered solution in the range 15-45ng and 900-2500 ng per band three times on the same day. Inter day precision (CV [%] was assessed by analysis of the same solution on three days over a period of one week. The results from study of precision are shown in Table 1
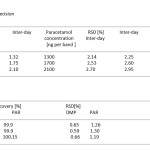 |
Table. 1, 2 Result from determination of precision Click here to View table |
Accuracy
The accuracy of the method was determined by analysis of standard additions at three levels, i.e. multiple-level recovery studies. Referance slandered at three different concentrations (76, 101, and 126%) was added to a fixed amount of pre –analyzed sample and the amount of the drug were analyzed by the proposed method. Results from the recovery studies are given in Table 2.The method phase used enabled good resolution of DMP from PAR (RF 0.55and 0.73 when using wavelengths 280nm and 245 nm for DMP and PAR, respectively). Chromatograms obtained from and sample solutions are shown in Figures5and 6Specificity
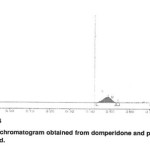 |
Figure. 5 Click here to View Figure |
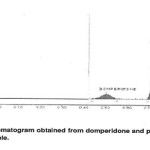 |
Figure. 6 Click here to View Figure |
3.6 Robustness and Ruggedness Statistical analysis showed no significant difference between results obtained by applying the analytical conditions established for the method and those obtained experiments in which some of the conditions were varied slightly. Thus the method was shown to be robust to changes in acetone proportion from 41 to 43% plate were developed 4min after spotting and scanned 10 min after development. The ruggedness of the method was checked by using different analysis and instrument. The relative standard deviation of the result obtained by different analysis using instruments was ≤1.0%.
Stability
To check the stability of the drug by the proposed method, freshly prepared solution of the analysis were applied to the plates and developed after intervals of 3h, 25h, and 49h Decomposition of the drug was not observed during chromatogram development and no change in the peak area of the drug was observed during stability studies.
Conclusions
This HPTLC method for simultaneous analysis of Domperidone and paractamol in tablet dosage forms is, economic, accurate, precise, specific, robust and rapid. It does not suffer from interference from common recipients present in pharmaceutical preparation and can be conveniently adopted for quality –control analysis.
Reference
- Q.B Cass v.v Lima R. V Oliveira, N.M. Cassi)na A>L>G> Deganai, J Chromatogram. B 798 (2003) 275-28
- The Indian pharmacopoeia, v oll. III .The Indian pharmacopeia commission ,5th edn , india; NISCAIR press, 2007 , p1821-23
- A Riedel, cs Leopold, Pharmazie 60 (2005) 126-130.
- M Tuncel. D Dogrukol, Pharmazie52 (1997) 37-74
- JCL Alives, RJ poppi . Anal. Chim . Acta 642 (2009) 212-216
- ICH/CPMP Guidelines Q2BValidation Q2B, Validation of analytical Procedures; methodology, Geneva, Switzerland, 1996.
- CSP.satry, p y. Naidu S S N Murty, Talanta 44 (1997) 1211-1217
- The Indian pharmacopoeia, voll, The Indian pharmacopoeia commission, 5th edn, Indian: NISCAIR press, 2007, p1051-52
- M kobyliska, k kobyliska, chromatogram B 744(2000) 207-212.
- S N Dhumal, PMDikshit, I. I. Ubharay, B.M.Mascarcuhas, C. U. Gaitonde, IndianDrugs28 (1991) 565-567.

This work is licensed under a Creative Commons Attribution 4.0 International License.
![]()
A New Edition of Web of Science
Journal Impact Factor
2022: 0.5
Five Year: 0.8
Journal is Indexed in

Cabells Whitelist
![]()


