Synthesis, Physico- chemical, Spectral, and X-ray Diffraction Studies of Zn(II) Complex of Pioglitazone – A New Oral Antidiabetic Drug
Om Prakash1*, S. A. Iqbal2 and G. Jacob3
1Department of Chemistry, Saifia Science College, Barkatullah University, Bhopal-462001 (India) 2Crescent College of Technology Nabi Bagh, Karond, Bhopal-462038, India 3Blyth Academy, Department of Science, Lawrence Park, 3284, Toronto, Ontario, Canada
Article Received on :
Article Accepted on :
Article Published : 28 Oct 2013
Present paper deals with the synthesis, spectral characterization and X-ray diffraction study of Zn(II) complex with Pioglitazone a new oral antidiabetic drug. The conductometric titration using monovariation method indicate that complex is ionic and L2M type which was further confirmed by Job’s method of continuous variation as modified by Turner and Anderson. Analytical data agree with the molecular formula of complex viz. [(C19H19N2O3S)+2 Zn]2Cl-. Structure of complex was assigned as tetrahedral, in which ligand molecules lies horizontally joining the central Zn(II) atom, supported by IR, 1H NMR and Mass studies. X-ray diffraction data also supports the complex formation and symmetry of complex.
KEYWORDS:Pioglitazone;antidiabetic drug;complex, IR;1H NMR;Mass and X-ray diffraction
Download this article as:| Copy the following to cite this article: Prakash O, Iqbal S. A, Jacob G. Synthesis, Physico- chemical, Spectral, and X-ray Diffraction Studies of Zn(II) Complex of Pioglitazone – A New Oral Antidiabetic Drug. Orient J Chem 2013;29(3). doi : http://dx.doi.org/10.13005/ojc/290331 |
| Copy the following to cite this URL: Prakash O, Iqbal S. A, Jacob G. Synthesis, Physico- chemical, Spectral, and X-ray Diffraction Studies of Zn(II) Complex of Pioglitazone – A New Oral Antidiabetic Drug. Orient J Chem 2013;29(3). Available from: http://www.orientjchem.org/?p=323 |
Introduction
Pioglitazone HCl (PLZ) Fig.1, ((±) ‐5‐{p‐[2‐(5‐ethyl‐2‐pyridyl)ethoxy] benzyl} ‐2, 4 ‐thiazolidinedione hydrochloride) is an oral antidiabetic agent used in the treatment of type 2 diabetes mellitus also known as non‐insulin‐dependent diabetes mellitus1 (NIDDM) or adult‐onset diabetes. Pioglitazone decrease insulin resistance in the periphery and liver, resulting in increased insulin dependent glucose disposal and decreased hepatic glucose output. Currently, it is marketed under the trade name Actos®2. It is a white or almost white crystalline, odourless powder, practically tasteless, insoluble in water and alcohols, but soluble in 0.1 N NaOH; it is freely soluble in dimethylformamide. It exhibits slow gastrointestinal absorption rate and inter individual variation of its bioavailability3. A survey of literature reveals that metal complexes of many drugs have been found to be more effective than the drug alone4 therefore, much attention is given to the use of thiazolidinedione hydrochloride due to their high complexing nature with essential metals. Fig.2 shows the enolization nature of complex formation . Zinc is an essential trace metal, so we get it through the food we eat. Next to iron, zinc is most common mineral in the body and is found in every plant and animal cell.5 It has been used since ancient times to heal wounds and plays an important role in the immune system, reproduction, growth, vision, blood clotting, proper insulin and thyroid function6-7
Chelates of streptomycin are obtained by adding aqueous solutions of zinc salts to the solution of streptomycin at pH 9.0 (loc.cit). Zinc complex of sulpha drugs have been prepared and studied by Salil et al.,8 Bipin et al.,9 Sharma et al., 10 Iqbal and co-workers 11-13 and compare the antidiabetic properties of zinc complex with the parent drugs.
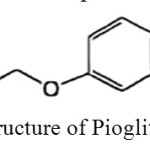 |
Fig.1: Structure of Pioglitazone HCl Click here to View figure |
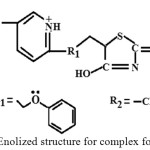 |
Fig. 2 Enolized structure for complex formation. Click here to View figure |
EXPERIMENTAL
Ligand- Metal ratio
To confirm the ligand metal ratio, conductometric titration using monovariation method were carried out at 27 ±1 ºC, 0.005M solution of pioglitazone hydrochloride drug was prepared in DMF. Similarly, solution of metal salt ZnCl2 was prepared in the ethanol of 0.01M concentration. 20ml of ligand was diluted to 200ml with the same solvent. The ligand was titrated against metal salt solution using monovariation method. Conductance was recorded after each addition, graph is plotted between corrected conductance and volume of metal salt added. From the equivalence point in the graph it has been concluded that the complex formation has taken place in the ratio of 2:1 (L2M). Stability constant and free energy change were also calculated using Job’s method14 of continuous variation modified by Turner and Anderson 15 Fig. 3 (a, b).
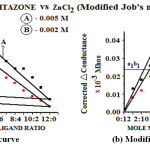 |
Fig. 3- (a) Job’s curve (b) Modified Job’s curve. Click here to View figure |
Material and Reagents
All chemicals used were of analytical grade and of highest purity. They include pure sample of pioglitazone HCl with molecular formula (C19H20N2O3S.HCl), received from Morepen Laboratories Limited Parwanoo, Distt. Solan (H. P.) India. The metal salt of ZnCl2 obtained from Hi media Laboratory, Mumbai, India. Ethanol and DMF were used as a solvent.
Synthesis of Complex
A weighed quantity of “Pioglitazone” (2 mol) was dissolved separately in minimum quantity of DMF. Zinc solution was prepared by dissolving separately in the ethanol. Ligand solution was added slowly with stirring into the solution of metallic salt at room temperature; maintain the pH between 6.0 to 6.5 by adding dilute NaOH solution. On refluxing the mixture for 3-4 h at 70 oC and on cooling, white colored crystals were obtained which were filtered off, washed well with DMF and finally dried in vacuum and weighed (yield 51.08%).
Instrumentation
Molar conductance of solid complex in DMF was measured by using Systronics Digital Conductivity meter. Melting point was determined by Perkin Elmer model melting point apparatus and is uncorrected. The elemental analysis of the isolated complex was carried out by using Coleman analyzer model at the Departmental Micro Analytical Laboratory, CDRI, Lucknow, India. IR spectra of ligand and complex were recorded with Perkin Elemer Model 577 Spectrophotometer in the range of 4000-450 cm-1 as KBr pellets CDRI, Lucknow, India. 1H NMR spectra of the ligand and isolated complex were recorded on a Bruker DRX-300 Spectrophotometer and d6-DMSO was used as solvent CDRI, Lucknow, India. X–ray diffraction studies were carried out by X–ray diffractometer model with 45kV rotating anode and Cukα (1W=1.54060A°) radiation at Punjab University, Chandigarh, India.
Mass spectra of zinc complex was recorded at CDRI, Lucknow, India which provides information about the complex by examining the fragmentation pattern and total mass of the complex. Proposed structure for the isolated complex (Fig.-4) are also supported by mass spectral studies of Mc Cullagh et al., 16 Bayliss and Lashin.,17 Windig et al.,18 Andrew.,19 Mc Lafferty,20 Iqbal et al.,21 .
RESULT AND DISCUSSION
Physico-chemical Characterstics of “Pioglitazone”- Zinc complex
Molecular formula [(C19H19N2O3S)+2Zn]2Cl–, Mol.wt:392.90; Colour:White; Yield:51.08%; m.p:197oC; C, 53.61 (53.50), H, 4.69 (4.48), N, 6.57 (6.52), S,7.53 (7.36), Metal,7.68 (7.63), Cl, 4.18 (3.94), Log K= 11.76 (L/mole), –ΔF= –16.19 (K cal/mole).
Infra-red Spectral Studies
The IR spectrum 22-24of isolated complex were recorded within the range 4000-400 cm-1. Assignments of the infrared spectral bands are based on literature. IR spectrum of PLZ- Zn complex (Fig. 4) shows important bands due to n(M-O) 509±10 cm-1, v (Aromatic C-H streatching) 771 cm-1, n(C=O) 1623 cm-1, n(C-H streatching) 2736±20 cm-1, (C-H streatching) 2850±20 cm-1, n(Ar-H streatching) 3095 cm-1,n(N-H) 3348 cm-1, n(N-H) 3476 cm-1. The proposed structure for the isolated complexes is also supported by IR absorptions Cotton,25 C.N.Rao,23 Nakamotto26 Bellamy,27 Weissberger,28
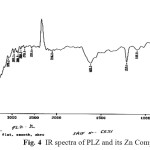 |
Fig. 4 IR spectra of PLZ and its Zn Complex Click here to View figure |
1H NMR Studies
Assignment of “Pioglitazone”- Zinc complex, molecular formula [(C19H19N2O3S)+2 Zn]2Cl– (M.W.=851.17), δ8.72 (s,1H,2-pyridine), δ8.39-8.42 (d,1H, 2-pyridine), δ7.95-7.98(d1H, 2-pyridine), δ7.12-7.15(d,2H, 2-CH2-Benzene), δ6.85-6.88(d, 2H, 2-CH2-Benzene) δ4.84-4.88(m,1H methine-CH), δ4.36-4.41(t, 2H methylene-CH2), δ3.46-3.93(t, 2H methylene-CH2), δ3.01-3.39(d, 2H methylene-CH2), δ2.50-2.80(s, Residual solvent DMSO-d6), δ1.25(t,3H methyl-CH3) respectively. The proposed structure for the isolated complex (Fig-5) is also supported by Slichter29 (1963), Akit30 (1973), Siewers31 (1973), Dury et al.,32(2012) Rathod et al.,33(2012)., Jacob and Iqbal et al.,34 Budhani et al.,35.
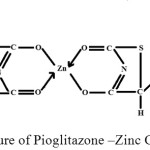 |
Fig 5- Structure of Pioglitazone –Zinc Complex. Click here to View figure |
Mass Spectral studies
Mass spectra represents the intensities of signals at various m/z values. It is highly characteristic of the compound that no two compounds can have similar mass spectra. It provides information regarding the molecular structure of organic and inorganic compounds. In present paper we studied the “Pioglitazone”- zinc complex and assignments are:- Molecular formula of complex [(C19H19N2O3S)+2Zn]2Cl–, (Mol.Wt.=851.17), m/z 850 due to [(C19H19N2O3S)+2Zn]2Cl– or (ML2∙)+. Molecular ion peak (m+.); m/z 357 due to [C19H19N2O3S)]+ . base peak ion 100% relative abundance, m/z 223 due to [C10H7NO3S]+. m/z 134 due to [C9H12N]+., m/z 134 due to [C8H18N]+. radical ion.
X-Ray Diffraction Studies
X-ray diffraction studies also confirm the complex formation due to new bonds. 36-40 . The number of peaks in Pioglitazone are more as compared to their zinc complex Fig.6 (a, b) which shows the formation of complex. Moreover, all the reflections are new ones and the patterns are fairly strong. On comparing the pattern obtained with available literature, it is evident that its pattern is not in good agreement with available information and thus confirms the formation of totally new complex . The X-ray pattern have been indexed by using computer software (FPSUIT 2.0V) and applying interactive trial and error method keeping in mind the characteristics of the various symmetry system, till a good fit was obtained between the observed and the calculated Sin2θ value. The unit cell parameters were calculated from the indexed data, cell data and crystal lattice parameters, Zn(II) indicates complex attributed to orthorhombic crystal system. The particle size is 19.16 microns of “Pioglitazone”-zinc complex respectively, which is calculated from x-ray line broadening using the Scherrer formula Dhkl =κλ/βhkl cosθ, where D is the particle diameter in A° , κ is a coefficient and is equal to 0.89 here, β is the half-maximum line width, and λ is the wavelength of x-rays, porosity is 0.10% calculated by formula and volume of the unit cell is 14016.31 A° calculated by Volume(Å), = abc where a, b and c are lattice parameters . Density = is found 0.0607 gcm-3 for “Pioglitazone”-zinc complex respectively. Space group is Pmmm and α=90°, β=90°, γ =90°.
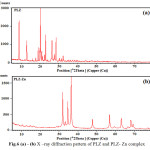 |
Fig.6 (a) – (b) X –ray diffraction pattern of PLZ and PLZ- Zn complex Click here to View figure |
Conclusion
For supporting the proposed structure of zinc complex with “Pioglitazone” initially Job’s method of continuous variation as modified by Turner and Anderson was conducted which indicate 2:1 ligand:metal ratio, moreover stability constant and free energy change was also calculated. Analytical data agree to the molecular formula viz. [(C19H19N2O3S)+2Zn]2Cl–. For the complexation of “Pioglitazone” with zinc, it was concluded that the “Pioglitazone” undergoes enolization before complexation so as to form a hexacyclic hetrocyclic chelate ring. The formation of complex through enolization is also supported from the frequency of IR, NMR and Mass spectral studies. Molar Conductance values of complex support the ionic structure of the complex. The thiazolidinedione unit inside the coordination sphere has a positive charge while Cl– occupies the outer place of the coordination sphere. A detailed study of X-Ray also supports the complex formation and the various values like particle size, porosity, volume of unit cell, density as well as crystal system was evaluated and discussed.
Acknowledgements
The authors are thankful to UGC (New Delhi) for the financial support and CDRI Lucknow, P.U. Chandigarh for providing IR, NMR, Mass and X-Ray data.
References
- Abbasi, F., Lima, N. K., and Reaven, G. M., Metabolism.,; 58, 373‐378(2009.
- Lotfy Saber AMR., Pak. J. Anal. Environ. Chem; 9,118‐121(2008).
- Kouichi, Diab. Res. Clin. Pract., 68, 250-257 (2005).
- Sharma, S., Iqbal, S. A., and Bhattacharya, M., Orient. J. Chem., 25 (4), 1101-1104 (2009).
- Mills, C. F., Zinc in hman Biology (Springer Verlag)., (1989).
- Phipps, D. A., Metals and Metabolism, Oxford university press, P-63, (1976).
- Harrap, H. J., Arch Oral Biol., 29: 87 (1984).
- Salil, A. A., Hamdani, Al. and Shaker, S. A., Orient J. Chem., 27 (3), 835-845 (2011).
- Bipin, B., Mahapatra and Pramod K., J. Indian Chem. Soc., 69 (1), 14 (1992).
- Sharma, R. N., Sharma K. P. and Dixit S. N., Orient. J. Chem., 26 (1), 283-286 (2010).
- Iqbal, S. A., Jose S., and Zaafarany I., Orient. J.Chem., 28 (1), 613-618 (2012).
- Iqbal, S. A., and Zaafarny, I., Orient. J.Chem., 28(1), 613-618 (2012).
- Tawkir, M., Krishan B., Iqbal S. A., and Zaafarany I., Orient. J.Chem, 28 (1), 93-98 (2012).
- Job, P., Ann.Clim., 113, 10 (1928).
- Turner, S. E., and Anderson R. C., J. Am.Chem. Soc., 912,71(1949).
- M. Mc Cullagh, J., Castro-Perez Enhanced determination of the metalbilic fate of drugs using UPCL/a0-TOF MS, Waters Corporation, 2005.
- Bayliss, M. A., www.acdlabs.com /2006/asma06automating.
- Windig, W., Phalp J. M., Payne A.W., Analytical chemistry 68, 3602-3606 (1996).
- Andew, V. P., Rajtar T., Chen H. S., Moskovets E. V., Ivanov A. R., Karger B. LA, Analytical Chemistry, 75, 6314-6326 (2003) .
- Lafferty, Mc., and Turecek., Interpretaiton of mass spectra, 4th Ed. (1993).
- Iqbal, S. A., and Zaafarny, I., Orient. J.Chem., 28, 613-618 (2012).
- Dyer, J., “Application of Absorption Spectroscopy of Organic Compounds” Prentice Hall of India Pvt. Ltd. Fourth Printing., 36, (1978).
- Rao, C. N. R., Chemical Applications of Infrared spectroscopy, Academic press., NY 258, (1970).
- Chandran, A., Varghese, H. T., Yohannan, C., and Rajendran, G., Orient. J. Chem., 27 (2), 611-617 (2011).
- Cotton, I. A., Modern co-ordination chem. Interscience pub. Ed. (1960)
- Nakamotto, K., Infra-red spectra of Iorganic and co-ordinationCompounds, John Willey and son’s NY.(1963)
- Bellamy, L. J., The Infra-red spectra of complex molecules. Matheun & Co.Ltd. London (1964).
- Weissberger, A.,“Chem. Application of spectroscopy”, Vol. XI Inter Science Publ. New York. (1956)
- Slichter, C. P., Principles of magntic resonance, Harper and Row (1963)
- Akit, J.W., NMR and chemistry an introduction to nuclear magnetic resonance spectroscopy Champan and Hall, (1973)
- Siewers, R. E., Nuclear magnetic resonance shift reagents academic, New York (1973)
- Dury., and Al-Jiburi.,Orient. J. Chem., 28 (2), 781-786 (2012).
- Rathod, K. M., Orient. J. Chem., 26(3), 1163-1166 (2010).
- Jacob, G., Iqbal, S. A. and E. H. El- Mossalamy., Asian J. Chem., 23(2), 573-576(2011).
- Budhani, P., Iqbal, S. A., Malik, S., Bhattacharya, M. and Mitu, Liviu., J. of Saudi Chem. Soc., 14, 281-285(2010).
- Panday, S. N., Sriram, D., Nath, G., and Clereq, E. De. Arzneim-forsch/Drug Res., 50, 55(2000).
- Hollo, B. S., Poojary, K. A., and Kollurya, B., II, Farmaco., 51,793(1996).
- Kidwai, M., Sapra, P., Mishra, P., Saxena, R. K., and Sing, M., Bio org. Med. chem., 9,217(2001).
- Henry, N. F. M., Lipson, H., and Wooster, W. A., Interpretation of X-ray diffraction photograph., 81(1851).
- Prakash, Om., Krishan, B., and Jacob, George., Orient. J. Chem., 29 (2),823-828 (2013).

This work is licensed under a Creative Commons Attribution 4.0 International License.
![]()
A New Edition of Web of Science
Journal Impact Factor
2022: 0.5
Five Year: 0.8
Journal is Indexed in

Cabells Whitelist
![]()


