Frequency-dependant dielectric characteristics and conductivity behavior of Sr1−x(Na0.5Bi0.5)xBi2Nb2O9 (x = 0.0, 0.2, 0.5, 0.8 and 1.0) ceramics
Hana NACEUR*, Adel MEGRICHE , Mohamed EL MAAOUI
Laboratory of Applied Mineral Chemistry, Department of Chemistry, University Tunis ElManar, Faculty of Sciences, Campus 2092, Tunis, Tunisia.
DOI : http://dx.doi.org/10.13005/ojc/290311
Article Received on :
Article Accepted on :
Article Published : 28 Oct 2013
This study reports the frequency effect on the dielectric properties and electrical conductivity of Sr1−x(Na0.5Bi0.5)xBi2Nb2O9 (x = 0.0, 0.2, 0.5, 0.8 and 1.0) ceramics, at various temperatures. A strong low frequency dielectric dispersion was observed in these ceramics. The dielectric constant, the tangent loss and the ac electrical conductivity measured as function of frequency have been found to fit to the Jonscher’s dielectric dispersion relations. Electrical measurements were influenced by two mechanisms, polarization due to the carrier displacement in the low frequency region and the contribution from the lattice at high frequencies. The ac conductivity behavior is due to the hopping of oxygen vacancies. Detailed analysis of impedance spectrum suggested that the electrical properties are strongly frequency dependent.
KEYWORDS:Ceramics;Sintering;Light scattering;Dielectric Properties
Download this article as:| Copy the following to cite this article: NACEUR H, MEGRICHE A, EL MAAOUI M. Frequency-dependant dielectric characteristics and conductivity behavior of Sr1−x(Na0.5Bi0.5)xBi2Nb2O9 (x = 0.0, 0.2, 0.5, 0.8 and 1.0) ceramics. Orient J Chem 2013;29(3). doi : http://dx.doi.org/10.13005/ojc/290311 |
| Copy the following to cite this URL: NACEUR H, MEGRICHE A, EL MAAOUI M. Frequency-dependant dielectric characteristics and conductivity behavior of Sr1−x(Na0.5Bi0.5)xBi2Nb2O9 (x = 0.0, 0.2, 0.5, 0.8 and 1.0) ceramics. Orient J Chem 2013;29(3). Available from: http://www.orientjchem.org/?p=278 |
Introduction
Ferroelectric ceramics are the heart and soul of several multibillion dollar industries, ranging from high-dielectric constant capacitors to later developments in piezoelectric transducers, positive temperature coefficient devices and electro-optic light valves [1]. The bismuth layered ferroelectric materials have many applications in a variety of devices that include piezoelectric, pyroelectric, microelectromechanical and non-volatile random access memory (NVRAM) [2]. Among SrNb2Bi2O9 and its solid solutions were intensively studied for many years [3-7].
Impedance spectroscopy has been extensively employed in electroceramics, due to its capabilities to resolve grain boundary from bulk electrical properties, to calculate materials constants (conductivity and dielectric constant), and to probe the electrical homogeneity [8].
As the frequency of the signals being propagated through such materials increases, the frequency dependent material properties become very important. The dielectric constant and tangent loss vary as a function of frequency. They need to be accurately extracted in a broad frequency range for successful design of high performance systems.
Relatively, few studies reported the frequency dependant electrical for SBN and its solid solutions. A previous work by Harira et al. for SrBi2Nb2O9 ceramics have shown that a low frequency dielectric dispersion is encountered in these ceramics and the conductivity is essentially due to oxygen vacancies. The detailed frequency dependence of dielectric properties is still lacking.
In this paper, we present the dielectric measurements carried out on Sr1−x(Na0.5Bi0.5)xBi2Nb2O9 ceramics, as a function of frequency at various temperatures. An attempt has been made to rationalize the dielectric behavior in terms of Jonsher’s model [9].
Experimental section
Dielectric measurements were achieved using a HP 4192A impedance gain phase analyzer operating in the frequency range 10 Hz-13 MHz. The capacitance and conductance measurements have been evaluated to obtain the dependence of permittivity (ɛ) and (ɛ), tangent loss (tan) and ac electrical conductivity (ac). The complex permittivity can be written as [10]:
ɛ*= ɛ’-i ɛ’’ (1)
Where ɛ’ and ɛ’’ are the real and imaginary parts of complex permittivity, and i is the imaginary root of -1.
The real part of the complex permittivity, the dielectric constant (ɛ’), at the various frequencies is calculated using the measured capacitance values at the strong accumulation region from the relation [11]:
ɛ’= C/C0= Cdi/ ɛ0A (2)
Where C is the measured capacitance, C0 is the capacitance of an empty capacitor, A is the rectifier contact area of the structure in cm-2, di is the interfacial insulator layer thickness and ɛ0 is the permittivity of free space charge (ɛ0= 8.85 × 10⁻¹⁴ F/cm). In the strong accumulation region, the maximal capacitance of the structure corresponds to the insulator capacitance (Cac = Ci= ɛ’ɛ0A/di) (3)
The imaginary part of the complex permittivity, the dielectric loss (ɛ’’), at the various frequencies is calculated using the measured conductance values from the relation:
ɛ ‘’ = G/ωCi = Gdi / ɛ0ωA (4)
Where G is the conductance of the device and ω is the angular frequency.
The tangent loss (tanδ) can be expressed as follows [11]:
tan δ= ɛ ‘’/ ɛ ‘ (5)
The ac electrical conductivity (σac) of the dielectric material can be given by the following equation [11]:
σac = ωC tan δ (di/A)= ɛ ‘’ω ɛ0 (6)
Results and discussion
The frequency dependence of ɛ’ and tanδ for Sr1−x(Na0.5Bi0.5)xBi2Nb2O9 samples in 100 Hz- 100 kHz frequency range on a log–log scale and at various temperatures are shown in Fig. 1 and Fig. 2 . It’s distinctly observed that the dielectric constant and the tangent loss decrease with the increase in frequency. The decrease in the dielectric constant (ɛ’) can be explained on the basis of decrease in polarization with the increase in frequency. It’s well known that, polarization of a dielectric material is the sum of the contributions of dipolar, electronic, ionic and interfacial polarizations. At low frequencies, all the polarizations respond easily to the time varying electric field but as the frequency of the electric field increases different polarization contributions filters out, as a result, the net polarization of the material decreases which leads to the decrease in the value of ɛ’. Further, the decrease of tanδ with the increase in frequency can be explained by Debye formula [12]. According to this formula, at lower frequencies tanδ is inversely proportional to frequency which explains the decrease in tanδ with frequency. In addition, at high frequencies the values of ɛ’ become closer to the values of ɛ’’ due to the interface states cannot follow the ac signal at enough high frequency [13].
It’s observed that the dielectric constant (ɛ’) and the tangent loss (tanδ) show dispersion especially at low frequencies and at temperatures below the ferroelectric-paraelectric transition region (Transition temperatures for all solid solutions were stated in our previous work [14]). Such strong dispersion in the dielectric measurements, appear to be a common feature in ferroelectrics associated with non -negligible ionic conductivity and is referred to as the low frequency dielectric dispersion (LFDD) [15]. The low frequency slope of the curve is close to -1 for all solid solutions indicating the predominance of the dc conduction in this region [16]. Therefore, the dielectric dispersion with frequency is significant at higher temperatures and low frequencies. However, the lack of strong dispersion in the dielectric constant at high frequencies suggests that this phenomenon is coupled with space charge effects [17]. The dispersion in the tangent loss is stronger than in the real part permittivity ɛ’ implying that it is influenced by dc conductivity [16].
To better understand these phenomena, The complex dielectric constant as a function of the frequency ω in accordance with the Jonscher’s power law is given by the following expression [9, 18]:
ɛ*=ɛ’-ɛ’’= ɛ∞+ (σ/ ɛ0ω) + [(a(T)/ɛ0) ( i ωn(T)-1 )] (7)
Where ɛ∞ is the ‘high frequency’ value of the dielectric constant, n(T) is the temperature-dependent exponent and a(T) determines the strength of the polarizability arising from the universal mechanism in question.
The real and imaginary parts of the complex dielectric constant are given by the following relations:
Where the first term in Eq. (8) determines the lattice response and that in the Eq. (9) corresponds to the dc conduction part, while the second term in both the equations reflects the charge carrier contribution to the dielectric constant. The temperature and frequency dependencies of the dielectric constant ɛ’ could be explained by Eq. (4). The charge carrier term
![]()
dominates at low frequency and ɛ∞ is negligible. Therefore, for a constant n, Eq. (8) yields a straight line with a slope equal to n-1 in the double logarithmic plot of ɛ’ and frequency. At high frequencies the charge carriers fail to respond to the external field, therefore the measured dielectric constant is due to the contribution from the lattice polarization. The space charge is known to saturate up to 1 KHz [19]. This accounts for a linear decrease in the low frequency region and a frequency-independent plateau region at high frequencies.
As [A(T) (a(T)] increases with increase in temperature [20], the charge carrier term becomes more and more prominent at high temperatures, thereby resulting in the low frequency dielectric dispersion. An anomalously strong dispersion of ɛ’ near Curie temperature (TC) suggests the coupling between the charge carriers and the lattice [18].
Careful analysis of Figs. 1 and 2 indicates the existence of two slopes corresponding to -1 in the low frequency region, indicating the predominance of the dc conductivity in this frequency region, and – (1-n) in the high frequency region. In fact, as the dc conductivity term increases with increase in temperature, the second term in Eq. (9) is totally over shadowed by the first term. So at low frequencies and high temperatures, the dc conductivity term dominates and yields a slope of -1, which indeed is consistent with the data shown in Figs. 1 and 2.
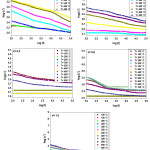 |
Fig.1. Dielectric constant of Sr1-x (Na0.5Bi0.5) x Bi2Nb2O9 (x=0.0; 0.2; 0.5; 0.8; 1.0) Click here to View figure |
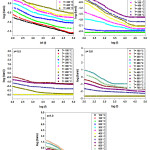 |
Fig.2. Tangent loss of Sr1-x (Na0.5Bi0.5) x Bi2Nb2O9 (x=0.0; 0.2; 0.5; 0.8; 1.0) as function of frequency. Click here to View figure |
Besides, it’s shown from Figs. 1 and 2 that the substitution of (Na0.5Bi0.5) resulted in reduced dielectric constant ɛ’ throughout the frequency range. This reduction could be attributed to the electronic polarization due to the smaller ionic radii of (Na+ Bi3+) compared to Sr2+ [21].
The tangent loss of doped samples was found also to be smaller than that of SBN except at low frequencies (Fig. 2). It’s known that the tangent loss in ferroelectrics is due to a combination of space charge polarization and domain wall relaxation [22]. It’s possible that the (Na+Bi3+) doping may change the mobility of domain walls. This behavior was widely observed in isotropic perovskite ferroelectrics, such as CaxSr1-xBi2Nb2O9 and LaxSr1-xBi2Nb2O9 systems [3].
While dealing with a ferroelectric material associated with charge carriers, it is preferable to obtain the data in terms of the ac complex impedance or conductivity instead of the dielectric loss to understand their influence on the ferroelectric properties. Fig.3 shows the frequency dependence of ac conductivity (σac) at various temperatures. It indicates the existence of low frequency independent plateau-like region [σdc] and subsequently the conductivity increases with increase in frequency, varying approximately as a power of frequency (ωn) at all the temperatures. This behavior was attributed to non-relaxor behavior of the material [16].
 |
Fig.3. Double logarithmic plots of the ac conductivity versus frequency at various temperatures for Sr1-x (Na0.5Bi0.5) x Bi2Nb2O9 (x=0.0; 0.2; 0.5; 0.8; 1.0). Click here to View figure |
For all solid solutions, the conductivity spectra obey the same law. In fact, the frequency dependence of conductivity or so-called universal dynamic response (UDR) of ionic conductivity is related by a simple expression given by Jonsche’s power law [23]:
σac(ω)= σdc+A ωn (10)
Where σac is the ac conductivity, σdc is the limiting zero frequency conductivity, A is a pre-exponential constant, ω = 2пf is the angular frequency and n is the power law exponent, where 0 < n < 1.
In fact, this typical response is that at low frequencies the bulk ac conductivity is frequency independent σ(w), but at higher frequencies the ac conductivity increases, following power law behaviour such that σ(ω)αωn. This power law is a universal property of materials and is related to the dynamic of hopping conduction [24].
According to Funke [25] the value of n might have a physical meaning; if n<1, charge carriers takes a translational motion with a sudden hopping, when n>1, would mean a localized hopping of the species (small hopping without leaving the neighborhood) [26]. This indicates that the conduction process is a thermally activated phenomenon. According to Jonscher, the origin of the frequency dependent conductivity lies in the relaxation phenomenon arising due to mobile charge carriers. The low frequency dispersion thus is associated with ac conductivity, whereas almost frequency independent (especially at higher temperatures). Conductivity at high frequencies corresponds to the dc conductivity of the material. The temperature at which the grain resistance dominates over grain boundary is marked by change in slope of conductivity with frequency. The frequency at which the slope changes is known as hopping frequency which corresponds to polaron hopping of charges species. The oxygen vacancies may act as polaron [27]. As the temperature increases, the hopping frequency shifts towards lower side. It is observed from Fig. 3 that the curves for all solid solutions show two threshold frequencies, f1 and f2, separating the entire variation into three regions: Low frequencies region, f < f1, in which the conductivity is almost frequency-independent( σdc). Moderate frequencies region, f1 < f < f2; the conductivity increases linearly with the frequency. This reveals that the conduction mechanism in this region corresponds to the translational hopping motion [28]. High frequencies region, f > f2, as well the conductivity increases linearly with the frequency. It reveals that the conduction mechanism in this range of frequency corresponds to the well-localized hopping and/or reorientational motion [29]. In fact, the hopping takes place by charge carriers through trap sites separated by energy barriers of various heights. The number of charge carriers, which have high relaxation time due to higher energy barrier, responds in the low-frequency regime might be less in number, and hence, the conductivity is low at low frequencies (ac) conductivity is almost independent of the frequency below 1 kHz. On the other hand, the number of charge carriers with low barrier heights is more and they respond easily with the high frequency and show higher conductivity at high frequencies.
It’s also noticed from fig. 3 that the variation of the ac conductivity with different concentration of the (Na0.5Bi0.5) dopant indicates that the nature of the electrical transport (conduction) is governed by both the doping material and the concentration because the different ions doped at the A-site plays an important role in conduction mechanism. The increment or decrement in the conductivity values may possibly be related to the structural disordering and imperfection/defects, which arises due to the substitution [30].
Conclusion
Frequency dependence of dielectric parameters and electrical conductivity for Sr1−x(Na0.5Bi0.5)xBi2Nb2O9 (x = 0.0, 0.2, 0.5, 0.8 and 1.0) ceramics has been studied.
A dielectric dispersion in all samples was found, and is due to distribution of interface states as well as ionized space charge carriers such as oxygen vacancy related defects. Electric al conductivity as function of frequency behavior indicates the existence of low frequency independent plateau-like region and it increases at high frequency region. The frequency dependence of electrical properties, called universal dynamic response is related by Jonscher’s power law.
References
- G.H. Haertling: J. Am. Ceram. Soc. 82 (1999) 797.
- K. Amanuma, T. Hase, and Y. Miyasaka: Appl. Phys. Lett. 66 (1995) 221.
- M.J. Forbess, S. Seraji, Y. Wu, C.P. Nguyen, and G.Z. Cao: Appl. Phys. Lett. 76 (2000) 2934.
- B.H. Venkataraman, and K.B.R Varma: J. Phys. Chem. Solids. 64 (2003) 2105.
- B.H. Venkataraman, and K.B.R. Varma: Solid State Ionics 167 (2004) 197.
- P. Goel, and K.L. Yadav: Physica B 382 (2006) 245.
- D. Dhak, P. Dhak, and P. Pramanik: Appl. Surf. Sci. 254 (2008) 3078.
- J-H. Hwang, T.O. Mason, and E.J. Garboczi: Mater. Res. Soc. 457 (1997) 27.
- A.K. Jonscher, R.M. Hill, and C. Pickup: J. Mater. Sci. 20 (1985) 4431.
- C.P. Smyth: Acta Cryst. 9 (1956) 838.
- I.M. Afandiyeva, I. Dökme, Ş. Altındal, M.M. Bülbül, and A. Tataroğlu: Microelectron. Eng. 85 (2008) 247.
- H. Birey: J. Appl. Phy. 49 (1978) 2898.
- D. Maurya, J. Kumar, and Shripal : J. Phys. Chem. Solids 66 (2005) 1614.
- H. Naceur, A. Megriche, and M.E. Maaoui : J. Alloys. Compd. 546 (2013) 145.
- Z. Lu, J.P. Bonnet, J. Ravez, and P. Hagenmuller : Solid State Ionics 57 (1992) 235.
- K.S. Rao, P.M. Krishna, D.M. Prasad, T.S. Latha, and C. Satyanarayana: Indian J. Eng. Mater. Sci. 15 (2008) 215.
- K.B. Tan, F.G. Anna, and Z. Zainal: J. Phys. Sci. 19 (2008) 53.
- M.P. Dasari, K.S. Rao, P.M. Krishna, and G.G. Krishna: Acta Phys. Pol. A 119 (2011) 387.
- V. Shrivastava, A.K. Jha, and R.G. Mendiratta: Mater. Lett. 60 (2006) 1459.
- Z. Lu, J.P. Bonnet, J. Ravez, and P. Hagenmuller : Eur. J. Solid State Inorg. Chem. 27 (1991) 363.
- R.D. Shannon: Acta Crystallogr. A 32 (1976) 751.
- Y. Wu, C. Nguyen, S. Seraji, M.J. Forbess, S.J. Limmer, T. Chou, and G. Cao: J. Am. Ceram. Soc. 84 (2001) 2882.
- A.K. Jonscher: Nature 267 (1977) 97.
- S.R. Eliott: Adv. Phys. 31 (1981) 135.
- K. Funke: Solid State Chem. 22 (1993) 111.
- S. Sen, and R.N.P. Choudhary: Mater. Chem. Phys. 8 (2004) 256.
- S. Sumi, P.P. Rao, M. Deepa, and P. Koshy: J. Appl. Phys. 108 (2010) 063718.
- A. Dutta, T.P. Sinha, P. Jena, and S. Adak: J. Non-Cryst. Solids 354 (2008) 3952.
- S. Mahboob, G. Prasad, and G.S. Kumar: Bull. Mater. Sci. 29 (2006) 347.
- R.N.P. Choudhary, and S.K. Barik: Mod. Phys. Lett. B 23 (2009) 2655.

This work is licensed under a Creative Commons Attribution 4.0 International License.
About The Author
![]()
A New Edition of Web of Science
Journal Impact Factor
2022: 0.5
Five Year: 0.8
Journal is Indexed in

Cabells Whitelist
![]()


