Accumulation of Fluoride in Sikar Aquifer and their Removal by Khimp Powder
Radhey Shyam and G.S.Kalwania*
Department of Chemistry, S.K. Government P. G. College Sikar-332001(Rajasthan) India
DOI : http://dx.doi.org/10.13005/ojc/290346
Article Received on :
Article Accepted on :
Article Published : 28 Oct 2013
Accumulation of fluoride in Sikar aquifer is influenced by fluoride rich rocks,pH, cation and anion exchange capacity of aquifer materials, bicarbonates, evaporation and temperature etc. Fluoride is a great calcium-seeking ion and it can be precipitated out in favorable conditions.The khimp plant (Leptadenia pyrotechnica) has sufficient positive (calcium) ions and interacts with negatively charged fluoride ions.Different parameters like effect of pH, agitation time, adsorbent dose and fluoride concentration on adsorption studies have investigated. The equilibrium adsorption data was studied for Langmuir and Freundlich isotherms. The main mechanism is through fluoride precipitation and adsorptiononto khimp powder.
KEYWORDS:dissolution;precipitation;adsorption;khimp powder;fluoride
Download this article as:| Copy the following to cite this article: Shyam R, Kalwania G. S. Accumulation of Fluoride in Sikar Aquifer and their Removal by Khimp Powder. Orient J Chem 2013;29(3). doi : http://dx.doi.org/10.13005/ojc/290346 |
| Copy the following to cite this URL: Shyam R, Kalwania G. S. Accumulation of Fluoride in Sikar Aquifer and their Removal by Khimp Powder. Orient J Chem 2013;29(3). Available from: http://www.orientjchem.org/?p=354 |
Introduction:
Chemically, the fluorine is the most electronegative element and it is always present in a combined state as fluoride because of its high chemical reactivity. The fluoride is a great calcium-seeking element and it can disturb the calcified structure of bones and teeth in the human body at higher concentration resulting dental or skeletal fluorosis (Fordyce et al. 2007;WHO 2006; Rao 2009). World Health Organization (WHO 1996) has recommended the optimum range of fluoride to be as 0.5–1.5 mgL-1. India has 14.1% of total fluoride deposits onthe earth’s crust and the fluorosis is endemic in 17 states(UNICEF 1999).In Rajasthan, 18 out of 32 districts are affected by fluorosis and 11 million of the populations are at risk (Hussain et al. 2010; Shyam and Kalwania 2012). Various studies have indicated prevalence and severity of fluorosis in many districts including Hanumangarh (Suthar et al. 2008), Bhilwara (Hussain et al. 2010), Dungarpur (Choubisa and Sompura 1996), Sriganganagar (Chaudhary et al. 2010), Sikar (Shyam and Kalwania 2012; Shyam and Kalwania 2011 ) etc.
Accumulation of fluoride in Sikar aquifer:
Sikar is a district of India’s largest state, Rajasthan and covered by great Thar Desert. Hot summer, chilly winter with general dryness of the air and a brief monsoon season are the characteristic climatic conditions of the Sikar area. The average minimum and maximum temperature are zero and 48 degree Celsius respectively. Frequent drought and famine conditions are common and as a result ground water is not available even for drinking purposes in most part of the district. No surface water resources are available and all the water needs are met through ground water resources. Scanty rain fall and poor recharging of ground water make this area to be categorised as “overexploited” block. Quaternary geological formation comprising of Alluvium (composed of sand, silt, clay and gravel) is the principal and potential aquifer in the area. The most important mineral deposits in the Sikar are calcite, dolomite and iron ore. Other minerals worked out in the district are fluorspar, soapstone, clay, lime stone and building stones (CGWB 2004; SWRPD 2010). Many area of Sikar city and its surroundings have shown the fluoride level more than the permissible limit (Shyam and Kalwania 2012; Shyam1 and Kalwania 2011; Shyam2 and Kalwania 2011).
Some of the researchers suggested the minerals that influence the hydro-geochemistry of fluoride include apatite (CaF2-3Ca3(PO4)2), cryolite (AlF3-3NaF), fluorspar (CaF2) and silicates such as the phyllo silicates of micas, the doubled chain silicates of amphiboles and the phyllosilicates of clays where F– substitutes forOH– within their octahedral holes (Fantong et al. 2001, Rao andDevadas 2003). The main sources of sulfate are the dissolution of gypsum interlayer in the aquifer matrix producing Ca2+ and SO42- ions in the ground water. The dissolution of dolomite mineral produces HCO3–, Mg2+ and Ca2+ ions in the ground water (Guo et al. 2010; Shyam and Kalwania 2012) and can be expressed by the following reaction.
CaCO3-MgCO3 + 2CO2 + 2H2O → Ca2+ + Mg2+ + 4HCO3–
The probable other sources of bicarbonate are the hydrolysis of alumino-silicates minerals. The amount of bicarbonate accelerates the dissolution of fluoride through a cation exchange process. The sodium ion in ground water replaces calcium ion from mineral like fluorspar leading to the dissolution of fluoride from mineral phases into ground water (Fantong et al. 2010; Guo et al. 2010; Shyam and Kalwania 2012). This type of process is likely favored by the adsorption of calcium and magnesium on clay, micas, schist, gneiss, quartzite etc. The dissolution of fluoride-rich mineral (fluorspar) and cation exchange (Ca2+ and Na+) may be occurring by the following reaction.
CaF2 + 2Na+ + 2HCO3– → CaCO3 + 2Na+ + 2F– + H2O + CO2
During such mineral-water reactions, EC and pH of the solution increase (Fantong et al. 2001; Rafique et al. 2008; Rao 2009; Shyam and Kalwania 2012). Some favourable hydro-chemical conditions for dissolution of fluoride from silicates to ground water has been suggested like alkaline pH, anion exchange (OH– and F–) and cation exchange (Ca2+and Mg2+) capacity of aquifer materials, long residing water in a rock or interaction system and climate (Rao 2009; Fantong et al. 2010; Guo et al. 2010; Shyam and Kalwania 2012). Noppakun et al. (2000) were studied the fluorides from geothermal water in northern Thailand, which was highest compare to sample collected from stream, river, ground water. The average fluoride concentration of the warm ground water samples is higher than that of the cold groundwater samples. This is because high water temperature accelerates the water–mineral reactions in the aquifers, including the dissolution of some fluoride-bearing minerals, such as fluorspar (Guo et al. 2010).It has been observed that low calcium and high bicarbonate alkalinity favor high fluoride content in groundwater (Bulusu and Pathak 1980; Meenakshi and Maheshwari 2006; Shyam and Kalwania 2012).
The fluoride level in the ground water of Sikar may be due to the some geological process such as dissolution of fluoride rich mineral (fluorspar) in the environment of alkaline pH, excess of bicarbonates, evaporation, semi aridity and high temperature.
Defluoridation:
Defluoridation is the process of removal of fluoride ion in drinking water. The process may be classified broadly into adsorption, ion exchange, precipitation (coagulation) and reverse osmosis. Adsorption is an excellent process in which fluoride is concentrated onto adsorbent mass. Many biomass like Azadirachta indica, Ficus religiosa, Acacia catechu (Jamodel et al. 2004),Tinospora cordifolia (Pandey et al. 2012) tamarind (Murugan and Subramanian 2006), tea leaves (Jenish and Methodis 2011), micro algal ( Bhatnagar et al. 2002), Hydrilla (Sinha et al. 2000)and inorganic materials like alum (Nawlakhe and Paramasivam 1993), activated alumina (Bulusu and Nawalakhe 1988;Sivasankari et al. 2010), clays (Malakootian et al. 2011;Lonareet al. 2011;Togarepi et al. 2012), ceramics (Chena et al.2010) etc. have been studied for fluoride removal. Most of the defluoridation techniques have succeeded at pH less than 7.0.The potential determining ion in this process is the hydrogen ion (pH). In acidic medium, hydrogen ion accelerates more positive charge on calcium which favor the adsorption of fluoride becomes more pronounced. Another probable factor is the selectivity. This selectivity factor differentiates between the fluoride and other anions i.e. bicarbonate, chloride, nitrate, sulphate etc. The presence of very high concentration of chloride, nitrate and sulfate decreases the adsorption (Namasivayam and Hoell 2008), but bicarbonates affect this process significantly. Therefore, the extent of adsorption increases at a much higher rate in the acidic medium.
The objective of this study is to remove fluoride ionfrom drinking water by using easily available natural material. Many plants and herbs have been studied, analysed for their fluoride removal capacity and selected the best one i.e. khimp plant. The khimp plant (Leptadenia pyrotechnica) belongs to meliaceae family and is widely distributedthroughout northern Africa and from the Arabian Peninsula east to western India. It also occurs abundantly in the desert region of Rajasthan. Its fruits and stems have been in use since ancient times to treat a number of human ailments. Being highly drought-resistant, it has been widely used for sand dune stabilization in desert area. It is a perennial plant and has 15-20 years life span. The dried stem and fruits has about 20 to 30% fibre, 0.3 to 1.0% calcium and other elements as iron, sodium, potassium, phosphorous etc. It can tolerate high pH and high exchangeable sodium and potassium ions (Bhaduri and Mojumder 2008; Munazir et al. 2012; Singh et al. 2012).
Materials and methods:
All the required reagents used were of A.R. grade. Fluoride stock solution was prepared by dissolving 221 mg anhydrous NaF in 1000 ml de-ionized water (APHA 1989). Fluoride standard solution (10 mg L-1) was prepared by diluting 100 ml stock solution to 1000 ml using de-ionized water. Further, 1.4, 1.2, 1.0, 0.8, 0.6, 0.4, 0.2 and 0.0 mg L-1 fluoride solution were prepared for calibration curve. Thesamples werestirred in the beaker at 800-1200 rpm by magnetic stirrer. The samples were analysed for residual fluoride concentration by SPADNS dye method using double beam UV-VIS spectrophotometer at wavelength of 570nm (APHA 1989).Hydrogen ion concentration (pH) was measured by water analyzer kit. Adsorption isotherm studies were carried out taking different initial concentrations of fluoride at constant adsorbent dosage.Langmuir and Freundlich models were applied to the adsorption isotherm.
Results and discussion:
The mature and green khimp stems used in the present investigation were collected from the herbal park of S. K. college, Sikar. It was washed with water to remove dust and sundriedfor a week. The dried stems were cut into small pieces and powdered. Further, the powder wassieved through 1.18 μmscreen for getting uniform size adsorbent.The powder fractions were preserved in glass bottles for use as an adsorbent.The test fluoride solutions of different initial fluoride concentrations were prepared by adding equivalent volume of standard and stock fluoride solution to the tap water which has 1.04 mg L-1 F–. The test fluoride samples were examined before and after defluoridation process. All the experiments were conducted at room temperature of 21±20C. The pH of the sample was adjusted by adding filtered lemon juice.The known quantity of khimp powder was well mixed into sample water. The sample was stirred in the beaker at 800-1200 rpm. The sample was allowed to settle and then filtered through a filter paper, followed by locally available Sikar clay (5 cm bed height). The easily available Khimp powder, lemon juice and clays were used to optimize the method for domestic level. Parameters investigated in the adsorption studies include pH, agitation time, adsorbent dose and fluoride concentration.The equilibrium adsorption data was studied for Langmuir and Freundlich isotherms.
Effect of pH:
The pH of sampling water was adjusted by adding filtered lemon juice. Different water samples were prepared varying pH values.The biomass (1g/200ml) was mixed into sample water having 4.20 mg L-1 fluoride. The mixture was agitated for 20 minute and kept constant for 10 minute. The filtrate was examined for hydrogen ion and fluoride concentration.The maximum fluoride removal was observed as85% at pH 6.73 (Table 1). It was observed anincreasing order in fluoride removal efficiencyup to pH 6.73 and further started to declineas shown in Fig.1.
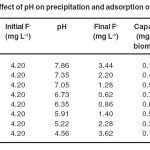 |
Table 1 Effect of pH on precipitation and adsorption of fluoride Click here to View table |
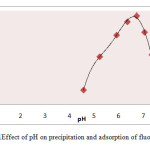 |
Fig.1Effect of pH on precipitation and adsorption of fluoride. Click here to View figure |
Effect of biomass on fluoride removal:
The extent of fluoride removal was linearly related to the amount of biomass over a range of 1.0 to 7.0 g L-1at an optimum pH of 6.7±0.1 as shown in Fig.2. Further addition of extra dosage of biomass has observed no significant increase in fluoride removal. The removal efficiency was almost same after adding 6.0 g L-1 khimp powder (Table 2). Therefore, 6.0 g L-1 khimp powder was selected minimum adsorbent dose for maximum fluoride removal.
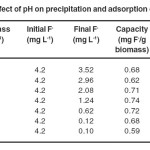 |
Table 2 Effect of adsorbent concentration on precipitation and adsorption of fluoride at pH 6.7±0.1 Click here to View table |
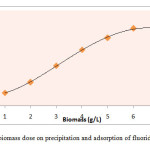 |
Fig.2Effect of biomass dose on precipitation and adsorption of fluoride at pH 6.7±0.1 Click here to View figure |
Effect of contact time on fluoride removal:
The effect of contact time was studied by varying it from 10 to 80 minutes keeping pH of 6.7±0.1 and biomass dose 6.0 g L-1 as shown in Fig.3. It was observed that the removal of fluoride ions related to contact time with some extent. The adsorption became almost constant after 60 minute observing 97% fluoride removal efficiency(Table 3).
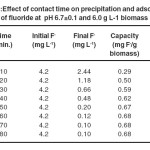 |
Table 3 Effect of contact time on precipitation and adsorption of fluoride at pH 6.7±0.1 and 6.0 g L-1 biomass Click here to View table |
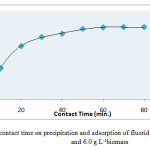 |
Fig.3Effect of contact time on precipitation and adsorption of fluoride at pH 6.7±0.1 and 6.0 g L-1biomass Click here to View figure |
Effect of initial fluoride concentration on adsorption:
The effect of initial fluoride concentration was studied by varying it from 1.6 to 16.8 mg L-1keeping biomass dose 6.0 g L-1 and contact time 60 minute at pH 6.7±0.1 as indicated in Table 4. It was observed that the percentage of fluoride removal decreases with increasing initial fluoride ion concentration as shown in Fig. 4. The maximum percentage of fluoride removal was observed 99 % at 1.6 mg L-1 and minimum 33 % at 16.8 mg L-1.
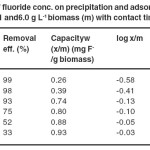 |
Table-4 Effect of fluoride conc. on precipitation and adsorption of fluoride at pH 6.7±0.1 and 6.0 g L-1 biomass (m) with contact time of 60 min. Click here to View table |
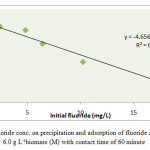 |
Fig.4 Effect of fluoride conc. on precipitation and adsorption of fluoride at pH 6.7±0.1 and 6.0 g L-1biomass (M) with contact time of 60 minute Click here to View figure |
Adsorption Isotherms:
The adsorption isotherms are essential to determine the feasibility of biomass for fluoride removal process. Moreover, these isotherms are important in the predictive modeling procedures for analysis and design for sorption systems. In order to establish the maximum sorption capacity, the Langmuir and Freundlich isotherms are used most frequently (Jamodel et al 2004; Jenish and Methodis 2011; Lonare et al 2011; Togarepi et al.2012).
The Freundlich adsorption value is calculated by the following reaction.
Freundlich equation x/m = K C1/n (I)
Freundlich linear form log(x/m) = log K + 1/n log C(II)
Wherex/mis the amount of fluoride adsorbed per unit weight (m) of the biomass (mg/g), Cis the equilibrium concentration of fluoride, K is the minimum sorption capacity (mg/g) and1/n is the adsorption intensity(Table 4). Linear plot of log C versus log (x/m) at different fluoride ion concentration was obtained as shown in Fig.5. The Freundlich constant Kand 1/n are calculated from intercept and slope of the graph. The numerical value of minimum sorption capacity (K) and adsorption intensity (n) for biomass Khimp were obtained at 0.68 mg/g and 5.13 respectively.
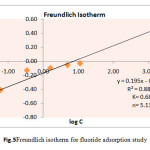 |
Fig.5 Freundlich isotherm for fluoride adsorption study Click here to View figure |
Langmuir isotherms: The Langmuir adsorption isotherm assumes the formations of monolayer coverage of adsorbate on outer surface of the adsorbent. This assumption is based on the point of valence exists on the surface of the adsorbent and that each of these sites is capable of adsorbing one molecule. Moreover, it is assumed that all the adsorption sites have equal affinity for molecules. The presence of adsorbed molecules at one site does not affect the adsorption on nearby sites.The Langmuir isotherm is given below:
Langmuir equation x/m= abC/(1 + aC) (III)
Langmuir linear form 1/(x/m)= 1/ab × 1/C+ 1/b (IV)
Where x/mis the amount of fluoride adsorbed per unit weight of the biomass (mg/g), Cis the equilibrium concentration of fluoride (Table 4). The Langmuir equilibrium constant a & bare the energy sorption & amount of fluoride required to form a monolayer respectively. Linear plot of 1/C versus 1/(x/m) at different fluoride ion concentration was obtained as shown in Fig.6. The value for 1/ab and 1/bare calculated from slope and intercept of the graph. The numerical value of the energy of sorption (a) and amount of fluoride required (b) to form a monolayer on biomass Khimp were obtained at 22.42 and 0.82 mg/g respectively.
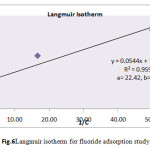 |
Fig.6 Langmuir isotherm for fluoride adsorption study Click here to View figure |
Conclusion:
The force responsible for adsorption of fluoride on biomass is certainly the columbic forces between the positively charged surface and negatively charged fluoride ions. Most probably, the calcium ions in Khimp adsorb negatively charged fluoride ions from the solution. The probable responsible ion in this process is the hydrogen ion. It accelerates the positive charge on calcium which favors the adsorption of fluoride. The presence of very high negative charges maydiffuse theprecipitated and adsorbed fluoride (CaF2) into solution. In favourable condition i.e. low value of pH, temperature and bicarbonate, the fluoride may precipitate as given below.
Ca2+ + 2F– → CaF2 (↓)
The main mechanism is through fluoride precipitation and adsorption (CaF2) onto khimp powder as well as filtered through filter paper and clay. The optimum fluoride removal (97%) was achievedat pH 6.7±0.1 and 6.0 g L-1 biomass with a contact period of 60 minutes. Equilibrium adsorption data has followed both Langmuir and Freundlich isotherms.
Acknowledgements:
We are thankful to the Institute for providing necessary facilities to complete this study. One of the authors, Radhey Shyam is also thankful to ONGC, Mumbai Region for giving the permission to carry out the research and posting him in 14 days on/off pattern at offshore.
References:
- APHA, Standard methods for the examination of water and waste water. 17thedn. American Public Health Association, American Water Works Association, Water Pollution Control Federation,Washington, D.C (1989).
- Bhaduri S.K. and Mojumder P.,Natural Product Radiance, 7(2), 106(2008).
- Bhatnagar M., Bhatnagar A. andJha S.,Biotechnology Letters 24, 1079(2002).
- Bulusu K.R. andNawalakhe W.G., Indian Journal of Environmental Health, 30, 262(1988).
- Bulusu K.R. and Pathak B.N., Journal of Environmental Engineering,106(2), 466(1980).
- CGWB, Annual report and other related reports on ground water quality,Central Ground Water Board, New Delhi, (2004).
- Chaudhary V., Kumar M., Sharma M. andYadav B.S., Environ Monit Assess,161, 343(2010).
- Chena N. et al.,Journal of Hazardous Materials, 183, 460(2010).
- Choubisa S.L. and Sompura K.,Pollution Research, 15(1), 45(1996).
- Fantong W.Y. et al.,Environ Geochem Health,32, 147 (2010).
- Fantong W.Y., Saxena V. and Ahmed S., Environmental Geology, 40, 1084(2001).
- Fordyce F.M. et al., Environ Geochem Health, 29, 83(2007).
- Guo Q., Wang Y. andGuo Q.L.,Environ Earth Sci,60, 633(2010).
- Hussain J., Hussain I. andSharma K.C.,Environ Monit Assess, 162, 1(2010).
- Jamodel A.V., Sapkal V.S. andJamode S., J Indian Inst Sci, 84, 163(2004).
- Jenish S. andMethodis P.A., Asian Journal of Chemistry, 23(7), 2889(2011).
- Lonare R., Inam F. andDeo S.,Asian Journal of Chemistry, 23(1), 59(2011).
- MalakootianM.,MoosazadehM., Yousefi N. andFatehizadeh A., African Journal of Environmental Science and Technology, 5(4), 299(2011).
- Meenakshi. andMaheshwari R.C., Journal of Hazardous Matter, 137(1), 456(2006).
- Munazir M.,Qureshi R., Arshad M. andGulfraz M., Pak J Bot, 44(4), 1209(2012).
- Murugan M. andSubramanian E., Journal of Water and Health, 4(4), 453(2006).
- Namasivayam C. andHoell W.H., Int. J. of Environment and Pollution, 34(4), 203 (2008).
- Nawlakhe W.G. andParamasivam R.,Current Science, 65(10), 743(1993).
- Noppakun W., Occurrence of Fluorosis due to Geothermal Sources in a Northern Thailand Sub district,3rd InternationalWorkshop on Fluorosis Prevention and Defluoridation of Water, Chiang Mai, Thailand, (2000).
- Pandey P.K., Pandey M. andSharma R., Journal of Environmental Protection, 3,610(2012).
- Rafique T., Naseem S., Bhanger M.I. andUsmani T.H.,Environ. Geology, 56, 317(2008).
- Rao N.S. andDevadas D.J., Environmental Geology, 45, 243(2003).
- Rao N.S.,Environ Monit Assess, 152, 47(2009).
- Shyam1 R. and Kalwania G.S., Int. J. of App. Eng. Res., Dindigul 2(2), 367(2011).
- Shyam2 R. and Kalwania G.S., Int. J. of Environ. Sci. 2(2), 502(2011).
- Shyam R.and Kalwania G.S.,Environ Earth Sci, 65(4), 1275(2012).
- Singh G., Singh K., Mishra D. andShukla S.,Arid Ecosystem, 2(4), 264(2012).
- Sinha S., Saxena R. andSingh S., Bull Environ Contam Toxicol, 65, 683(2000).
- Sivasankari C., Mahadevan M. andArulanantham A., Asian J. of Chem., 22(6), 4663(2010).
- SWRPD, State Water Policy 2010, State Water Resource Planning Department, Government of Rajasthan, Jaipur, (2010).
- Suthar S., et al.,Environ Monit Assess,145, 1(2008).
- Togarepi E., Mahamadi C. and Mangombe A., African Journal of Environmental Science and Technology, 6(3), 176(2012).
- UNICEF, States of the art report on the extent of fluoride in drinking water and the resulting endemicity in India, Report by fluorosis and rural development foundation for UNICEF, New Delhi. (1999).
- WHO, Guidelines for drinking water quality, Recommendations, World Health Organization, Geneva, (1996).
- WHO, Fluoride in drinking water, World Health Organization, IWA publishing, London, (2006).

This work is licensed under a Creative Commons Attribution 4.0 International License.
![]()
A New Edition of Web of Science
Journal Impact Factor
2022: 0.5
Five Year: 0.8
Journal is Indexed in

Cabells Whitelist
![]()


