Vibrational Spectroscopic Studies of 4-Chloro-3-Methylphenol
Rajeev T. Ulahannan1, R. Renjith1, J. B. Bhagysree3, Hema Tresa Varghese2 and C. Yohannan Panicker1
1Department of Physics, TKM College of Arts and Science, Kollam, India. 2Department of Physics, Fatima Mata National College, Kollam, India. 3Department of Chemistry, Mar Ivanios College, Nalanchira, Trivandrum, Kerala, India.
The IR and Raman spectra of 4-chloro-3-methylphenol have been recorded and analyzed. The harmonic vibrational wavenumbers were calculated using Gaussian09 software. Calculations were performed by HF and DFT levels using the standard 6-31G* basis. The calculated wavenumbers (DFT) agree well with the observed wavenumbers. The data obtained from vibrational wavenumber calculations are used to assign vibrational bands found in the IR and Raman spectra of the title compound. The predicted infrared intensities, Raman activities and first hyperpolarizabilty are reported.
KEYWORDS:IR, Raman; DFT; HOMO; LUMO
Download this article as:| Copy the following to cite this article: Ulahannan R. J, Renjith R, Bhagysree J. B, Varghese H. T, Panicker C. Y. Vibrational Spectroscopic Studies of 4-Chloro-3-Methylphenol. Orient J Chem 2013;29(1). |
| Copy the following to cite this URL: Ulahannan R. J, Renjith R, Bhagysree J. B, Varghese H. T, Panicker C. Y. Vibrational Spectroscopic Studies of 4-Chloro-3-Methylphenol. Orient J Chem 2013;29(1). Available from: http://www.orientjchem.org/?p=25218 |
Introduction
Phenol and its derivatives is the basic structural unit in a wide variety of synthetic organic compounds. They also add odour to drinking and food processing water1 and have mutagenic and carcinogenic effects2. The origin of phenol in the environment is both industrial and natural. Phenol pollution is associated with pulp and paper mills, coal mines, refineries, wood preservation, plants and various chemicals industries as well as their wastewaters3. Due to their high inhibitory and antibacterial activity, phenols may create problems in the operation of biological treatment plants4. 4-methylphenol has found considerable interest as a chromophore and simple model of the aromatic amino acid tyrosine5. Proton transfer, electron transfer and hydrogen transfer are important processes in clusters of tyrosine. The electronic ground state of 4-methyphenol has been investigated by infrared6,7 and Raman spectroscopy5,8, by stimulated emission of dip spectroscopy9, and by dispersed fluorescence spectroscopy10. In the present study the FT-IR, FT-Raman and theoretical calculations of the wavenumbers of the title compound are reported.
Experimental
The FT-IR spectrum was recorded using a DR/Jasco FT-IR 6300 spectrometer. The spectral resolution was 2 cm-1. The FT-Raman spectrum was obtained on a Bruker RFS 100/s, Germany. For excitation of the spectrum the emission of Nd:YAG laser was used, excitation wavelength 1064 nm, maximal power 150 mW.
Computational Details
Calculations of the title compound were carried out with Gaussian09 software program11 using the HF/6-31G* and B3LYP/6-31G* basis sets to predict the molecular structure and vibrational wavenumbers. The DFT hybrid B3LYP functional method tends to overestimate the fundamental modes; therefore scaling factors have to be used for obtaining a considerably better agreement with experimental data12. The wavenumber values computed contain known systematic errors and we therefore, have used the scaling factor values of 0.8929 and 0.9613 for HF and DFT basis sets12. The assignment of the calculated wavenumbers is aided by the animation option of Gaussview program, which gives a visual presentation of the vibrational modes13.
Results and Discussion
IR and Raman spectra
The observed IR, Raman and calculated (scaled) wavenumbers and assignments are given in Table 1. The asymmetric stretching vibrations of CH3 are expected in the range 2950-3050 cm-1 and symmetric CH3 vibrations in the range14,15 of 2900-2950 cm-1. The first of this results from the asymmetric stretching υasCH3 mode in which two C-H bonds of the methyl group are extending while the third one is contracting. The second arises from the symmetrical stretching υsCH3 in which all three of the C-H bonds extend and contract in phase. The asymmetric stretching modes of the methyl group are calculated (DFT) to be 3018, 2995 cm-1 and the symmetric mode at 2935 cm-1. The bands observed at 3022, 2989, 2926 cm-1 in the IR spectrum are assigned as stretching modes of the methyl group. Two bending can occur within a methyl group. The first of these, the symmetrical bending vibration, involves the in-phase bending of the C-H bonds. The second, the asymmetrical bending vibration, involves out-of-phase bending of the C-H bonds. The asymmetrical deformations are expected in the range14 1400-1485 cm-1. The calculated values (DFT) of δasCH3 modes are at 1489, 1469 cm-1. In many molecules, the symmetric deformations δsCH3 appears with an intensity varying from medium to strong and expected in the range14 1380 ± 25 cm-1. The band observed at 1418 cm-1 in the IR spectrum is assigned as the δsCH3 mode. The DFT calculations give δsCH3 mode at 1414 cm-1. Aromatic molecules display14 a methyl rock in the neighborhood 1045 cm-1. The second rock14 in the region 970 ± 70 cm-1 is more difficult to find among the C-H out-of-plane deformations. In the present case, these ρCH3 modes are calculated at 1057 and 1026 cm-1. The methyl torsions14 often assigned in the region 185 ± 65 cm-1.
The OH group provides three normal vibrations υOH, δOH and γOH. The DFT calculations give the υOH band at 3528 cm-1. The in-plane OH deformation14 is expected in the region 1400 ± 40 cm-1 and the band at 1409 cm-1 (DFT) is assigned as this mode. The stretching of the hydroxyl group with respect to the phenyl moiety υC-O appears at 1293 cm-1 in Raman spectrum and the calculated value is 1298 cm-1. This band is expected6, 15 in the region 1220 ± 40 cm-1. The out-of-plane OH deformation is observed at 928 cm-1 in the IR spectrum and at 931 cm-1, theoretically, which is as expected14. For paracetamol16, υ(C-O) is reported at 1240 cm-1.
The aliphatic CCl bonds absorb15 at 830-560 cm-1 and putting more than one chlorine on a carbon atom raises the CCl wavenumber. The CCl2 stretching mode is reported at around 738 cm-1 for dichloromethane6,15 and scissoring mode δCCl2 around 284 cm-1. Arslan et al.17 reported υCCl at 683 cm-1 (experimentally) and at 711, 736, 687, 697 cm-1 theoretically. The deformation bands of CCl are reported17 at 431, 435, 441 and 443 cm-1. In the present case the bands at 601 cm-1 (DFT) and 604 cm-1 (IR) are assigned as υCCl bands. The deformation bands of the CCl are assigned below 400 cm-1.
The benzene ring possesses six ring stretching vibrations, of which the four with the highest wavenumbers (occurring near 1600, 1580, 1490 and 1440 cm-1) are good group vibrations. With heavy substituents, the bands tend to shift to somewhat lower wavenumbers. In the absence of ring conjugation, the band at 1580 cm-1 is usually weaker than that at 1600 cm-1. In the case of C=O substitution, the band near 1490 cm-1 can be very weak. The fifth ring stretching vibration is active near 1315 ± 65 cm-1, a region that overlaps strongly with that of the CH in-plane deformation. The sixth ring stretching vibration, or the ring breathing mode, appears as a weak band near 1000 cm-1, in mono-, 1,3-di- and 1,3,5-trisubstituted benzenes. In the otherwise substituted benzenes, however, this vibration is substituent sensitive and difficult to distinguish from the ring in-plane deformation6,14. In the otherwise substituted benzenes, however, this vibration is substituent-sensitive and difficult to distinguish from other modes. In asymmetric tri-substitued benzenes, when all the three substituents are light, the wavenumber interval of the breathing mode6 is between 500 and 600 cm-1. When all the three substituents are heavy, the wavenumber appears above 1100 cm-1. In the case of mixed substituents, the wavenumber is expected6 to appear between 600 and 750 cm-1. For the title compound, the phenyl ring breathing mode is observed at 725 cm-1 theoretically and at 728 cm-1 in the IR spectrum and at 731 cm-1 in the Raman spectrum. The phenyl ring stretching modes υPh are observed at 1601, 1322, 1260 cm-1 in the IR spectrum, at 1585, 1248 cm-1 in the Raman spectrum and at 1595, 1589, 1468, 1321, 1252 cm-1 theoretically. The CH out-of-plane deformations14 are observed between 1000 and 700 cm-1. Generally, the CH out-of-plane deformations with the highest wavenumbers are weaker than those absorbing at lower wavenumbers. The bands observed at 842 cm-1 (IR) and 950, 835, 820 cm-1 (DFT) are assigned to this modes. For tri-substituted benzenes the δCH modes are seen in the range14 1290-1050 cm-1. Bands observed at 1172, 1133 cm-1 in the IR spectrum and at 1134, cm-1 in the Raman spectrum are assigned as δCH modes. The DFT calculation gives these modes at 1179, 1135, 1123 cm-1. The substituent sensitive modes are also identified and assigned (Table 1).
First hyperpolarizability
Non-linear optics deals with the interaction of applied electromagnetic fields in various materials to generate new electromagnetic fields, altered in wavenumber, phase or other physical properties18. Many organic molecules, containing conjugated π electrons and characterized by large values of molecular first hyperpolarizabilities, were analyzed by means of vibrational spectroscopy19, 20. Analysis of organic molecules having conjugated π-electron systems and large hyperpolarizability using infrared and Raman spectroscopies has evolved as a subject of research21. In the presence of an applied electric field, the energy of a system is a function of the electric field. First hyperpolarizability is a third rank tensor that can be described by a 3 3 3 matrix. The 27 components of the 3D matrix can be reduced to 10 components due to the Kleinman symmetry22. The calculated first hyperpolarizability of the title compound is 0.282 10-30 esu. We conclude that the title compound is an attractive object for future studies of non linear optical properties.
In order to investigate the performance of vibrational wavenumbers of the title compound, the root mean square (RMS) value between the calculated and observed wavenumbers were calculated. The RMS values of wavenumbers were calculated using the following expression23.
The RMS 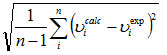 error of the observed IR and Raman bands are found to37.65, 28.39 for HF and 5.08, 5.60 for DFT methods, respectively. The small differences between experimental and calculated vibrational modes are observed. This is due to the fact that experimental results belong to solid phase and theoretical calculations belong to gaseous phase.
Frontier molecular orbitals
The analysis of the wavefunction indicates that the electron absorption corresponds to a transition from the ground to the first excited state and is mainly described by one electron excitation from the HOMO to LUMO. Both the HOMO and the LUMO are the main orbital taking part in chemical reaction. The HOMO energy characterizes the capability of electron giving; LUMO characterizes the capability of electron accepting24. The frontier orbital gap helps to characterize the chemical reactivity, optical polarizability and chemical hardness-softness of a molecule25. Surfaces for the frontier orbitals were drawn to understand the bonding scheme of the title compound. The calculated HOMO and LUMO energies are -7.884 and -4.449 eV. The chemical hardness and softness of a molecule is a good indication of the chemical stability of the molecule. From the HOMO-LUMO energy gap, one can find whether the molecule is hard of soft. The molecules having large energy gap are known as hard and molecules having a small energy gap are known as soft molecules. The soft molecules are more polarizable than the hard ones because they need small energy to excitation. The hardness value24 of a molecule can be determined as η = (-HOMO+LUMO)/2. The value of η of the title molecule is 1.718eV. Hence we conclude that the title compound belongs to hard material.
Table 1: Calculated wavnumbers (scaled), observed IR and Raman bands and assignments.
| HF/6-31G* | B3LYP/6-31G* | IRυ(cm-1) | Ramanυ(cm-1) | Assignments | ||||
| υ(cm-1) | IR intensity | Raman activity | υ(cm-1) | IR intensity | Raman activity | |||
| 3614 | 80.22 | 110.49 | 3528 | 33.02 | 143.52 | υOH | ||
| 3053 | 2.83 | 142.89 | 3125 | 3.13 | 151.55 | υCH | ||
| 3036 | 0.90 | 51.18 | 3109 | 1.38 | 55.62 | υCH | ||
| 2996 | 17.08 | 83.45 | 3062 | 18.17 | 86.39 | 3066 | 3061 | υCH |
| 2934 | 19.52 | 57.28 | 3018 | 16.20 | 52.31 | 3022 | υasCH3 | |
| 2921 | 13.72 | 72.93 | 2995 | 12.50 | 75.03 | 2989 | υasCH3 | |
| 2861 | 20.21 | 136.58 | 2935 | 18.04 | 155.04 | 2926 | υsCH3 | |
| 1613 | 35.91 | 18.77 | 1595 | 8.84 | 14.80 | 1601 | υPh | |
| 1607 | 27.24 | 10.28 | 1589 | 32.65 | 16.92 | 1585 | υPh | |
| 1499 | 84.55 | 3.29 | 1489 | 66.06 | 8.03 | 1497 | δasCH3 | |
| 1470 | 7.48 | 8.73 | 1469 | 7.26 | 4.75 | 1470 | δasCH3 | |
| 1468 | 8.27 | 21.52 | 1468 | 8.63 | 20.93 | υPh | ||
| 1421 | 21.53 | 10.23 | 1414 | 47.02 | 7.86 | 1418 | δsCH3 | |
| 1415 | 47.66 | 4.94 | 1409 | 21.91 | 16.49 | δOH | ||
| 1303 | 5.26 | 1.85 | 1321 | 3.85 | 1.92 | 1322 | υPh | |
| 1257 | 68.70 | 6.20 | 1298 | 6.86 | 5.15 | 1293 | υCO | |
| 1230 | 13.31 | 3.31 | 1252 | 26.32 | 6.93 | 1260 | 1248 | υPh |
| 1165 | 35.42 | 1.30 | 1179 | 7.35 | 4.73 | 1172 | δCH | |
| 1129 | 139.76 | 1.32 | 1135 | 274.52 | 1.86 | 1133 | 1134 | δCH |
| 1117 | 110.21 | 1.89 | 1123 | 8.42 | 2.86 | δCH | ||
| 1079 | 7.88 | 0.52 | 1057 | 6.09 | 0.68 | 1055 | 1049 | ρCH3 |
| 1033 | 51.72 | 8.34 | 1026 | 47.85 | 7.67 | 1030 | ρCH3 | |
| 1029 | 0.03 | 0.39 | 1010 | 4.30 | 2.20 | 1008 | υCC | |
| 1012 | 2.80 | 1.39 | 950 | 0.03 | 0.70 | γCH | ||
| 927 | 0.35 | 6.46 | 931 | 1.05 | 6.02 | 928 | γOH | |
| 895 | 51.83 | 2.12 | 835 | 35.62 | 2.21 | 842 | γCH | |
| 872 | 45.11 | 1.96 | 820 | 22.97 | 3.61 | γCH | ||
| 741 | 0.02 | 0.34 | 725 | 0.97 | 17.32 | 728 | 731 | υPh |
| 725 | 1.21 | 19.29 | 695 | 0.37 | 0.40 | γPh | ||
| 603 | 43.53 | 3.03 | 601 | 39.38 | 1.42 | 604 | υCCl | |
| 597 | 1.24 | 0.25 | 570 | 1.46 | 0.11 | 566 | 561 | δPh(X) |
| 540 | 0.95 | 13.34 | 541 | 0.77 | 11.97 | γPh(X) | ||
| 469 | 14.03 | 1.11 | 466 | 11.21 | 1.12 | 470 | γPh(X) | |
| 462 | 10.60 | 0.06 | 446 | 7.52 | 0.02 | 442 | δPh(X) | |
| 360 | 7.73 | 13.79 | 358 | 7.56 | 11.84 | γPh(X) | ||
| 337 | 16.05 | 1.72 | 355 | 173.13 | 4.31 | 348 | δPh(X) | |
| 293 | 205.64 | 2.74 | 320 | 0.01 | 0.65 | δCCl | ||
| 292 | 1.22 | 0.21 | 292 | 0.79 | 0.16 | tCH3 | ||
| 229 | 2.51 | 1.10 | 227 | 2.10 | 1.07 | 225 | tCH3 | |
| 210 | 0.03 | 2.92 | 206 | 0.10 | 2.88 | γCCl | ||
| 141 | 0.17 | 0.10 | 135 | 0.31 | 0.16 | tCOH | ||
| 118 | 0.02 | 0.93 | 115 | 0.04 | 1.02 | 109 | tPh | |
υ-stretching; δ-in-plane deformation; γ-out-of-plane deformation, t-torsion; as-asymmetric; s-symmetric; Ph-phenyl ring; X-substituent sensitive.
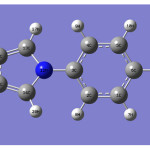 |
Figure 1: Click here to View figure |
Conclusion
The optimized molecular structure, vibrational wavenumbers, corresponding vibrational assignments of the title compound have been investigated experimentally and theoretically using Gaussian09 software package. The observed wavenumbers were found to be in agreement with calculated (DFT) values. The predicted infrared intensities, Raman activities and first hyperpolarizability values are reported. The calculated first hyperpolarizability value shows that the title compound is suitable for further studies of nonlinear optics.
References
- Adav, S.S., Chen, M.Y., Lee, D.J., Ren, N.Q., Chemosphere 67: 1566 (2007).
- Bolaños, R.M.L., , Varesche, M.B.A., Zaiat, M., Foresti, E., Water Sci. Technol. 44: 167 (2001).
- aula, M., Schei, V., Young, L.Y., Appl. Environ. Microbiol, 64: 2432 (1998).
- igo, H., Alegre, R.M., Folia Microbial, 49: 41 (2004).
- Arp, Z., Autrey, D., Laane, J., Overman, S.A., Thomas, G.J., Biochemistry 40: 2522 (2001).
- Varsanyi, G., Assignments of Vibrational Spectra of Seven Hundred Benzene Derivatives, Wiley, New York (1974).
- Jacobsen, R.J., Spectrochim. Acta 21: 433 (1965).
- Laane, J., Haller, K., Sakurai,S., Morris, K., Autrey, D., Arp, Z., Chiang, W., Combs, A., J. Mol. Struct. 650: 57 (2003).
- Ebata, T., Ito, M., J. Phys. Chem. 96: 3224 (1992).
- Song, K., Hayes, J.M., J. Mol. Spectrosc. 134: 82 (1989).
- Gaussian09, Revision B.01., Frisch, M.J., et al, Gaussian Inc., Wallingford CT (2010).
- Foresman, J.B., Frisch, E., Exploring Chemistry with Electronic Structure Methods, A Guide to using Gaussian, Pittsburg, PA (1996).
- Gaussview Version 5,, Dennington, R., Keith, T., Millam, J., Semichem Inc. ShawneeMissionKS (2009).
- Roeges, N.P.G., A Guide to the Complete Interpretation of Infrared Spectra of Organic Structures, Wiley, New York (1994).
- Colthup, N.B., Daly, L.H., Wiberly, S.E., Inroduction to Infrared and Raman Spectroscopy, third ed., Academic Press, Boston (1990).
- El-Shahawy, A.S., Ahmed, S.M., Sayed, N.K., Spectrochim. Acta 66A: 143 (2007).
- Arslan, H., Florke, U., Kulcu, N., Binzet, G., Spectrochim. Acta 68A: 1347 (2007).
- Shen, R., The Principles of Nonlinear Optics, Wiley: New York (1984).
- Kolinsky, P.V., Opt. Eng. 31: 1676 (1992).
- Eaton, D.F., Science 253: 281 (1991).
- Tommasini, M., Castiglioni, C., Del Zoppo, M., Zerbi, G., J. Mol. Struct. 480: 179 (1999).
- Kleinman, D.A., Phys. Rev. 126: 1977 (1962).
- Joseph, T., Varghese, H.T., Panicker, C.Y., Viswanathan, K., Sundaraganesan, N., Subramanina, N., Dolezal, M., Global J. Anal. Chem. 3: 1 (2012).
- Fukui, K., Science 218: 747 (1982).
- Kosar, B., Albayrak, C., Spectrochim. Acta 78A: 160 (2011).

This work is licensed under a Creative Commons Attribution 4.0 International License.
![]()
A New Edition of Web of Science
Journal Impact Factor
2022: 0.5
Five Year: 0.8
Journal is Indexed in

Cabells Whitelist
![]()


