Synthesis, Characterization and Spectral Studies of Gold Complex With Gliclazide, an Oral Antidiabetic Allopathic Drug
Bal Krishan1* , Om Prakash2 and E. H. El-Mossalamy3
1Department of Chemistry, Gyan Ganga Institute of Technology and Management, Bhopal - 462 021, India. 2Cresent College of Technology, Nabi Bagh, Karond, Bhopal - 462 038, India. 3Department of Chemistry, Faculty of Science, King Abdulaziz University, 21589 Jeddah, P.O. Box 80203, Saudi Arabia. Corresponding Author E-mail: bkrishan.krg@gmail.com
Synthesis, characterization and spectral studies of gold complex with gliclazide, an oral antidiabetic drug have been studied. The conductometric titration using monovariation method indicate that complexes are non-ionic and L2M type. Analytical data agrees with the molecular formula(C15H20N3O3S)2Au. Structure of complex was assigned tetrahedral, supported by IR, 1H-NMR.X-Ray and Mass studies. Structure (II) is proposed for complex.
KEYWORDS:Gliclazide; antidiabetic drug; complex; IR,NMR; Mass;X-Ray
Download this article as:| Copy the following to cite this article: Krishan B, Prakash O, El-Mossalamy E. H.Synthesis, Characterization and Spectral Studies of Gold Complex With Gliclazide, an Oral Antidiabetic Allopathic Drug. Orient J Chem 2013;29(1). |
| Copy the following to cite this URL: Krishan B, Prakash O, El-Mossalamy E. H.Synthesis, Characterization and Spectral Studies of Gold Complex With Gliclazide, an Oral Antidiabetic Allopathic Drug. Orient J Chem 2013;29(1). Available from: http://www.orientjchem.org/?p=25228 |
Introduction
Metal ion are required for many critical function in humans .Scarcity of some metal ions can leads to disease1. Well – known example can leads to pernicious anemia resulting from iron deficiency; growth retardation arising from insufficient dietary zinc, and heart disease in infants owing to copper deficiency. The ability to recognize, to understand at the molecular level, and to the diseases caused by inadequate metal- ion function constitutes an important aspect of medicinal bioinorganic chemistry. Understanding the biochemistry and molecular biology of natural detoxification mechanisms and designing and applying ion –specific chelating agents to treat metal over -loads are the two components of a second major aspect of the new science that is evolving at the interface of bioinorganic chemistry and medicine.
Diabetes is a deceptive disease and if not detected in early stage may cause even death. It is considered hereditary but actual genetic disorder is still a mystery. Several million people are suffering from this disease all over the world [Sadilot and Phatak,2; Bloomgarden3, ; Sanger and Thompson,4 ]. Zinc- insulin was discovered as early as in 1921 and later it proved to be a very efficacious medicine in the treatment of diabetes mellitus. To avoid the daily pricks of hypodermic syringe, oral hypoglycemic agents were discovered which has revolutionized the treatment of diabetes .It is worthwhile to mention here that the majority of the essential metallic elements of biological importance are transition metals ,whose ability to form coordination complexes and chelates is the characteristic aspects of their chemistry.
In recent years much attention is given to the use of sulphonylureas because of their high complexing nature with essential metals .Sulphonylureas are effective for non- insulin dependent diabetes mellitus, [Sadilot and Phatak2, Bioomgarden,3 Sanger and Thompson,4]. These compounds are completely absorbed on oral administration. They are metabolized by liver and are excreted predominantly through urine.
Complexation of sulphonylureas with lighter transition metals has been studied in detail by Yoshinaga and Yamamotto5-6, [ ,Iqbal.at.el. )7,10-11,26 and other author synthesis the complexs of various metals with compound30-37 . A perusal of available literature shows that systematic study of complexation of vanadium with Gliclazide is relatively scanty. It is interesting to have an insite in to the synthesis of vanadium complex with Gliclazide and to diagnose various structural aspects of the isolated complex.
Here the synthesis and characterization of gold with Gliclazide have been described
Structure of Gliclazide
Experiment
Ligand-Metal Ratio
a) Pure Gliclazide m.p. 180°C (Lit. 179.5-180.5), 0.005 M, were diluted to 100 ml as required and titrated conductometrically against gold chloride at 30±1°C. Results were plotted in the form of a graph which indicate ligand metal ratio as 2:1 (L2M).
b) Formation of 2:1 (L2M) ratio was further confirmed by Job’s method8 of continuous variation as modified by Turner and Anderson9(Table-1) spectrophotometric studies were conducted using absorbance as index property, from these values the stability constant (log k) and free energy change (-DF), were also calculated (Irving and Rossotti 38-39 ) Tables 1, and fig. 1 given for Gliclazide -Gold complex.
 |
Table 1: Click here to View table |
Synthesis of Complexes
The chemicals used in this synthesis were all of analar grade Hi-media. A weighed quantity of Gliclazide(2 mol) (supplied by Zim lab.Nagpur) was dissolved separately in minimum quantity of 90% ethanol. The gold chloride solution was prepared by dissolving (1 mol) separately in the same solvent. Ligand solution was added slowly with stirring into the metallic salt solution at room temperature, maintain the pH between 6.0 to 6.5 by adding dilute NaOH solution. On refluxing the mixture for 3 hours and on cooling the complexes separated out. Which were filtered off, washed well with ethanol and finally dried in vacuum and weighed.
The elemental analyses of the isolated complexes were carried out using coleman analyzer at the departmental micro analytical laboratory CDRI Lucknow..
The IR spectrum of the ligand as well as of the complex was recorded on Perkin Elemer Spectrometer(I.I.T BOMBAY) and 1H-NMR spectra of the ligand and isolated complex was recorded on a Bruker DRX-300 Spectrometer and d6-DMSO was used as a solvent. IR and 1H-NMR spectrums recorded in CDRI, Lucknow and IIT BOMBAY. India and X-Ray diffractrogram from Punjab University ,Chandigarh.
From stoichoimetry and analytical data, the composition of the complex comes out to be (C15H20N3O3S)2·Au, which favours 2:1 (L2M) ratio. The tentative structure( I) assigned to complex on the basis of analytical data and IR, NMR, Mass and X-ray.
Table 1: Gliclazide With Gold(Iii)Chloride (Modified Jobs Method8 ).
| S. No. | Mole Metal:Ligand | Absorbance | Corrected Abs. | Corrected Abs. | |
| 0.002M | 0.005M | 0.002M | 0.005M | ||
| 1 | 0:12 | 0.01 | 0.015 | 0.00 | 0.00 |
| 2 | 1:11 | 0.119 | 0.253 | 0.109 | 0.233 |
| 3 | 2:10 | 0.283 | 0.423 | 0.261 | 0.402 |
| 4 | 3:9 | 0.464 | 0.611 | 0.449 | 0.586 |
| 5 | 4:8 | 0.725 | 0.925 | 0.710 | 0.895 |
| 6 | 5:7 | 0.701 | 0.849 | 0.682 | 0.712 |
| 7 | 6:6 | 0.593 | 0.693 | 0.478 | 0.633 |
| 8 | 7:5 | 0.474 | 0.613 | 0.459 | 0.504 |
| 9 | 8:4 | 0.422 | 0.563 | 0.405 | 0.503 |
| 10 | 9:3 | 0.332 | 0.442 | 0.312 | 0.362 |
| 11 | 10:2 | 0.098 | 0.397 | 0.078 | 0.322 |
| 12 | 11:1 | 0.053 | 0.243 | 0.032 | 0.163 |
| 13 | 12:0 | 0.023 | 0.085 | 0.00 | 0.00 |
JOBS METHOD BY SPECTROPHOTOMETRICALLY Gliclazide-0.002M,0.005M Gold(III) chloride-0.002M.0.005M Solvent: 90% Ethyl alcohol Temperature: 30±10C Wavelength: 660 nm pH: 5.9
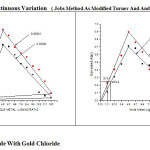 |
Figure 1: Gliclazide With Gold Chloride. Click here to View figure |
Result and Discussion
Table 2: Pysico-chemical Characterstics of Gliclazide complex with Gold
| Sl. No. | Complexes | Colour | Yield (%) | m.p.°C | –ΔF | Log K | Molar conductance W-1cm-1mole-1 |
| 1. | (C15H20N3O3S)2Au | Brown | 36 | 183 | 16.66 | 11.97 | 33.6 |
Table 3: Elemental analysis of Gliclazide-Gold complex.
| Sl.No. | Formula of complexes | Molecular weight (g/mole) | |||||
| C | H | N | S | Metal(%) | |||
| 1. | (C15H20N3O3S)2Au | 842.45 | 42.76(43.82) | 4.75(5.64) | 9.57(9.85) | 7.60(703) | 23.4824.96 |
Infra-red Spectra Studies
The IR spectra of ligand and isolated complex was scanned within the range 4000-400 cm-1. Assignments of the infrared spectral bands are based on literature (Table-3) IR spectrum shows important bands due to n(M-O) 400-600 cm-1, n(Ar-S) 700-800 cm-1, n(-S-N) 1085±20 cm-1, n(SO2-N) 1120±20 cm-1, n(C-N) 1210±20 cm-1, n(S=O) 1340±20 cm-1, n(C=O) 1710 cm-1( present only in pure drug and absent in complex),1600±20 cm-1vs(coordinate H2O molecule present only complex), n(NH-stretch) 3274±20 cm-1.
The proposed structure for the isolated complex is also supported by IR absorption , C.N.Rao12. , Bellamy 13, Weissberger14 .
Table 4: Specific IR assignment of Gliclazide,and Gliclazide complexes with Au.
| Pure drug(Gliclazide) | Gliclazide-Au complex |
| 632cm-1s,668cm-1 vs,1087cm-1vs1240cm-1vs,1348cm-1vs,1710cm-1vs,2867cm-1,2950cm-1vs,3274cm–1vsVs=very strong,s=strong,m=mediumW=weak | 618cm-1 s ,672vs,1108cm-1s,1187cm-1s ,1620vs1340cm-1 s,1520cm-1s 2857cm-1 2924cm-13021cm-1s,3670cm-1mVs=very strong,s=strong,m=medium
W=weak
|
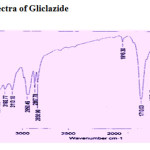 |
Figure 2: IR Spectra of Gliclazide. Click here to View figure |
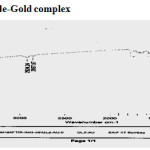 |
Figure 3: IR Spectra of Gliclazide-Gold complex. Click here to View figure |
1H-NMR Studies
1H-NMR spectral data are given in (Table-4). It was observed that the singlet due to the imide (NH) proton around (d8.033) in the spectrum of the ligand disappeared in the spectra of (NH) group in the complex molecule due to formation of M-O band. This also confirms the deprotonation of aimide NH group through enolization (the appearance of >C=N stretching band observed in IR spectra)
Other features of NMR spectrum were the aromatic presence of unresolved multiplet suggestive protons. Slichter15 , Akit16 , Siewers 17, Jacob and Iqbal 18 Afridi19,
Table 5: NMR-Assignments of Gliclazide-Gold complex.
| (C15H21N3O3S)2 pure drug Gliclazide | (C15H21N3O3S)2Au |
| δ8.041 (s,1H,NHCo, J=0.334Hz), δ7.817 (d,benzene J=1Hz), δ7.395(d,benzene, J=1Hz), δ6.28 (s,SO2NH), δ3.320 (NH-CO, J=0.929Hz), δ2.901(s,CH3 group attached to benzene, J=2.160 Hz), δ1.388 (s,CH3 group, J=2.955Hz | δ8.033 (d,1H,NH-CO, J=1.441Hz), δ7.806 (d,benzene, J=4.987Hz), δ7.395 (s,SO2-NH, J=1Hz), δ3.504 (s,NH-CO-Au, J=0.83Hz), δ2.618 (s,CH3-group attached to benzene, J=13.395Hz), δ1.571 (q,CH3 group, J=5.50Hz), δ1.224 (CH3 group,J=1.165Hz |
s=singlet, d=doublet, t=triplet, q=quartrate, m=multiplet
X-Ray Diffraction Studies
X-ray diffraction studies also confirm the complex and formation due to new bonds20-25,27-28. The number of peaks in gliclazide are 22 while (GLZ)2Au are 12 (Fig-6) . Thus indicating that complex formed is a well kit one. All the reflections present are new ones and the patterns are fairly strong. On comparing the pattern obtained with available literature. It is evident that its pattern is not in good agreement with available information and thus confirms the formation of totally new complex. The X-ray pattern have been indexed by using computer software(FPSUIT 2.0V) and applying interactive trial and error method keeping in mind the characteristics of the various symmetry system, till a good fit was obtained between the observed and the calculated Sin2θ value. The unit cell parameters were calculated from the indexed data, from cell data and crystal lattice parameters of (GLZ)2Au, indicates complexes attributed to Monoclinic crystal system Table given below
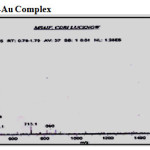 |
Figure 4: X-ray difractogram of Gliclazide-Gold complex. Click here to View figure |
Cell data and crystal parameter of GLZ-Au Complex given in below Table -6
a(Å) = 21.762 Volume (abcsin b)Å= 14065.307
b(Å) = 23.4271 c(Å) = 27.274 Dobs =3.36041 g/cm3 Dcal = 3.35724 g/cm3 Standard deviation = 0.0026%Crystal system = orthorombic
α=90°, β=89.2, γ =90° Porosity(%) = 2.361
Density =0.059845 g/cm3 Particle size = 10.91microns
Space group = Pm
| 2θ | I/I0 | D(Obs) | D(Cal) | h | k | l |
| 26.5255 | 100 | 3.36041 | 3.35724 | 1 | 6 | 4 |
| 30.3724 | 40.21 | 2.94300 | 2.93864 | -1 | 2 | 9 |
| 34.9471 | 63.10 | 2.56752 | 2.56734 | -3 | 1 | 10 |
| 43.9242 | 31.47 | 2.06137 | 2.06019 | 8 | 3 | 8 |
| 51.9526 | 29.96 | 1.75867 | 1.35806 | -8 | 11 | 8 |
Mass spectral studies of gliclazide-gold complex
Mass spectrophotometric studies gave useful information regarding the accurate determination of molecular weight and which provided information about the structure of compounds by examination of the fragmentation pattern40-41. Now a days, chemist have enthusiastically embarrassed mass spectroscopy to identify and characterize molecule Mass spectrum of the compound is a plot which represents the intensities of the signals at various m/z value42-43. It is highly characteristic of the compound ,no two compounds can have similar mass spectra. It provides information regarding the molecular structure of organic and inorganic compounds. We have studed gold complex of gliclazide and assignment is given table-7
Mass Spectrum of GLZ-Au Complex
Table-7 Mass Spectrum assignment of GLZ-Au Complex
m/z 840 due to [Au(C15H21N3O3S)2]+. or (ML2)+. Molecular ion peak (m+.); m/z 447 due to [C18H30N4O7S]+. radical ion, m/z 324 due to [C15H21N3O3S]+. base peak ion 100% relative abundance, m/z 386 due to [C15H22N3O6S]+. Fragment ion, m/z 273 due to [C10H12N2O7]+. radical ion.
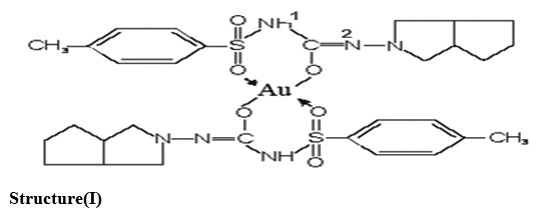
Structure(I)
Discussion
For supporting the proposed structure of gold-gliclazide complex, initially Jobs method of continuous variation as modified by Turner and Anderson was conducted which indicate 2:1 ligand:metal ratio of the complex , moreover stability constant and free energy change was also calculated .Analytical data agrees to the molecular formula (C15H20N3O3S)2Au (L2M) .
For determining the proposed structure on the basis of stoichiometry and analysis of the complex. Advance spectroscopic methods like IR , H1-NMR , Mass were conducted which suggest the coordination of metal atom with enolic oxygen of the carbonyl group on one side and oxygen of the sulphonyl group from the other side .These observation were further supporting from the IR and NMR values of metal-oxygen and disappearance of M-H linkages in NMR. A detailed study of X-Ray also supports the complex formation and the various values like particle size , porosity , volume of unit cell , density as well as crystal system was evaluated and discussed .Moreover looking to the higher electronegativity of oxygen as compared to N2 and to enolization is strongly supported.
Acknowledgement
The author is thankful to the principal of Gyan Ganga Institute of Technology &Management , Bhopal and Principal of Cresent College of Technology, Bhopal for providing all necessary facilities and IIT, BOMBAY ,PU CHANDIGARH for providing IR spectra and x-Ray data.
References
- E.J ,Underwood., Trace element in human and animal nutrition 3rd ed, Academic press, New York N.Y., P-57 (1971).
- S.M. Sadilot, R.B . Pathak, J.Diabet.Assoc.India 32(4).(1992)
- Z.N. Bloomgarden, American Diabetes Association Consensus Statement on pharmacologic treatment, Diabetes Care,22 SIS117,(1999)
- Sanger, E.O.L .Thompson,Ibid.,53,535,366,(1951)
- I. Yoshinaga, Y.Yamamotto,Endocrinologie(Gen),50,3.(1966a)
- I. Yoshinaga, Y. Yamamotto,J.Osaka 1,3.1966b
- S.A. Iqbal. Sibi Jose and Ishaq Zaafarany, Orient,J.Chem.28(1):613-618(2012)
- P.Job,Ann.Clin,113:10(1928)
- S.E.Terner and R.C. Anderson,J Am.Chem.Soc.,912:71(1949)
- Sharma,S.,Iqbal,S.A., and Budhani,P.,Orient.J.Chem.26(1)287-300(2010)
- S.A . Iqbal,and Zaafarny,I.,Orient.J.Chem,28,613-618(2012)
- C.N.R. Rao, Chemical Applications of Infra-red spectroscopy, Academic press NY.(1963)
- L.J. Bellamy. The Infra-red spectra of complex molecules.Matheun and co.Ltd. London (1964)
- A. Weissberger, Chem. Application of spectroscopy”, Vol. XI Inter Science Publ. New York. (1956)
- C.P. Slichter, Principles of magnetic resonance, Harper and Row (1963)
- J.W .Akit., NMR and chemistry an introduction to nuclear magnetic resonance spectroscopy, Champan and Hall, (1973)
- R.E. Siewers,. Nuclear magnetic resonance shift reagents academic, New York (1973)
- George Jacob, Syed Aftab Iqbal and E.H. El- Mossalamy, Asian J. Chem. 23(2), 573-576 (2011)
- Farhana, Afridi, S.A ,Iqbal,., and Javed, Hasan., Orient .J.Chem.22 (1), 195-197 (2010)
- S.N. Pandeya, D. Sriram, G. Nath and E.De. Clereq, Arzneim-forsch/Drug Res. 50, 55(2000)
- B.S. Hollo, K.A. Poojary and B. Kollurya, II, Farmaco, 51, 793 (1996)
- M. Kidwai, P. Sapra, P. Mishra; R.K. Saxena and M. Singh Bioorg. Med. Chem. 9,217 (2001)
- H.K. Reddy,D.P.Seshaiah and A.V.Reddy,Orient.J.Chem.27(3);1125-1131(2011)
- N.F.M. Henry, H. Lipson and W.A. Wooster, Interpretation of X-ray diffraction photograph. 81(1851)
- Chohan, Zahid , M. Praveen. and A. Ghaffer., Synth. React. Inorg. Met. Org. Chem 28(1998), 1973
- Bal krishan and Iqbal,S.A., Orient.J.Chem.,28(4),1883-1888,(2012
- D ,Altermatt,. and I.D, Brown,. Acta Cryst B41, 244-247(1985);
- I.D, Brown,., The Chemical bond in inorganic chemistry, The bond valence model IUCr monographs on crystallography, 12, Oxford University Press, www.ccp14.ac.uk/ccp/web-mirrors/idbrown(2002),
- A.S. AL-Janabi,and S.A.Ahmed,Orient.J.Chem.27(4);1563-1571(2011)
- S.Singh,K.K.Singh and J.P. Singh,Orient.J.Chem.27(3);1233-1237(2011)
- M.R.Khan and Sahdev,Orient.J.Chem.27(2);649-653(2011)
- K. Shankar and A.B.Nazeera,Orient.J.Chem.,27(2);655-660(2011)
- N, Salih., F. Salimon, and Yousif Emad., Orient J. Chem, 27 (2) 373-383 (2011).
- Mervat M., El-Enany, Salwa, E.M., El-Meligie, Nadia A., Abdou and Hala, B, El-Nasean ,Orient J. Chem; 26 (4) 1265-1270 (2010)
- R.Saxena., Sahdev and S. Ahmed. Orient J. Chem, 26(4) 1507-1511 (2010)
- M, Azimi, and S .Ahmad., Orient J. Chem. 27 (2) 673-677 (2011)
- Irving H,Rossotti H.S.:J.Chem.Soc.2904(1954)
- Irvin H,Rossotti H.S.:J.Chem.Soc.1176(1955)
- Mc Lafferty and Turecek: Interpretaiton of mass spectra, 4th Ed. (1993)
- Sorrell: Interpreting spectra of organic molecules (1988)
- Arpino, P., Mass spectrum review, 8, 35 (1989)
- Suresh, G.P., Prakasha, K.C., Wethroe, Kapfo and Channe, Gowada D., E. Journal of Chem., 7(2), 449-456 (2010)

This work is licensed under a Creative Commons Attribution 4.0 International License.
![]()
A New Edition of Web of Science
Journal Impact Factor
2022: 0.5
Five Year: 0.8
Journal is Indexed in

Cabells Whitelist
![]()


