Simple and Validated Ultraviolet Spectrophotometric Method for the Estimation of Febuxostat in Bulk and Pharmaceutical Dosage forms
Muvvala Subrahmanya Sudhir1, Pavuluri Madan Mohan2 and Ratnakaram Venkata Nadh 3*
1Department of Chemistry, SS&N College, Narasaraopet - 522 601, India.
2Department of Chemistry, Acharya Nagarjuna University, Nagarjuna Nagar- 522 510, India.
3School of Biotechnology, Vignan University, Vadlamudi - 522 213, India.
For estimation of the Febuxostat in bulk and pharmaceutical dosage forms, an ultra violet – spectrophotometric method has been developed and validated. The method employed 0.1 N NaOH as solvent. At 275 nm, the linear regression analysis data for the calibration plot showed good linear relationship with correlation coefficient value of 0.998 in the concentration range of 10 – 70 µg/ml. The limit of detection and limit of quantitation were found to be 0.239 µg/ ml and 0.725 µg/ml respectively. The results demonstrated that the procedure is accurate, precise and reproducible (R.S.D. < 2 %).
KEYWORDS:Febuxostat; Validation; Estimation; UV spectrophotometry; 0.1 N NaOH; Bulk and Pharmaceutical forms
Download this article as:| Copy the following to cite this article: Sudhir M. S, Mohan P. M, Nadh R. V. Simple and Validated Ultraviolet Spectrophotometric Method for the Estimation of Febuxostat in Bulk and Pharmaceutical Dosage forms. Orient J Chem 2013;29(1). |
| Copy the following to cite this URL: Sudhir M. S, Mohan P. M, Nadh R. V. Simple and Validated Ultraviolet Spectrophotometric Method for the Estimation of Febuxostat in Bulk and Pharmaceutical Dosage forms. Orient J Chem 2013;29(1). Available from: http://www.orientjchem.org/?p=25155 |
Introduction
The Febuxostat chemically is 2-[3-cyano-4-(2-methylpropoxy) phenyl]-4-methylthiazole-5-carboxylic acid 1 (Fig. 1) with a molecular weight of 316.38. The molecular formula is C16H16N2O3S. Tablets available in the local market for oral use contain the active ingredient, febuxostat in two dosage strengths; 40 mg and 80 mg 2.
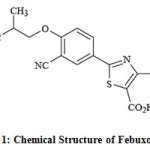 |
Figure 1: Chemical Structure of Febuxostat.
|
Febuxostat (TEI-6720; TMX-67) is a novel, orally administered, potent and non–purine analogue being developed by Teijin, with licensees Ipsen and TAP Holdings, for the treatment of hyperuricemia in gout 3. Febuxostat was determined by HPLC 4 and UPLC MS/MS 5 and HPLC-FLU methods6. Febuxostat was estimated by UV spectrophotometric method in pure methanolic 7, 8 and methanol-alkali/acid mixture media9. According to Anjana et al.,2. Febuxostat is slightly soluble in methanol and acetonitrile. In dosage form of Febuxostat, the inactive ingredients include lactose monohydrate, microcrystalline cellulose, hydroxypropyl cellulose, sodium croscarmellose, and silicon dioxide and magnesium stearate. The replacement of methanol by pure sodium hydroxide solution as a solvent reduces the solubility of other incipients. In addition, due to added advantages of sodium hydroxide solution as a solvent, different drugs were estimated using it as a solvent 10–12. Hence, it was thought worthwhile to develop a rapid, sensitive, precise and accurate ultra violet – spectrophotometric method for validation of Febuxostat in bulk and pharmaceutical dosage forms by conducting systematic trails using pure sodium hydroxide solution as a solvent.
Materials and Methods
The spectrophotometric measurements were carried out using a double beam LABINDIA UV – Visible spectrophotometer (UV – 3092) connected to computer and loaded with PMT detector UV – WIN 5 software. The instrument has an automatic wavelength accuracy of 0.1 nm and matched quartz cells of 10 mm (1.0 cm) cell path length. Shimadzu AUX-220 balance was used for weighing the samples. The absorption spectra of the reference and test solutions were carried out in a 1 cm quartz cells over the range of 200 – 400 nm. Febuxostat was tested for purity by measuring its melting point and IR spectra and no impurities were found. All the reagents used were of analytical grade.
Standard solution of Febuxostat
Standard stock solution (primary) was prepared by dissolving 10 mg of Febuxostat in 10 ml of 0.1 N NaOH to get concentration of 1mg/ml (1000μg/ml) and was stored at + 4ºC during the study. Secondary stock solution was prepared daily by diluting 1ml of the primary stock solution to final volume of 10 ml using 0.1 N NaOH to get concentration of 0.1mg/ml (100μg/ml).
Preparation of calibration standard solutions
Suitable aliquots of the secondary standard solution of Febuxostat (10–70 ml) were transferred to a series of calibrated 100 ml standard volumetric flasks and the volume was made up to the mark with 0.1 N NaOH.
Scanning and determination of maximum wavelength (λ max)
In order to ascertain the wavelength of maximum absorption (λ max) of the drug, qualitative solution of the drug was prepared in 0.1 N NaOH and scanned by using UV spectrophotometer within the wavelength region of 200 – 400 nm against 0.1 N NaOH as blank. The calibration curve was constructed for absorbance versus concentration of Febuxostat. The resulting spectrum was shown in Figure 2, and the absorption curve showed characteristic absorption maxima at 275 nm for Febuxostat.
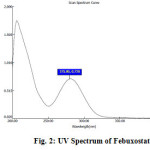 |
Figure 2: UV Spectrum of Febuxostat. |
Results and Discussion
The purpose of the present study is to develop a rapid, sensitive, precise and accurate ultra violet – spectrophotometric method for its validation in bulk and pharmaceutical dosage forms by conducting systematic trails.
Method Validation
Validation is one of the most important steps in method development for analytical determinations. The main validation parameters such as linearity and range, accuracy and precision, recovery, ruggedness, limit of detection (LOD) and limit of quantitation (LOQ) were evaluated in developed method 13–16.
Linearity and range
The absorbance values for different standard solutions (10, 20. 30, 40, 50, 60 and 70μg/ml) of Febuxostat were measured at λ max 275 nm, against 0.1 N NaOH as blank. Some workers 7,8 reported that the λmax was in the range 306–324 for Febuxostat in methanol medium. When a methanolic solution of Febuxostat was diluted with sodium hydroxide solution, the λ max shifted to 260 nm from 315nm, whereas, λ max was unaffected by diluting with hydrochloric acid solution 9. Each point of the calibration graph corresponded to the mean value obtained from three independent measurements (Table 1). The calibration graph (Fig. 3) was constructed by plotting absorbance versus concentration of Febuxostat. The calibration graph of the absorbance versus concentration was found to be linear over the range of 10 – 70 μg/ml for the proposed method. The linear regression equation obtained was y = 0.0138x – 0.001 where y is the absorbance and x is the concentration of pure drug solution. The summary of optical and regression parameters was shown in Table 2.
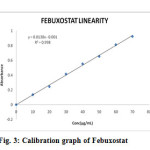 |
Figure 3: Calibration graph of Febuxostat.
|
 
Table 1: Calibration values of Febuxostat
|
Concentration (µg/ml) |
Absorbance* |
|
0 |
0.000 |
|
10 |
0.139 |
|
20 |
0.279 |
|
30 |
0.415 |
|
40 |
0.553 |
|
50 |
0.685 |
|
60 |
0.833 |
|
70 |
0.955 |
* Average of three determinations.
Table 2: Statistical data of the regression equations and validation parameters for of Febuxostat
|
S. No. |
Parameter |
Observation |
|
Optical characteristics |
||
|
1. |
Apparent molar absorptivity (l/mol.cm) |
4334 |
|
2. |
Sandell’s sensitivity (µg/cm2/A) |
0.07299 |
|
Regression analysis |
||
|
1. |
Slope |
0.0138 |
|
2. |
Intercept |
0.001 |
|
3. |
Regression coefficient (r) |
0.998 |
|
Validation parameters |
||
|
1. |
λ max (nm) |
275 |
|
2. |
Beer’s Law Limit (Linearity, μg/ml) |
10 – 70 |
|
3. |
Limit of detection (μg/ml) |
0.239 |
|
4. |
Limit of quantitation (μg/ml) |
0.725 |
Accuracy
To determine the accuracy of the proposed method, recovery studies were carried out by adding different amounts (50%, 100%, and 150%) of bulk samples of febuxostat to 20 μg/ml so that overall concentration will be within the linearity range. The accuracy was expressed in terms of percent recovery. The mean of percentage recovery values varied from 100.01 to 100.35 (Table 3), whereas in Paramdeep et al., method7 the range was 99.23 – 100.58. The statistical analysis of data obtained for the estimation of febuxostat indicates a high level of accuracy for the proposed method as evidenced by the low values of standard deviation and relative standard deviation.
Table 3: Recovery of Febuxostat using the proposed UV method
|
Level of recovery (%) |
Amount of drug added (μg/ml) |
Amount of drug recovered (μg/ml) |
% of recovery |
||
|
Mean ± SD * |
%RSD |
Mean ± SD* |
%RSD |
||
|
50 |
30 |
30.00 ± 0.11 |
0.37 |
100.01 ± 0.37 |
0.37 |
|
100 |
40 |
40.14 ± 0.06 |
0.15 |
100.35 ± 0.15 |
0.15 |
|
150 |
50 |
50.14 ± 0.06 |
0.13 |
100.27 ± 0.13 |
0.13 |
* Average of three determinations
Precision
The precision of a method is defined as the closeness of agreement between independent test results obtained under optimum conditions. Two different concentrations of febuxostat in the linear range (30 and 40 μg/ml) were analyzed in six independent series in the same day (intra-day precision) and in six consecutive days (inter-day precision) and results were given in Table 4.
The % RSD values of intra-day and inter-day studied for the proposed method were in the ranges 0.451 – 0.220 and 0.218 – 0.076 respectively compared to 0.08 – 2.05 and 0.174 – 1.862 respectively of method developed by Paramdeep et al., 7. This concludes that the precision of the current method was satisfactory.
Table 4: Precision of the proposed method
|
Used Concentration (μg / ml) |
Determined Concentration (μg /ml)* |
|||
|
Intra-day variation |
Inter-day variation * |
|||
|
Mean ± SD |
% RSD |
Mean ± SD |
% RSD |
|
| 30 |
30.04 ± 0.136 |
0.451 |
30.07 ± 0.065 |
0.218 |
| 40 |
39.95 ± 0.088 |
0.220 |
39.95 ± 0.030 |
0.076 |
* Average of six determinations
Ruggedness
The ruggedness of the proposed method was evaluated by applying the developed procedure for assay of 30 μg/ml and 40 μg/ml of febuxostat using the same instrument by two different analysts under the same optimized conditions at different days. The obtained results were found to be reproducible, since there was no significant difference between analysts (Table 5). The % of RSD for two different analysts were in the range of 0.291 – 0.513 compared to 0.6513 – 1.0692 of Paramdeep et al., method7. Thus, the proposed method was rugged.
Table 5: Ruggedness data of Febuxostat by two analysts at different days
|
Used Concentration (μg / ml) |
Determined Concentration (μg /ml)* |
|||
|
Analyst 1 |
Analyst 2 |
|||
|
Mean ± SD |
% RSD |
Mean ± SD |
% RSD |
|
|
30 |
30.16 ± 0.155 |
0.513 |
30.17 ± 0.088 |
0.291 |
|
40 |
39.99 ± 0.148 |
0.370 |
40.05 ± 0.099 |
0.247 |
* Average of six determinations
Detection of LOD and LOQ
For determination of sensitivity of the proposed method, LOD and LOQ were calculated. Based on the signal to noise ratio they were quantified. The lowest detectable concentration of the analyte by the method is LOD where as the minimum quantifiable concentration is LOQ. LOD and LOQ for febuxostat were calculated according to the ICH guidelines by using S (relative standard deviation of the response) and σ (slope of the calibration curve).
LOD = 3.3 × σ /S = 0.239 μg /ml and
LOQ = 10 × σ /S = 0.725 μg /ml
In the method developed by Sheth et al., 9, LOD and LOQ values were 0.5871 and 1.7793 respectively. These results indicate that the present proposed method was sensitive to detect and quantify.
Analysis of pharmaceutical formulations
Ten Febuxostat tablets were taken and the average weight was determined. The tablets were ground and mixed well. The powder of the sample equivalent to 10 mg of Febuxostat was accurately weighed and transferred into a 10 ml volumetric flask. About 7 ml of diluents was added, sonicated to dissolve it completely and made the volume up to the mark with diluent. Mixed well and filtered through Whatmann filter paper. An aliquot equivalent to 20 mg of the sample was pipetted into a 10 ml volumetric flask and made up to the mark after filtration. From the absorbance value, the drug content per tablet (on an average weight basis) was calculated and the results were tabulated (Table 6). Good recovery values of drugs shows that the proposed method can be successfully applied to the determination of febuxostat in pharmaceutical formulations without any interference from common excipients.
Table 6: Assay of Pharmaceutical Formulation
|
Formulation |
Label Claimed (mg) |
Amount Recovered* (mg) |
% Drug Recovered |
%RSD
|
|
FEBUGET® Tablets |
40 |
39.5653±0.2898 |
98.91 |
0.7326 |
* Average of three determinations
Conclusions
In the proposed UV spectrophotometric method for the estimation of febuxostat, low cost sodium hydroxide solution replaced the usage of organic solvents. This method has the lowest LOD value and is more sensitive method. From the results obtained, we concluded that the suggested method showed high sensitivity, accuracy and precision. Therefore the developed method can be used for routine analysis for estimation of febuxostat in bulk and pharmaceutical dosage forms.
Acknowledgements
The authors are grateful to Chalapathi Institute of Pharmaceutical Sciences, Chalapathi Nagar, Lam, Guntur Dist, Andhra Pradesh, India for providing the necessary research facilities.
References
- International Nonproprietary Names for Pharmaceutical Substances (INN), (Rec.INN: List 47), WHO Drug Information, 16(1), 81-112(2002).
- Anjana P., Mridul C., Prakash H. and Daulat M., Nat. J.. Phy. Ph. Pharmaco., 2(1), 23–28(2012).
- Kuang-Hui Yu, Re. Pat. Inflam. All. Dr. Dis., 1, 69-75(2007).
- Cong Z., Shao-jie W, Rong-li M.A., Ping M and Tian-hong Z, J. Shenyang Pharma. Uni., 27(8), 648-651(2010).
- Ojikumar L., Shivaji P and Amit Hande, Dr. Test. Ana., DOI 10.1002/dta.420(2012).
- Zhang W.L., Cheng H. and Yang G.P., J. Acta Metallur. Sini., 16(10), 1148-1152(2011).
- Paramdeep B., Mohd Salman, H., Siddiqui H., Abdul Ansari M., Tariq Mehmood and Kuldeep Singh, In. J Pharm. Sci. Res., 2(10), 2655-2659(2011).
- Sameer H.L., and Bhalekar M.R., J. Phar. Res., 4(9), 3122-3123(2011).
- Sheth M, Joshi S and M. Patel., I. J. Pharma. Sci. Res., 3(6),1621-1624(2012).
- Ivana S., Goran N. and Vladimir B., Macedonian J. Chem. Che. Eng., 27(2),149–156 (2008).
- Kumaraswamy D., Stephenrathinaraj B., Rajveer C., Sudharshin S., Bhupendra S. and Rao P.R., I. J. Phar. Bio Sci., 1(2), 1-6(2010).
- Nisha P., Falguni T., Swati S., Mohit P. and Amit P., Cur. Ph. Res., 2(2), 480-486(2012).
- International Conference on Harmonization, (ICH), Validation of Analytical Procedures: Text and Methodology, Q2 (R1), (2005).
- International Conference on Harmonization, (ICH), Validation procedures: Definition terminology federal register, 60:11260 (1995).
- United States Pharmacopeia, United States Pharmacopeia Convention, 24th ed., 170 (2000).
- Sethi P.D. HPLC quantitative analysis of pharmaceutical formulations, CBS publications, 5.ed. India, 160 (2001).

This work is licensed under a Creative Commons Attribution 4.0 International License.
![]()
A New Edition of Web of Science
Journal Impact Factor
2022: 0.5
Five Year: 0.8
Journal is Indexed in

Cabells Whitelist
![]()


