Nitrogen Removal from an Aerobically Digested Domestic Wastewater using Anoxic/Oxic (A/O) Reactor Packed with Non-woven Filter Materials
John Leju Celestino Ladu1,2, Ting Ting Wei1 , Xiwu Lu1 * and Meiling Zhang1
1School of Energy and Environment, Department of Environmental Science and Engineering, Southeast University, Nanjing - 210 096, P. R. China. 2College of Natural Resources and Environmental Studies, Department of Environmental Studies, University of Juba, South Sudan.
This study examined the removal of nitrogen from domestic wastewater through the application of anoxic/oxic (A/O) bio-reactor system. Influent and effluent samples were collected from the system and tested. Chemical oxygen demand (COD), NH4 +-N and NO3 - -N were analyzed. Different hydraulic retention time (HRT) and recycle ratios were applied to assess its influence on removal efficiency of the reactor. The temperature was controlled between 20 to 24o C and pH was 7.7 – 8.2. The result revealed average COD removal efficiencies of 72.1%, average removal of NH4 +-N and NO3 - -N was 92% and 54% respectively. The result obtained reflects that, the A/O reactor is suitable and efficient in nitrogen removal.
KEYWORDS:Domestic wastewater; anoxic/oxic (A/O) bio-reactor system; Hydraulic retention time (HRT); Recycle ratios; Nitrification; denitrification
Download this article as:| Copy the following to cite this article: Ladu J. L. C, Wei T. T, Lu X, Zhang M. Nitrogen Removal from an Aerobically Digested Domestic Wastewater using Anoxic/Oxic (A/O) Reactor Packed with Non-woven Filter Materials. Orient J Chem 2013;29(1). |
| Copy the following to cite this URL: Ladu J. L. C, Wei T. T, Lu X, Zhang M. Nitrogen Removal from an Aerobically Digested Domestic Wastewater using Anoxic/Oxic (A/O) Reactor Packed with Non-woven Filter Materials. Available from: http://www.orientjchem.org/?p=11935 |
Introduction
Over the last two decades, rapid population growth, booming economic growth, low wastewater treatment rate and illegal discharge of domestic and industrial wastewater, and non-point pollution sources have resulted in severe water quality degradation in rural parts of China, expressed by the deterioration of surface water, the eutrophication of lakes and the increase of nitrate in surface and groundwater.
Although domestic wastewater is considered a pollutant, it can also be an important resource when it’s properly treated (Otterpohl et al., 1999, 2003; Elmitwalli et al., 2003). Domestic wastewater is the wastewater generated domestically in the households and characterized by low content of nutrients and pathogens (Otterpohl et al., 1999; Jefferson et al., 1999; Eriksson et al., 2002). Domestic wastewater can be categorized into two different groups based on their source of origin as; black water from toilets (faeces, urine)and grey water from bath, wash and kitchen.
In recent days, domestic wastewater has been widely studied by many researchers using different treatment processes, either by by application of high-rate aerobic systems, such as rotating biological contactor (Nolde, 1999), fluidised bed (Nolde, 1999), aerobic filter (Jefferson et al., 2000), membrane bioreactor (Jefferson et al., 2000), or by application of low-rate systems, such as slow sand filter (Jefferson et al., 1999) and vertical flow constructed wetlands (Otterpohl et al., 2003).
The potential advantages of A/O bioreactor system for the treatment of domestic wastewater is that, the anoxic treatment will oxidize organic materials in the waste while reducing the concentration of odorous compounds associated with anaerobic treatment. It is also cost effective since oxygen will only be required for ammonia oxidation and not for organic degradation which is far better than that of a totally aerobic system and hence, significant portion of nitrogen contained in the waste will be removed, decreasing land area requirements for supernatant application and lessening concerns over nitrogen contamination of surface and groundwater (Dale G. Frederick, 2002).
In view of the above cited, this study was carried out with an aim of investigating the efficiency of applying A/O bioreactor system for treating domestic wastewater.
Material and Methods
Experimental set-up
The experimental system is made up of a regulating tank (influent tank), three submersible pumps and the A/O bioreactor system. The lay out diagram of the experimental set-up is shown in fig.1. The anoxic reactor is made of Polyvinylchloride (PVC), with a total effective volume of 60 L and the oxic reactor (waterfall aeration contact oxidation) has three columns (parts) and made of Polyvinylchloride respectively, with a total capacity of 27L. The reactor was connected in series with an internal diameter of 0.2m and a height of 2m for the anoxic columns and width size of 30cm for each oxic column but different effective depth of 10cm, 20 and 30cm for first, second and third oxic column. Both of the reactors column (A/O) was filled with a non-woven fabric filter materials of length 2500mm, width of 50mm, surface area of 150m2/m3 and with porosity of 97%. The main parts of the bioreactor system used in this experimental study composed of the main two columns which is the anoxic column and oxic columns, an air compressor for aeration, longer pump (model BT100) to control the influent flow rate, air flow meter to achieve the desired DO concentration according to the experimental condition requirement, automatic aeration mixers to provide aeration in the anoxic and oxic zones and to maintain the biomass in suspension, influent wastewater valves, effluent water valves, internal circulation valves, sludge discharge, and plastic pipes and others.
Apparatus and flow chart
This research was carried out in Southeast university campus of Taihu Lake environmental program, in Wuxi, Jiangsu Province. Wastewater treatment system was built according to Fig. 1. This system integrated anoxic and oxic (waterfall aeration contact oxidation) column. The column operation was typically run as a complete system under different environment state conditions (anoxic/oxic) based on phase type.
The mean hydraulic residence time in anoxic column was 24 hours. It mostly pretreated the sewage and reduced organic compounds. The oxic (waterfall aeration contact oxidation) columns achieved organic compounds decomposition and nitrogen nitrification. The effluent from the oxidation column was partly recycled to anoxic column for denitrification. By this process, this system integrated A/O methods and consequently enhanced effluent quality.
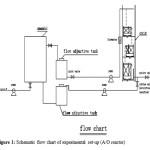 |
Figure 1: Schematic flow chart of experimental set-up (A/O reactor) Click here to View figure |
Schematic structure of oxic (waterfall aeration contact oxidation)
The oxic (waterfall aeration contact oxidation) was estranged into three units (Fig. 2). The height difference between each adjacent unit is 0.5m. The domestic sewage drops to some porous baffles after it was pumped to a certain height. There were many tiny holes with diameter of about 2 mm in the baffles. As the sewage passes through the tiny holes, it fall down in fine flow, which increased the interface with air and encourage oxygen transfer and hence, the sewage was aerated. After waterfall, the aerated sewage entered one oxidation unit attached with biological fillings. The biofilm on the fillings oxidized organic compound and nitrogen with oxygen.
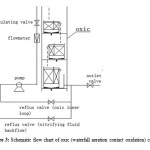 |
Figure 2: Schematic flow chart of oxic (waterfall aeration contact oxidation) column. Click here to View figure |
Wastewater for the experiment
Raw wastewater from a campus main manhole was pumped into a storing tank for sedimentation, and then fed into the reactor. The A/O reactor was inoculated with sludge obtained from Wuxi municipal sewage treatment plant which utilizes a typical change in the environmental state condition (anaerobic, anoxic, or aerobic) to treat municipal wastewater and performs simultaneous nitrification and denitrification as well. COD infiltrated ranges between 57 and 150 mg/l (summer season).
The reactor was operated continuously for 15 days as the start-up period until the reactor performance was stable (acclimatized). The effluent samples of every reactor were collected at the sampling ports of the reactor in separate bottles after every two days and stored in refrigerator at 4oC before experimental tests in the laboratory. The compositions of the studied area domestic raw wastewater are shown in table 1.
Table 1: Composition of the studied area domestic raw wastewater
| Parameter | Min | Max | Average |
| COD (mg/L) | 56.2 | 148.1 | 92.5 |
| NH4+-N (mg/L) | 7.13 | 24.99 | 11.04 |
| NO3–-N (mg/L) | 3.4 | 6.2 | 4.8 |
| pH | 7.7 | 8.2 | 7.9 |
Analytical Procedures
The following parameters and methods of testing shown in table 2 were used for this study. All the analyses were carried out in accordance with the Chinese standard methods for determination of municipal sludge in wastewater treatment plant(s) (CJT 221-2005). The samples were filtered through a 0.45-μm membrane filter before experimental analysis. The filtered sample preserved frozen for nitrates, ammonium nitrogen determination, whereas the other samples was then preserved with H2SO4. The sample preserved with acid was used for COD tests; acid added was about 1% of sample volume to be preserved. The influent and the effluent COD, NH4+-N, and NO3–-N were measured according to the standard methods recommended by US Environmental Protection Agency (APHA, 1999). Temperature and pH was measured by dissolved oxygen meter. The flow rate was controlled by a valve and incessantly regulated by the help of a pump.
Table 2: Test parameters and methods
| Parameters | Methods |
| COD (mg/l) | Potassium dichromate(GB 11914-89) |
| NH4+-N(mg/l) | Nessler’s reagent(GB7479-87) |
| NO3–-N(mg/l) | Sulfamate UV Spectrophotometer(GB7480-87) |
| pH | pH Meter |
| Temperature (oC) | Dissolved oxygen meter |
| DO | Dissolved oxygen meter |
Results and Discussion
Organic material removal (COD)
The average concentrations of COD in the influent and effluent during the experimental operations were 62.3mg/L and 17.4mg/L respectively. Figure 3 indicates the efficiency of the operated reactor in regards to COD removal. Most of the organic materials during the pre-nitrification are removed in the anoxic zone whereas the remaining organic materials will ultimately be degraded in the oxic reactor (Fu et al., 2009).
The average removal efficiency of COD was 72.1%. This result obtained is quite similar to the study conducted by Gurung A, et al (2011) who observed an average COD removal rate of 85% when the organic loading rate was 0.19 kg COD/m3/d and it is also similar with the result obtained by Rim and Han (2000) who observed an average TCOD removal rate of 80 to 95% when the organic loading rate was maintained in the range of 0.4 to 3.1 kg COD/m3/d. In this study, the average removal of COD was 68, 85, 83, 74 and 85% with effluent concentration of 17.5, 15.9, 7.7, 11.7 and 34mg/l experimented under HRT of 4, 5, 3, 2 and 1.5hrs with recycle ratios of 3, 2, and 1respectively (table 3). It can be noted that, COD removal efficiency increases with increase in recycle (R) value and HRT (figure 4). From these findings, the result reveals that A/O reactor was efficient in upholding a reasonably high and stable COD removal throughout the experimental period.
Table 3: Average COD concentration in the influent, anoxic and oxic reactors and their removal performance with respect to different HRT and recycle ratios.
| HRT (h) | COD inf tank (mg/l) | COD Anoxic (mg/l) | COD Oxic (mg/l) | Removal efficiency (%) | Recycle |
| 5 | 148.1 | 108.7 | 15.9 | 85 | 1 |
| 4 | 86.9 | 54.3 | 17.5 | 68 | 2 |
| 3 | 56.2 | 45.7 | 7.7 | 83 | 2 |
| 2 | 69.1 | 44.4 | 11.7 | 74 | 3 |
| 1.5 | 95.2 | 58.5 | 34 | 42 | 3 |
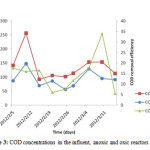 |
Figure 3: COD concentrations in the influent, anoxic and oxic reactors. Click here to View figure |
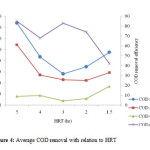 |
Figure 4: Average COD removal with relation to HRT. Click here to View figure |
NH4+-N and NO3–-N removal
In order to monitor the nitrification process in the reactor, the concentrations of NH4 +-N and NO3–-N in the effluent of the nitrification reactor were tested. The performance of the A/O reactor with respect to NH4 +-N removal under different recycle ratios and HRT is shown in table 4 and figure 5 and 6. In the process of nitrification, the oxidation of NH4 +-N releases hydrogen ions (H+) that reduces the pH in the nitrification reactor and might hinder the nitrification performance (An et al., 2007; Vanotti and Hunt, 2000). The study by Yoo et al., 1999 revealed that, alkalinity plays greater role in nitrification process and thus, lack of alkalinity in the nitrification reactor could lead to poor NH4 +-N removal efficiency. In order to minimize such drawback, sodium bicarbonate (NaHCO3) as an external source of alkalinity was added throughout the study period whenever necessary. Since temperature is one of the important environmental factor in biological treatment and significantly affect the activity of nitrifying bacteria in the nitrification reactor(Zhang et al., 2009), temperature in this study was controlled and maintained in the range of 20 to 26oC using stainless steel heater immersed in the reactor. In the study by Zhang et al, (2009), highest ammonium oxidation rate was obtained at temperature of 31°C and the lowest value was experimented at a temperature of 15°C. The average concentrations of NH4 +-N in the influent, anoxic and effluent oxic reactor during the experimental operations were 11, 2.4 and 1.1 mg/L respectively (table 4). The average removal efficiency was 91.8% higher than that obtained by Gurung A, et al (2011). The average removal efficiency of total NH4 +-N in the whole reactor was 92%. The average removal of NH4 +-N was 81.4, 92.3, 94.3, 94.4 and 96.7 % with effluent concentration of 3.5, 0.6, 0.5 and 0.3mg/l operated with HRT of 4, 2, 5, 1.5 and 3hrs with recycle ratios of 2, 3, and 1respectively (table 4).
According to literatures and a study by Yoo et al., 1999, the optimum pH condition for nitrifying bacteria is 7.5 to 8.6. For this study, the value of pH was maintained between the ranges of 7.7 to 8.2 indicating satisfactory condition of the reactor. In order for simultaneous nitrification and denitrification to take place in the anoxic reactor, the reactor was intermittently aerated. The average DO concentration in the reactor was in range of 2.5 to 3.2 mg O2/l, respectively.
Table 4: Average NH4 +-N concentration in the influent, anoxic and oxic reactors and their removal performance with respect to different HRT and recycle ratios
| HRT (h) | NH4+-N inf tank (mg/l) | NH4+-N Anoxic (mg/l) | NH4+-N Oxic (mg/l) | Removal efficiency (%) | Recycle |
| 5 | 8.7 | 2.9 | 0.5 | 94.3 | 1 |
| 4 | 18.8 | 3.9 | 3.5 | 81.4 | 2 |
| 3 | 9 | 1.9 | 0.3 | 96.7 | 2 |
| 2 | 7.8 | 1.6 | 0.6 | 92.3 | 3 |
| 1.5 | 10..7 | 1.5 | 0.6 | 94.4 | 3 |
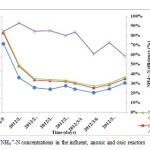 |
Figure 5: NH4 +-N concentrations in the influent, anoxic and oxic reactors. Click here to View figure |
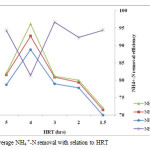 |
Figure 6: Average NH4 +-N removal with relation to HRT. Click here to View figure |
In figure 7, the average concentration of NO3–-N in the influent, anoxic and oxic reactors and the removal efficiency throughout the operation period are illustrated. During the operation, there is high concentration NO3–-N in the effluent of the nitrification reactor. Usually, NO3–-N accumulates whenever the levels of DO concentration decreases in the nitrification reactor. According to the study by Munch et al., 1996, the activity of Nitrobactor bacteria is inhibited even at the DO concentration of 7 mg/l. The average removal efficiency of total NO3–-N in the whole reactor was 54%. The average removal (released) of NO3–-N was 38.8, 47, 55.3, 63.6 and 63.7% with effluent concentration of 4.1, 6.1, 5.5, 4.4 and 4.5mg/l operated with HRT of 3, 4, 1.5, 5 and 2hrs with recycle ratios of 2, 3, and 1 respectively (table 5 and figure 7 and 8). Usually increase in recycle leads to high removal efficiency of NO3–-N although other factors can influence the reactor performance. But the effluent of the oxic reactor contained relatively high concentration of NO3–-N (11mg/l) as compared to anoxic reactor (9mg/l)and this could be attributed to the high DO levels in the oxic reactor. Increase in recycle ratio (R) enhances the denitrification efficiency of A/O but according to Tan and Ng, 2008, high increase of recycle ratio also inhibits denitrification. Recycle ratio (R) greater than 5 is not recommended for the A/O process (Baeza et al., 2004).
Table 5: Average NO3– -N concentration in the influent, anoxic and oxic reactors and their removal performance with respect to different HRT and recycle ratios
| HRT (h) | NO3- -N inf tank (mg/l) | NO3- -N Anoxic (mg/l) | NO3- -N Oxic (mg/l) | Removal efficiency (%) | Recycle |
| 5 | 4.4 | 7.3 | 12.1 | 63.6 | 1 |
| 4 | 6.1 | 5.8 | 11.5 | 47 | 2 |
| 3 | 4.1 | 10 | 6.7 | 38.8 | 2 |
| 2 | 4.5 | 11 | 12.4 | 63.7 | 3 |
| 1.5 | 5.5 | 11.5 | 12.3 | 55.3 | 3 |
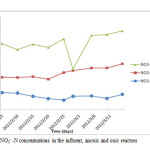 |
Figure 7: NO3– -N concentrations in the influent, anoxic and oxic reactors. Click here to View figure |
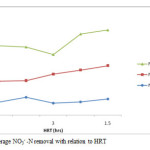 |
Figure 8: Average NO3– -N removal with relation to HRT. Click here to View figure |
Conclusions
This study used A/O for treatment of campus domestic wastewater at different operating condition such as HRT and recycle ratios. According to the result obtained during the whole experimental operation, the A/O reactor appears to be well suited to the treatment of this kind of low strength campus domestic wastewater. The average COD removal efficiencies were 68, 85, 83, 74 and 85% at HRT of 4, 5, 3, 2 and 1.5hrs respectively. Since heterotroph uses organic substrates as a source of carbon, heterotrophic denitrification is responsible for COD degradation. The average removal of NH4+-N was 81.4, 92.3, 94.3, 94.4 and 96.7 % with HRT of 4, 2, 5, 1.5 and 3hrs respectively. The average removal of NO3–-N was 38.8, 47, 55.3, 63.6 and 63.7% with effluent concentration of 4.1, 6.1, 5.5, 4.4 and 4.5mg/l with HRT of 3, 4, 1.5, 5 and 2hrs respectively. The result revealed that, increase in recycle ratios leads to high removal efficiency in nutrients. The result obtained revealed that, the A/O reactor is suitable and efficient in nitrogen removal
Acknowledgements
This research has been supported by the National Natural Science Foundation of China (51078074) and the Key Project of Chinese Ministry of Education (308010).
References
- APHA. Standard Methods for the Examination of Water and Wastewater, 19th ed. WashingtonDC, Amer Public Health Assoc, 1995. (1999).
- The 21 SEPA water and wastewater monitoring and analysis method (fourth edition) [M] Beijing: China Environmental Science Press, 2002. (In Chinese)
- He Yanling. Anaerobic biological wastewater treatment [M] China Light Industry Press, (1998) (In Chinese)
- Rim JM, Han DJ. Process development for nitrogen removal of swine waste. Water Sci. Technol. 42: pp 239-246 (2000).
- Gurung, A., Kang, W.Chang and Oh Sang-Eun. Removal of nitrogen from anaerobically digested swine wastewater using an anoxic/oxic (A/O) process complemented with a sulfur-packed biofilter. African Journal of Biotechnology Vol. 10(48), pp. 9831-9838, (2011)
- Munch EV, Lant P, Keller J. Simultaneous nitrification and denitrification in bench-scale sequencing batch reactors. Water Res. 30: pp 277-284 (1996).
- Baeza JA, Gabriel D, Lafuente J. Effect of internal recycle on the nitrogen removal efficiency of an anaerobic/anoxic/oxic (A2/O) wastewater treatment plant (WWTP). Process Biochem. 39: pp 1615-1624 (2004).
- Yoo H, Ahn KH, Lee HJ, Lee KH, Kwak YJ, Song KG. Nitrogen removal from synthetic wastewater by simultaneous nitrification and denitrification (SND) via nitrite in an intermittently aerated reactor. Water Res. 33: 145-154 (1999).
- An , JY., Kwon, JC., Ahn, DW., Shin, D.H., Shin, H.S., Kim, B.W.. Efficient nitrogen removal in a pilot system based on upflow multi-layer bioreactor for treatment of strong nitrogenous swine wastewater. Process Biochem. 42: pp 764-772 (2007).
- Vanotti MB, Hunt PG. Nitrification treatment of swine wastewater with acclimated nitrifying sludge immolized in polymer pellets. Am. Soc. Agric. Eng. 43: pp 405-413 (2000).
- Zhang L, Wei C, Zhang K, Zhang C, Fang Q, Li S. Effects of temperature on simultaneous nitrification and denitrification via nitrite in a sequencing batch biofilm reactor. Bioprocess Biosyst. Eng. 32: pp 175-182 (2009).
- Tan TW, Ng HY. Influence of mixed liquor recycle ratio and dissolved oxygen on performance of pre-denitrification submerged membrane bioreactors. Water Res. 42: pp 1122-1132 (2008).
- Otterpohl, R., Braun, U., Oldenburg, M. Innovative technologies for decentralised water, wastewater and biowaste management in urban and peri-urban areas. Water Sci. Technol. 48 (11/12), pp 23–32 (2003).
- Elmitwalli, T.A., van Lier, J., Zeeman, G., Lettinga, G. Treatment of domestic sewage at low temperature in a two anaerobic step system followed by a trickling filter. Water Sci. Technol. 48 (11/12), pp 199–206 (2003).
- Otterpohl, R., Albold, A., Oldenburg, M. Source control in urban sanitation and waste management: ten systems with reuse of resources. Water Sci. Technol. 39 (5), pp 153–160 (1999).
- Otterpohl, R., Braun, U., Oldenburg, M. Innovative technologies for decentralised water, wastewater and biowaste management in urban and peri-urban areas. Water Sci.Technol. 48 (11/12), pp 23–32 (2003).
- Jefferson, B., Laine, A., Parsons, S., Stephenson, T., Judd, S. Technologies for domestic wastewater recycling. Urban Water 1, pp 285–292 (1999).
- Eriksson, E., Auffarth, K., Henze, M., Ledin, A. Characteristics of grey wastewater. Urban Water 4 (1), 85–104 (2002).
- Nolde, E. Greywater reuse systems for toilet flushing in multi-storey building-over ten years experience in Berlin. Urban Water 1, pp 275–284 (1999).
- Jefferson, B., Laine, A.L., Judd, S.J., Stephenson, T. Membrane bioreactors and their role in wastewater reuse. Water Sci. Tech. 41 (1), pp 197–204 (2000).
- Dale G. Frederick. Application of anoxic.aerobic (A/A) biological treatment to swine wastewater. Submitted to the Graduate Faculty of the Louisiana State University and Agricultural and Mechanical College, University of Southwestern Louisiana (2002)

This work is licensed under a Creative Commons Attribution 4.0 International License.
![]()
A New Edition of Web of Science
Journal Impact Factor
2022: 0.5
Five Year: 0.8
Journal is Indexed in

Cabells Whitelist
![]()


